Massive star formation and feedback in W49A: The source of our Galaxy’s most luminous water maser outflow††thanks: Based on observations obtained at the Gemini Observatory, which is operated by the Association of Universities for Research in Astronomy (AURA) under a cooperative agreement with the NSF on behalf of the Gemini partnership: the National Science Foundation (United States), the Science and Technology Facilities Council (United Kingdom), the National Research Council (Canada), CONICYT (Chile), the Australian Research Council (Australia), CNPq (Brazil) and CONICET (Argentina).
Abstract
We present high spatial resolution mid-infrared (IR) images of the ring of ultracompact H ii regions in W49A obtained at Gemini North, allowing us to identify the driving source of its powerful H2O maser outflow. These data also confirm our previous report that several radio sources in the ring are undetected in the mid-IR because they are embedded deep inside the cloud core. We locate the source of the water maser outflow at the position of the compact mid-IR peak of source G (source G:IRS1) to within 007. This IR source is not coincident with any identified compact radio continuum source, but is coincident with a hot molecular core, so we propose that G:IRS1 is a hot core driving an outflow analogous to the wide-angle bipolar outflow in OMC-1. G:IRS1 is at the origin of a larger bipolar cavity and CO outflow. The water maser outflow is orthogonal to the bipolar CO cavity, so the masers probably reside near its waist in the thin cavity walls. Models of the IR emission require a massive protostar with 45 , 3105 L⊙, and an effective envelope accretion rate of 10-3 yr-1. Feedback from the central star could potentially drive the small-scale H2O maser outflow, but it has insufficient radiative momentum to have driven the large-scale bipolar CO outflow, requiring that this massive star had an active accretion disk over the past 104 yr. Combined with the spatialy resolved morphology in IR images, G:IRS1 in W49 provides compelling evidence for a massive protostar that formed by accreting from a disk, accompanied by a bipolar outflow.
keywords:
H ii regions — ISM: individual (W49A) — ISM: jets and outflows — stars: formation — stars: pre–main-sequence1 INTRODUCTION
Because of their extremely short Kelvin-Helmholtz timescales, massive protostars above 8 begin burning H while still accreting and while still buried deep in their natal cloud cores. When the massive star reaches the main-sequence and ionizes its surroundings, it forms an ultracompact H ii (UCHII) region (Wood & Churchwell 1989; Churchwell 2002; Hoare et al. 2007), with typical sizes 0.1 pc. Precursors of UCHII regions are thought to be dense hot molecular cores (e.g., Kurtz et al. 2000), but early accretion phases are not as well understood as they are for low-mass stars. With spherical symmetry, radiation pressure on dust would lead to a limit at about 10 for the mass that could be accreted onto a star (e.g., Wolfire & Cassinelli 1987; Kahn 1974; Larson 1969), or somewhat higher if momentum of infalling matter can overwhelm the dust sublimation radius. The way in which massive stars overcome this difficulty to reach 40-150 is still a topic of current research.
One proposed solution is geometric: in scaling up the traditional view of low-mass star formation that involves accretion disks and collimated outflows (Keto 2003; McKee & Tan 2003), a massive protostar may circumvent the radiation pressure problem with non-spherical geometry. With an optically thick disk and an optically thin bipolar flow, the disk can potentially shadow infalling material while radiative luminosity can, in principle, escape out the polar cavities without halting the accretion (Nakano 1989; Jijina & Adams 1996; Yorke & Sonnhalter 2002; Krumholz et al. 2005). Recent numerical simulations by Krumholz et al. (2009) argue that radiation pressure does not halt accretion, allowing the formation of very massive stars and multiple star systems from a common core. On the other hand, massive stars tend to form in dense clustered environments where the effects of their neighbors may influence the star formation process. In clustered environments, coalescence of lower-mass protostars has been suggested as another way to get past the radiation-pressure limit (e.g., Bonnell et al. 1998; Bonnell & Bate 2002; Stahler et al. 2000; Bally & Zinnecker 2005). It is not yet clear from observations if the geometry of a disk plus a bipolar cavity is associated with the formation of the most massive stars up to 150 (Figer 2005; Kroupa 2005), while fragmentation in massive disks may also interfere with forming the most massive stars by accretion (Kratter & Matzner 2006; Krumholz et al. 2009).
The massive star-forming complex W49A is an excellent laboratory in which to investigate the processes occurring during the enshrouded early lives of massive stars, despite its large distance of 11.4 kpc (Gwinn et al. 1992).111W49B is an unrelated supernova remnant located nearby in projection (Keohane et al. 2007). W49A contains one of the richest known clusters of UCHII regions distributed across only a few pc, buried inside one of the most massive (106 ) giant molecular cloud cores in the Galaxy, with a cumulative luminosity of well over 107 (see Becklin et al. 1973; Dreher et al. 1984; Welch et al. 1987; Dickel & Goss 1990; De Pree et al. 1997, 2000; Smith et al. 2000). Its content of massive stars is similar to famous giant H ii regions like 30 Doradus, the Carina Nebula, and NGC 3603, but it is younger, with most of its O-type stars still embedded deep in the molecular cloud. Wood & Churchwell (1989) noted several different morphological types of UCHII regions: spherical/unresolved, cometary, shell, irregular or multiple-peaked, and bipolar (added more recently in place of core/halo), all of which are seen in W49 (De Pree et al. 1997, 2005).
This compact cluster of 40–50 UCHII regions in W49 introduced the UCHII region “lifetime problem” because the sound crossing time of this region exceeds the expected duration of the free expansion phase for any single UCHII region (Welch et al. 1987). (This synchronization may also imply that the burst of star formation was triggered by an external agent; Welch et al. 1987.) A statistical expression of the UCHII region lifetime problem is that the fraction of UCHII regions compared to exposed O-type stars in the Galaxy suggests that the UCHII region lifetime is a significant fraction of the O star lifetime, and is therefore considerbly longer than the free expansion time of the H ii region (see Wood & Churchwell 1989). Note, however, that Bourke et al. (2005) suggest that some low-mass protostars may contaminate the Wood & Churchwell sample, so the implied lifetimes may be shorter (see also Hoare et al. 2007).
About a dozen of these UCHII regions are arranged in a remarkable 2 pc diameter ring at the center of W49 (Welch et al. 1987), and the origin of this ring remains unknown. The brightest member of the ring in the radio continuum is denoted source G, which breaks up into several components at sub-arcsecond resolution (De Pree et al. 1997, 2000). Source G is also the brightest source in the ring in the thermal-infrared (IR) (Smith et al. 2000).
Source G is of particular interest because it harbors the most luminous H2O maser outflow known in the Milky Way (Gwinn, Moran, & Reid 1992). The spatial confusion between radio continuum sources, H2O masers, and mid-IR emission has not been fully unraveled, however. This is, in fact, one of the main results of the present study: we identify the driving source of the H2O maser outflow by its thermal-IR emission from dust, and it is apparently not an ionized UCHII region. On larger scales, mid-IR emission is well-correlated with radio continuum emission from UCHII regions in W49 (Smith et al. 2000) and in other UCHII regions (e.g., G29.960.2; De Buizer et al. 2002), but this is generally not the case for H2O maser sources, which tend to have point-like IR emission but only weak or undetected radio emission (Tofani et al. 1995). High angular resolution is key, due to W49’s large distance from Earth of 11.4 kpc. There have only been two previous mid-IR imaging studies of source G (Becklin et al. 1973; Smith et al. 2000), and one low-resolution mid-IR spectrum has been obtained (Gillet et al. 1975). None of these had sufficient angular resolution for meaningful comparison with the complex, multi-peaked radio continuum structure. The mid-IR imaging with the 8 m Gemini Observatory helps remedy this, with angular resolution comparable to that achieved toward W49 with the VLA at centimeter wavelengths.
We present our new mid-IR Gemini images in §2, including a discussion of how we spatially aligned the radio and IR data. Then in §3 we discuss results for sources in the W49 ring other than source G, and in §4 we discuss source G in more detail, comparing our new Gemini images to the radio continuum and maser emission. This allows us to construct a geometric working model for the complex source, and to model the IR emission in order to constrain the physical paramters of the embedded driving source. Finally, in §5 we discuss the significance of these observations of source G and corresponding implications for the process of massive star formation and feedback.
2 OBSERVATIONS
2.1 Gemini North/Michelle Images
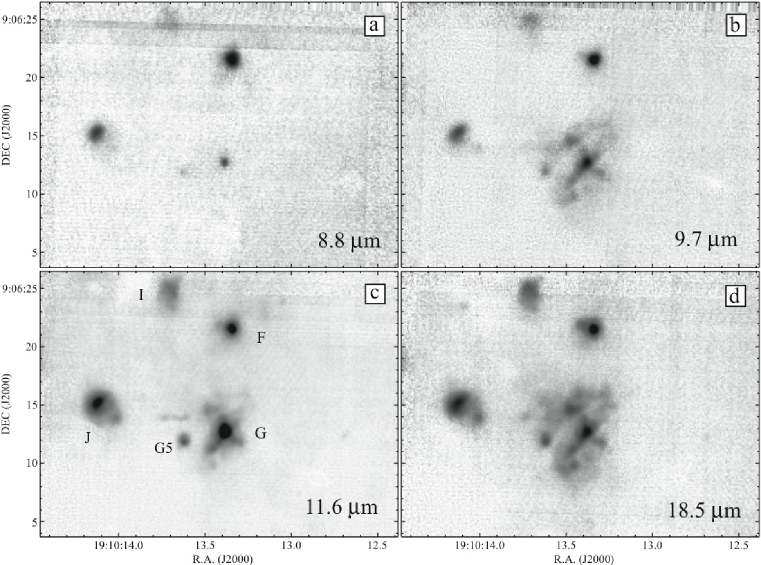
We obtained thermal-IR images of W49A at wavelengths of 8.8, 9.7, 11.6, and 18.5 m using Michelle on the Gemini North telescope. Table 1 lists observation dates and other details. Michelle is the facility mid-IR imager and spectrograph on Gemini North, with a 320240 pixel Si:As IBC array, a pixel scale on the 8 m Gemini North telescope of 0099, and a resulting field of view of 317238. The observations were taken with a 15″ north-south chop throw. W49A is a complex, bright extended source, so some fainter emitting sources contaminated the reference sky positions, leading to negative image residuals in the chop-nod data. These artifacts were corrected as well as possible using the same technique that we used previously on a large mosaic of the bright inner regions of the Orion Nebula (see Smith et al. 2004, 2005). We subdivided the pixels without interpolation in each of the various images and then shifted and co-added them, to produce a final mosaic image at each of the four wavelengths we observed. The measured FWHM in our final registered and co-added 8–12 m images was 03–035, and about 50% larger at 18.5 m, roughly consistent with the expected diffraction limit.
Figure 1 shows the resulting co-added Michelle images. The observations were performed in service mode and targeted the water maser source W49A/G, but the 30″20″ field-of-view included a few other sources in the brightest central and western parts of the ring of UCHII regions as well (Welch et al. 1987). The observing conditions were not optimal; while the image quality was good, the sky was non-photometric, and suitable standard star observations were not obtained. The mid-IR images presented here could therefore not be absolutely flux calibrated and our discussion must be limited mainly to the observed morphology. Our previous ground-based observations, however, have already measured the mid-IR fluxes of various sources in our field (Smith et al. 2000), and we incorporate these and other available photometric data in our models described in §4.4. In principle, the bandpasses of the 8.8 and 11.6 m filters allow for partial contribution of PAH (polycyclic aromatic hydrocarbon) features. However, a low-resolution 8–13 m spectrum of source G published by Gillet et al. (1975) shows only smooth continuum emission with deep 9.7 m silicate absorption, so we suspect that our images are not strongly influenced by extended PAH emission. They may, however, contain some extended silicate emission (see below).
| Obs. Date | (m) | (m) | Exp. Time (s) |
|---|---|---|---|
| 2004 Aug 11 | 11.6 | 1.1 | 6155 |
| 2004 Aug 11 | 18.5 | 1.6 | 282 |
| 2004 Sep 24 | 11.6 | 1.1 | 6155 |
| 2004 Sep 24 | 18.5 | 1.6 | 682 |
| 2004 Sep 30 | 8.8 | 0.9 | 3207 |
| 2004 Oct 5 | 8.8 | 0.9 | 6259 |
| 2004 Oct 5 | 9.7 | 1.0 | 6221 |
| 2004 Oct 5 | 11.6 | 1.1 | 152 |
2.2 Multiwavelength Registration
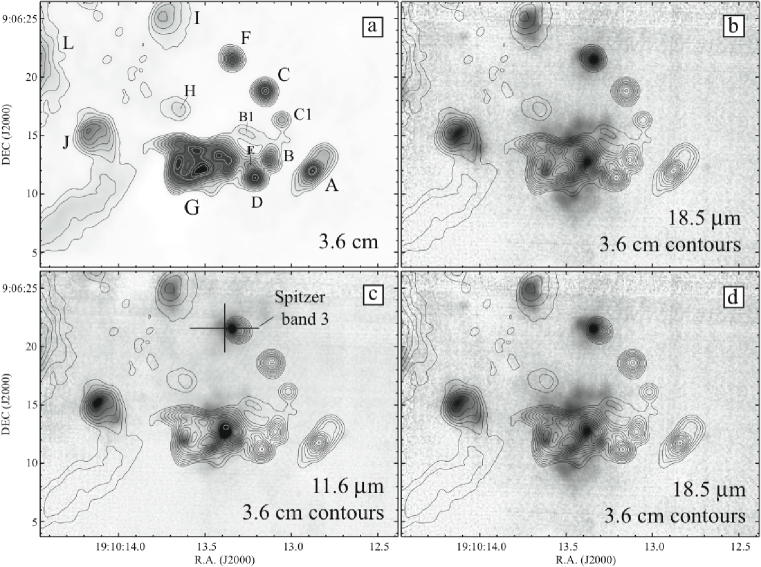
Aligning the mid-IR images to one another at the four wavelengths was relatively simple; registering to a common compact source such as source F provided satisfactory results (a color image showed no perceptable registration problems between IR wavelengths). However, we also wish to compare our new mid-IR images to high-resolution radio continuum data (Fig. 2). The absolute positional accuracy of our images (1″) is not sufficient to provide a meaningful comparison between the high-resolution IR and radio data, and registering to a common source may be problematic since we are dealing with thermal dust emission in the mid-IR and ionized gas in the radio. We show two alternative solutions to the relative IR/radio registration in Figure 2.
1. In Figure 2, the radio and IR data are aligned by matching the centroid position of source F, which appears point-like in the radio at this resolution. Source F is the only one detected in the field-of-view of our IR images whose photospheric emission is detected in the near-IR band (Conti & Blum 2002; Alves & Homeier 2003). Under this assumption, the precision to which we can align the images would be 001 (roughly 10% of a pixel) based on the centroiding precision of the point source, although we suspect that this assumption is incorrect because source F shows complex extended structure in the mid-IR.
2. The second registration option in Figure 2 and 2, which we favor, uses a cross correlation of sources I and J for registering the radio and IR images. The precision of the cross-correlation between the radio and IR data is 005 in both R.A. and DEC. The cross correlation was performed between the radio and both 11.6 and 18.5 m images for both sources I and J, and the cross correlation function was well-behaved (i.e. single-peaked Gaussian). At the angular scales sampled here we do not spatially resolve dust temperature gradients within the thin walls of cometary or shell-like UCHII regions such as I and J, so we expect the mid-IR morphology to roughly trace that in the radio continuum, since the dust emitting at 10–20 m is heated predominantly by trapped Ly photons (e.g., Hoare et al. 2007; Smith & Brooks 2007). Indeed, most of the mid-IR emission detected from UCHII regions in W49 shows very good spatial and morphological agreement with the radio continuum (Smith et al. 2000), as is the case for the cometary UCHII region G29.96-0.02 (De Buizer et al. 2002).
Which of these two is correct? These two options differ in alignment by about 06, mainly in the east-west direction, and bear upon the location of the IR peak of source G compared to the location of the water maser outflow’s origin, as discussed later. In option 1, the compact source F is nicely aligned, but the mis-alignment of the extended radio and IR sources I and J looks rather strange. Moreover, the IR centroids of I and J would, coincidentally, need to be offset from their radio conterparts by the same amount and in the same direction. Option 1 would locate the main IR source G:IRS1 overlapping with G1 (the western peak of source G), which seems problematic since the well-defined shell-like radio morphology of G1 (see below) does not correspond well with the centrally-peaked and possibly bipolar morphology of G:IRS1. Option 2 seems better, as long as it is reasonable to assume that source F in the radio does not exactly match the position of source F in the mid-IR. This may be true, because despite its point-like radio appearance and stellar detection in the near-IR, source F is not a pure point source in our new mid-IR Gemini images anyway. It shows some faint extended structure around a bright core.
As a final check, we compared the radio position of source F to the absolute position of the mid-IR source in data obtained with the Infrared Array Camera (IRAC) in the Spitzer Space Telescope during the GLIMPSE survey (Benjamin et al. 2003). The absolute coordinates in the GLIMPSE data are determined with reference to 2MASS, and are accurate to 03, so while the Spitzer images have lower angular resolution than our new Gemini data, they are sufficient top solve the registration ambiguity between options 1 and 2 above. In the IRAC band 3 (5.8 m) filter, the position of source F is = 19:10:13.39, = +9:06:21.56, whereas DePree et al. (2000) give the radio continuum position of source F as = 19:10:13.345, = +9:06:21.47. From this comparison, the mid-IR counterpart of source F is offset by 06 east and 009 north of the radio position. (IRAC bands 1 and 2 yield similar offsets, whereas the IRAC band 4 data are affected by severe over-exposure of source G and have artifacts across the image.) This offset is consistent with our option 2 registration discussed above, and allows us to rule out option 1. Interestingly, the near-IR -band point source and an X-ray source associated with F also appear to be slightly offset to the east of the radio continuum source by roughly 1″ (Tsujimoto et al. 2006), nearly coincident with the mid-IR source in option 2. Thus, we adopt option 2 below in the discussion of Source G.
3 RESULTS FOR SOURCES OTHER THAN G
3.1 The Missing IR Sources in the Ring and the Environment of Source G
Smith et al. (2000) presented the first mid-IR survey of warm dust emission from the UCHII regions in W49A. Nearly all of the known radio continuum sources thought to be UCHII regions were clearly detected in the mid-IR images, and when resolved, the radio and IR morphologies generally matched.
This general agreement between IR and radio emission accentuates the fact that the few radio sources that were not detected in the IR are all clustered together within 5″ of one another at the western end of the ring. These missing IR sources were W49A/A, B, C, D, and E, plus their associated subcomponents. In terms of extinction, there appeared to be a sharp vertical dividing line at (2000)=19h10m1325 (see Fig. 2), such that no sources in the ring were detected west of this line in the IR. Smith et al. (2000) estimated a lower limit of roughly cm-2 for the column density required to fully extinguish these sources at 20m. In fact, several observations in tracers of dense molcular gas (like NH3, SO2, C34S, etc.) found higher concentrations toward the western part of the ring (Jackson & Kraemer 1994; Serabyn et al. 1993, Dickel & Goss 1990), and Dickel & Goss (1990) estimated the line of sight molecular column density toward source A to be cm-2. This is more than sufficient to completely extinguish these sources in the mid-IR at the sensitivity limits of Smith et al. (2000).
Our new observations in Figure 1 confirm the non-detection of sources A–E, including additional wavelengths shorter than 12 m that were not observed in our previous paper. Although our new Gemini images at 10–20 m are not absolutely flux calibrated, we can use the photometry in Smith et al. (2000) to bootstrap from the observed counts for sources that are detected in our images (like sources F, I, and J). The diffuse background level in our new images is about the same as in Smith et al. (2000) at 12–20 m, but we are about two times more sensitive to compact unresolved sources because of the higher angular resolution of the Gemini images. Thus, the column density required to extinguish these sources is even higher than estimated in our previous paper, but is still plausible given the observed molecular column density. Of course, the local column density to any of the sources may in fact be higher than estimated from molecular observations if they are clumped on size scales smaller than the beam.
Sources A–E also tend to be among the most compact UCHII regions in W49. Sources G, I, and J in the middle of the ring are more extended, while Source L at the far eastern side of the ring is very diffuse. Combining this clue with the much higher molecular column density and the non-detection in the thermal-IR, Smith et al. (2000) proposed that these missing IR sources at the western end of the ring constitute the youngest and most embedded UCHII regions in W49, and that there seems to be a west-to-east age gradient in W49. Subsequently, Alves & Homeier (2003) reported the discovery of a massive young cluster of O-type stars just 3 pc east of the ring, supporting this overall picture of an east/west age gradient. Alves & Homeier note that this may not necessarily imply triggering of star formation in the ring by the existing O-star cluster, since there appear to be other seeds of star formation elsewhere in W49, such as W49 South and sources S, R, and Q (see Smith et al. 2000; De Pree et al. 1997). Moving from east to west, one sees the massive O-star cluster, followed by diffuse emission in a strong ionization front seen in near-IR mages (including Br) and deep radio continuum images, followed by the Welch ring. This line of reasoning suggests that the western end of the ring of UCHII regions is the densest, youngest, and most active part of the W49 cloud core.
Its location right at the boundary of a dense cloud core bears upon source G’s status as the most powerful water maser outflow source in the Milky Way. Its location hints that the observable onset of this outflow phase may be related to the density structure of the surrounding environment as well as the age of the protostellar outflow source itself. In this context, it is intriguing that the ionized region and outflow around source G is more extended to the east than to the west, as discussed further below.
3.2 Sources F, I, and J
In our previous ground-based IR imaging of W49 with a 3 m telescope, source F was unresolved, whereas I and J were possibly extended with unclear morphology (Smith et al. 2000). Each is powered by the equivalent ionizing flux of an O6.5–O7.5 V star (De Pree et al. 1997). With the better diffraction limit in our new Gemini mid-IR images (Fig. 1), all three show clear evidence for extended structure. Sources I and J show no compact IR source, appearing instead as cometary or shell-like UCHII regions. Their thermal-IR morphologies are well-matched by the diffuse structure seen in the radio continuum (see Figs. 2 and 2).
Source F is more complicated. It appears slightly resolved at 8.8 m, with a FWHM of 05. This is more extended than the angular resolution of the image (source G has a FWHM of roughly 03 in the same 8.8 m frame). Moving to longer wavelengths, Source F develops an unresolved point-like core with an extended halo. This halo is asymmetric, being more extended toward the east, and the asymmetry is most pronounced at 18.5 m in Figure 1. Source F is very compact in the radio continuum (it is the most compact 3.6 cm source in the ring observed by De Pree et al. 1997); it appears as a point source in the 3.6 cm image in Figure 2. In our favored alignment of the IR and radio images (Figs. 2 and 2), the IR source is offset from the peak of the 3.6 cm continuum emission by 06 at P.A.=743°. This is the same direction toward which the diffuse halo of F is most extended at 18.5 m. This slight offset is unusual but not unprecedented; several compact regions studied by De Buizer et al. (2005) show similar small offsets between compact thermal-IR sources and the centimeter-wavelength radio continuum. The difference between IR and radio positions of source F is of interest because it is the only source we have detected in the ring for which stellar photospheric emission has been detected in the near-IR (Conti & Blum 2002; Alves & Homeier 2003). Blum (2005) presented a near-IR spectrum of source F, showing strong Pa and Br emission and a very red continuum.
The mid-IR/radio offset we observe here and the extension of diffuse IR emission toward the east implies very high local extinction. Light escaping eastward out of the source fits the overal trend of higher extinction as one moves westward within the ring of UCHII regions. Consequently, the near-IR source associated with F may not be the same star that ionizes the gas detected in the radio continuum. Indeed, the position of the near-IR source is also offset to the east of the radio continuum source. Interestingly, a hard X-ray source was recently detected in the vicinity of source F (Tsujimoto et al. 2006). It is located even further west than the radio source, adding to our suspicion that F may harbor multiple protostellar sources or complex substructure.
The UCHII regions K, L, and M are outside our field of view. We did not detect source H because its surface brightness is too low in the thermal-IR (Smith et al. 2000).
4 DETAILED MORPHOLOGY OF THE OUTFLOW SOURCE G
4.1 Apparent Structure in IR Images
Source G shows intriguing extended structure in Figure 1. Previous mid-IR observations indicated that it was extended out to a radius of 5″, but had insufficient resolution to uncover its small-scale structure (Smith et al. 2000).
The bright central peak, which we denote source G:IRS1, appears to be at the center of an X-shaped distribution of extended IR emission reaching out to 2″ from the central peak in our 9.7, 11.6, and 18.5 m images (the extended emission was not detected at 8.8 m because of lower sensitivity). The central peak itself has a slight cometary shape on a scale of 05, opening toward the east and connecting to part of the larger X shape. This morphology is characteristic of a flared disk geometry that is viewed from an intermediate angle, and is seen in the central sources in the dust emission models we present later in §4.4. Beyond the central peak and X-shaped nebula, source G shows complex, multiple-peaked structure in a “halo” that extends out to 5″ from the center, and seems to have a larger extent at 9.7 and 18.5 m than it does at 11.6 m. In particular, there is a second resolved source 35 east of G:IRS1, nearly coincident with the radio continuum source G5 (see Fig. 1). It appears to be a point source at 8.8–18.5 m, although in the radio continuum G5 seems to be part of a limb brightened cavity wall. This IR source may represent a second IR protostar forming near G:IRS1, or it may simply be a condensation in the cavity wall.
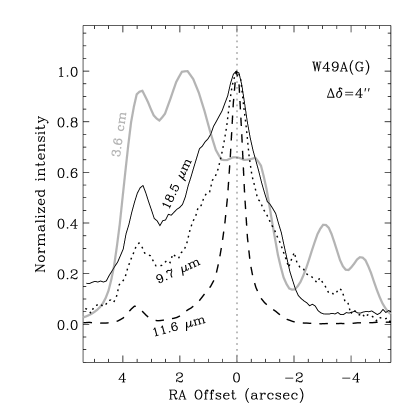
Following the systematic trend of higher densities toward the west in the ring of W49, the IR halo of source G is more extended toward the east and ends more abruptly on its west side (Fig. 3). The fact that the radio continuum follows this trend as well (Fig. 3) means that it is not a mere extinction gradient along our line of sight, but rather, a true physical density gradient in the surroundings, making it easier for photons to escape toward the east, or for outflows to carve cavities in that direction.
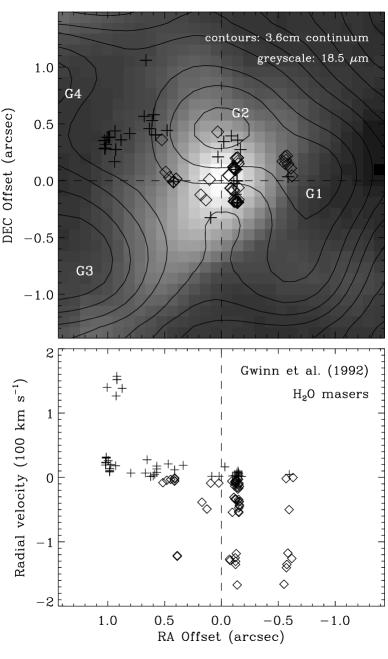

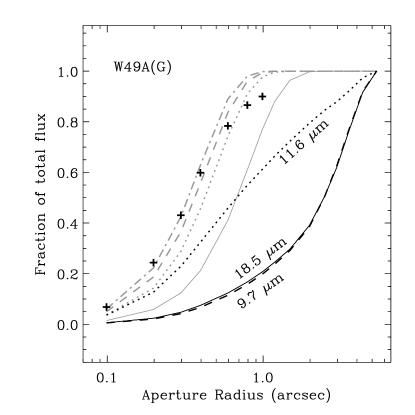
Figure 4 confirms the general impression from raw images that the 9.7 and 18.5 m images are more spatially extended than the 11.6 m emission. The encircled flux profiles of the 9.7 and 18.5 m filters are nearly identical, while the 11.6 m profile has a different shape. The 9.7 and 18.5 m filters sample silicate emission or absorption features, while the 11.6 m filter is dominated by warm dust continuum emission in W49 (Gillet et al. 1975). Thus, the similar radial profiles of the 9.7 and 18.5 m filters in Figure 4 suggest that both filters sample extended silicate emission, and may also be affected by heavier silicate absorption of the continuum toward the central source. The silicate emission extends over a region more than 0.5 pc across, while the continuum source at 11.6 m is more centrally concentrated. This may suggest UV excitation of the silicate emission by multiple stellar sources in the vicinity of source G. Spatially-resolved mid-IR spectroscopy of this extended emission would be worthwhile to confirm this conjecture.
4.2 Identification of the H2O Maser Outflow Source and the Hot Molecular Core
Figure 5 shows the environment immediately surrounding source G:IRS1. This figure includes 3.6 cm radio continuum contours using the same alignment as in Figures 2 and 2, for which the registration accuracy is roughly 005, as noted earlier. The registration of the water masers compared to the radio continuum was adopted from the study of De Pree et al. (2000), with a quoted accuracy of 005. Therefore, the accuracy of the registration between the IR image and the water masers is roughly 007 with the positional uncertainties added in quadrature. Radial velocities and E/W positional offsets of the water masers from Gwinn et al. (1992) are plotted in Figure 5 as well (bottom panel). The reference position from which offsets in R.A. and DEC are measured here corresponds to the center of the maser outflow in the favored best-fit model of Gwinn et al. (1992); specifically, it is the presumed origin point for their “solution 4” listed in their Table 5.
It is clear that the expected launching source of the water maser outflow is coincident with G:IRS1 to within the positional error of our study, whereas G:IRS1 and the water maser source are both significantly offset from the nearest 3.6 cm radio continuum peak G2 at this resolution. G:IRS1 is located about 04 due south of the 3.6 cm centroid of G2 (Figure 5).222If instead we had adopted our alternative choice for the registration of IR and radio images using source F for the registration (see Fig. 2), source G:IRS1 would be located approximately coincident with radio continuum source G1. This seems unlikely because the clear shell-like radio morphology of source G1 (see Fig. 6 and De Pree et al. 2000) has no correspondence with the observed IR morphology. We found no suitable image registration that would align G:IRS1 with radio source G2.
Figure 6 is the same as Figure 5, except that it compares the 18.5 m Gemini image (dashed contours) to a higher resolution 7 mm radio continuum image from De Pree et al. (2000). Again we see that the IR peak is offset 035–04 south from the strongest emission associated with G2a/b. Source G1 appears to be a relatively isolated, unrelated shell-like UCHII region associated with no mid-IR source.
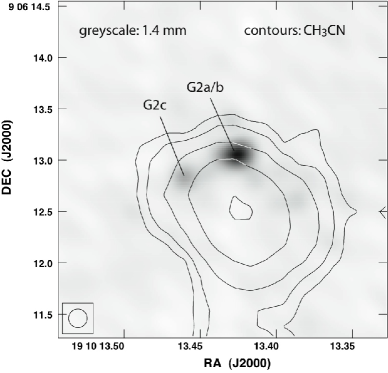

If our spatial alignment is correct, then another interesting coincidence is that the location of G:IRS1 matches the position of a hot molecular core seen in CH3CN emission (Wilner et al. 2001; their source“b” located 01 to 1″ south of G2). Figure 7 shows the emission from this hot core (contours of CH3CN emission) compared to the the 1.4 mm continuum from sources G2a/b and G2c in the data presented by Wilner et al. (2001). These line and continuum measurements are from the same dataset, so there is no registration error in the relative positions. Figure 7 shows that the molecular hot core source is clearly offset south of G2a/b, making it coincident in location and size with our new IR source G:IRS1. By analogy with the hot core and H2O maser outflow in Orion, this strengthens the case that G:IRS1 (and not G2a/b) is in fact the source of the water maser outflow in W49. Combined with the lack of a compact radio continuum source and the presence of infall indicated by inverse P Cygni profiles in CS (Williams et al. 2004), G:IRS1 appears to be an excellent candidate for an accreting massive protostar in a hot molecular core accompanied by a bipolar outflow. This differs from the case of the cometary UCHII region G29.96–0.02, for example, where the mid-IR source is offset from the hot molecular core and coincident with the radio continuum instead (De Buizer et al. 2002).
The water masers are spread across a 2″ range on either side of G:IRS1, and are elongated in a primarily east/west orientation following the presumed direction of the maser outflow (Gwinn et al. 1992). The tightest cluster of maser spots is found just a bit more than 01 west of G:IRS1. This maser cluster has a clearly linear arrangement, and is elongated along a north/south axis perpendicular to the larger outflow. Essentially all the masers in this cluster are blueshifted (there is one very low velocity redshifted spot), and the feature is persistent over decades (Walker et al. 1982; Gwinn et al. 1992; De Pree et al. 2000). If the water masers form at the edge of the cavity walls, as suggested by Mac Low & Elitzur (1992) and Mac Low et al. (1994), then this linear arrangement of predominantly blueshifted masers might represent a position where our line of sight skims a tangent point in the wall of the blueshifted outflow cavity or flared edges of a disk (see Figures 8 and 9, and discussion below). Such linear arrangements are not unusual. In several cases where water masers are closely associated with UCHII regions detected in the mid-IR, the masers show a quasi-linear distribution on the sky (De Buizer et al. 2005). De Buizer et al. (2005) conclude that in most cases the linear distribution traces the outflows and not the disks.
Although G:IRS1 and G2a/b are not coincident and are not powered by the same central (proto)star, they may have a “symbiotic” relationship. Sources G2a and b are closely connected, being bridged by faint emission, and may be part of the same bipolar structure. The pinched waist that divides them is projected along the same north/south line that passes through G:IRS1 and is perpendicular to the large-scale outflow axis. Given the apparent bipolar morphology of source G2a/b, which is oriented along the same outflow axis, it is concievable that both sources are aligned and that they may have formed from the same flattended rotating cloud core that fragmented as it collapsed, as depicted in Figure 8. Kratter & Matzner (2006) argue that massive protostellar disks with the accretion rate we infer for G:IRS1 (see below) will be unstable to fragmentation, although on smaller size scales of 150 AU, while numerical simulations by Krumholz et al. (2009) show multiple stars forming from a common rotating disk/envelope with characteristic separations of 1000 AU.
In any case, if they share a real physical proximity, the source that ionizes G2a/b may also help to ionize source G and its outflow on a larger scale; G2a/b requires an ionizing flux that is the equivalent of an O5.5 V star (De Pree et al. 2000). With such a luminous star, it is puzzling that we detect no mid-IR emission from G2a/b; additional extinction along the line of sight or cooler dust temperatures located farther from the star may play a role in this mystery. This picture is of course still very speculative, but it is compelling enough to suggest that the close relationship between G:IRS1 and G2a/b deserves continued study as it may provide direct insight to the formation of massive binary systems. In this context, Source G in W49 may therefore be an excellent target to observe with ALMA.
| Model | comment | |||||
|---|---|---|---|---|---|---|
| () | (105 ) | (10 yr-1) | (deg) | (deg) | ||
| A | 25–35 | 1–2 | 1–10 | 85 | 11-18 | fits silicate abs., not SED or image |
| B | 25–35 | 2–3 | 5 | 30–90 | 2–3 | fits SED, not silicate abs. or image |
| C | 45 | 3 | 10 | 60 | 30 | fits silicate abs., SED, and image |
Note: is the inclination angle at which we view the system, and is the outflow opening angle.
4.3 The Outflow Geometry of Source G: A Bipolar Cavity
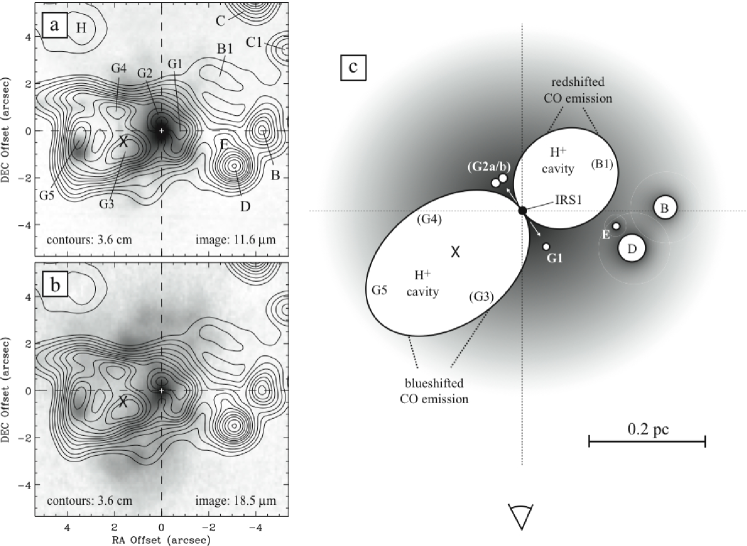
Figures 9 and 9 compare the 3.6 cm radio continuum morphology to that seen in our 11.6 and 18.5 m Gemini images. Clearly, the large-scale radio continuum is more elongated east/west, while the diffuse IR emission at 18.5 m seems to be elongated in the opposite direction. The wings of the X-shaped IR nebulosity that emerge to the NE and SE from G:IRS1 seem to outline the brightest diffuse radio continuum emission in the eastern part of G (sources G3 and G4). It seems likely that the mid-IR emission comes from warm dust at the limb-brightened boundary of an ionized cavity; our model images discussed in the next section show that this interpretation is plausible.
The large cavity is likely to be a stellar wind-blown bubble (e.g., Weaver et al. 1977), since it is partly filled with X-ray emission. The approximate center of the extended X-ray sources detected by Tsujimoto et al. (2006), which has a similar extent to the radio emission, is marked by the “X” in Figures 9 and 9. In that case, the hard X-rays are likely to be the hot stellar wind or jet decelerated in the reverse shock (see Fig. 8, for example). A similar geometry may apply to the western lobe of source G, where source B1 and other low-level diffuse radio emission may define a similar – but smaller – ionized cavity on the opposite side, which is bounded close to the source by the fainter IR extensions to the SW and NW from G:IRS1. The western side of the putative bipolar outflow is more complicated, because there are other UCHII regions (sources B, D, and E) projected along the same line of sight to the redshifted lobe, and because the diffuse radio emission from the redshifted lobe is fainter. We are therefore less confident about the receding lobe’s geometry, although its smaller size makes intuitive physical sense if its environment is denser.
A basic geometric model is sketched in Figure 9. Tilting the eastern (left in Fig. 9) cavity toward the observer is favored by several observational properties: 1) the eastern lobe is brighter, 2) the UCHII regions to the west are all obscured in the mid-IR (Smith et al. 2000), 3) the morphology of G:IRS1 is consistent with the eastern polar axis being tilted toward us, and 4) this is the orientation of the 25 km s-1 CO outflow observed on similar size scales by Scoville et al. (1986), where the blueshifted CO emission is toward the east and the redshifted CO emission is offset to the west. The CO outflow probably traces a dense sheath or cocoon surrounding the ionized cavity.
This orientation for the CO outflow and ionized cavities is orthogonal to the water maser outflow (the small white arrows in Fig. 9). One solution to this discrepancy, as noted above, may be that the water masers trace dense material in an equatorial torus or envelope, or may originate at the interface between the cavity and disk envelope close to the source (Mac Low et al. 1994). A similar orientation is seen in the OMC-1 core (e.g., Plambeck et al. 1982; Greenhill et al. 1998), and also for S140 IRS1 (Hoare 2006).
From Figure 9 it is easy to picture how the linear water maser feature located 01 west of G:IRS1 could arise near the tangent point of the blueshifted outflow cavity. The overall outflow geometry for source G that is pictured in Figure 9 is nearly identical to that envisioned earlier by Dickel & Goss (1990), although their picture was based primarily on the different column densities observed toward various lines of sight. In fact, Dickel & Goss argued that because of an abrupt change in column density, the edge of the blueshifted part of the outflow must reside between sources G and D, as we have pictured here and have associated with the linear water maser feature.
IRS1 is not concident with the ionized UCHII regions G2a, G2b, or G1 (Fig. 8), showing that there are several centers of massive star formation activity even on size scales of 0.1 pc. Thus, in priciple, we do not necessarily need the water maser outflow to be aligned with the larger cavity because it could simply be due to a different outflow with a different axis orientation. For example, in OMC-1, the large-scale molecular outflow and cavity traced by mid-IR emission and the shocked H2 emission from the system of “fingers” defines one axis that runs SE to NW (Allen & Burton 1993; Kaifu et al. 2000; Kwan & Scoville 1976; Gezari et al. 1998; Shuping et al. 2003; Smith et al. 2005), while source IRc2 seems to drive a smaller collimated outflow nearly perpendicular to the large scale flow (Greenhill et al. 1998, 2003; Bally et al. 2005). The OMC-1 South core has several jets and molecular outflows in various directions that all originate in a 0.01 pc region with multiple mid-IR sources (Smith et al. 2004; Zapata et al. 2004).
4.4 Radiative Transfer Modeling
In order to verify that the morphology and orientation of the bipolar cavity are generally correct as sketched in Figure 9, and to constrain physical properties of the illuminating source, we conducted simulations of the dust emission to compare with the observed mid-IR spectral energy distribution (SED) and with the morphology observed in our new mid-IR images. As a starting point, we fit the SED of W49/G using the Robitaille et al. (2006, 2007) grid of young stellar object (YSO) models and the online SED fitter. To construct the mid-IR SEDs shown in Figure 10, we used the 8–13 m spectrum from Gillet et al. (1975), combined with ground-based photometry of source G from Smith et al. (2000) at 12.3, 12.8, and 20.6 m, and photometry obtained at 3.6, 4.5, and 5.8 m with the Infrared Array Camera (IRAC) on the Spitzer Space Telescope as part of the GLIMPSE survey (Benjamin et al. 2003). (These additional data were necessary, as our Gemini data did not have reliable photometric calibration stars, as noted earlier.) The ground-based spectral data at 10 m had a large beam (22″) compared to the photometric data (2″ at 3.6, 4.5, 5.8 and 4″ at 12.3, 12.8, 20.6), so we scaled the flux in the spectrum to match the imaging photometry. It is therefore possible that the silicate absorption feature at 10 m is partially filled-in by silicate emission from the surrounding heated nebula. Our Gemini images at 9.7 and 18.5 m in Figure 1 do show a halo that is more extended than at 11.6 m (see also Figs. 3 and 4), so extended silicate emission may contaminate the larger beam used by Gillet et al. (1975).

With this possible contamination in mind, we fit the SED both with and without the 10 m spectral data. Three representative models are discussed below and summarized in Table 2. The SEDs fit to both the broad-band data points and 10 m spectral data (model A in Fig. 10) correspond to models that consist of a central source with mass 25–35 , and luminosity 1–2105 , a massive accreting envelope with an equivalent accretion rate 10-4–10-3 yr-1, and disk mass 0–0.1 (the mid-IR emission is dominated by envelope emission, so the SED fits are insensitive to inner disk mass). Note that the accretion rate is a model parameter prescribing the envelope density and mass, and is not a direct measure of the true accretion rate. These well-fit SED models (defined as having , where is the value of the best fit) have viewing angles of 85°, and bipolar cavity opening angles of 11-18°. Fits that allow the silicate absorption feature to be deeper than indicated by the Gillet et al. (1975) spectral data (Model B in Fig. 10), on the other hand, give similar stellar properties (a central stellar source of mass 25–35 , and luminosity 2–3105 ), an envelope accretion rate 510-4 yr-1, no disk, viewing angles of 30–90 degrees, and very narrow bipolar cavities (2–3°). This second group of model SEDs has deeper silicate absorption than the Gillet et al. (1975) spectrum, consistent with the extended silicate emission mentioned above. However, the very narrow opening angle is in conflict with the observed mid-IR morphology.
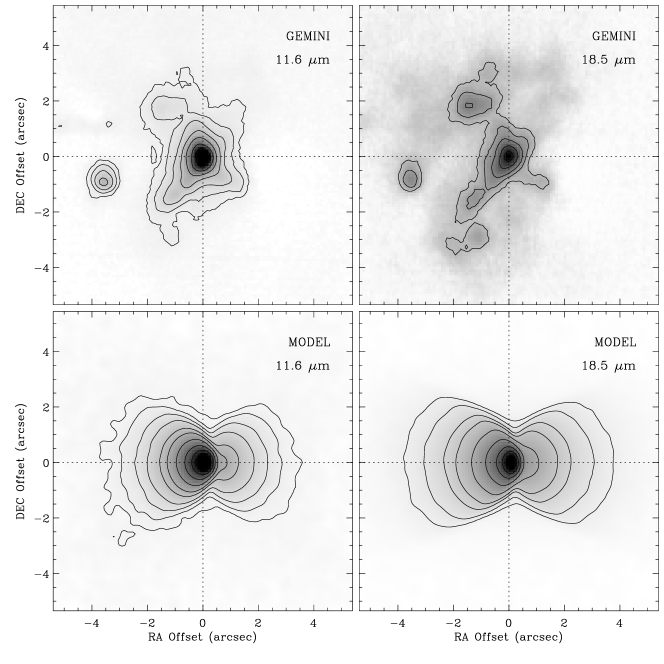
Our high-resolution mid-IR images in Figure 1 indicate a relatively large bipolar cavity opening angle (30°), and the radio continuum, CO, and water maser data argue for a viewing angle tilted from edge-on (§4.3). Therefore, we modified the model parameters accordingly in order to fit both the SEDs and structures in Gemini images (Fig. 1) with a viewing angle of 60°. The significantly different result with model C highlights the value of simultaneously fitting both the SED and the spatially resolved morphology. The resulting model IR spectrum is shown as Model C (black in Fig. 10), and the model images at 11.6 and 18.5 m are compared to the observed Gemini data in Figure 11. The qualitative agreement is quite good, especially in the cometary-shaped core. Note that this model did not account for the density gradient in the background cloud that was discussed in §4.1 and §4.3, so the environment-dependent asymmetry in the large bipolar cavity (see Figure 9) is not addressed by these models.
Model C required a more massive star with a stellar mass of 45 , luminosity 3105 , an equivalent envelope accretion rate 10-3 yr-1, and a large inner hole of 1700 AU (015; still unresolved in our images), which is larger than the expected dust sublimation radius. The more massive star in model C has a hotter effective temperature and this fits the steeply rising 1–10 m spectrum better (see Whitney et al. 2004), as does the large inner hole. Also, the hotter and more massive star is in better agreement with the star that is needed to provide the ionizing photon flux of Source G: De Pree et al. (1997) estimated a source with and equivalent luminosity and ionizing flux of an O4 V type star to account for the observed radio continuum emission. However, models of the infalling envelope include a parameter, , which is the centrifugal radius inside of which a disk would form. The SED is well fit with 500–1000 AU, consistent with possible disk formation. The proper interpretation of the inner disk hole suggested by the model fits, within a radius of 1700 AU, is unclear because of the uncertainty in fitting a steep SED at short wavelengths in a source with high extinction. We regard this inner hole as tentative and in need of confirmation, but we discuss it as a possibility in the following section.
5 DISCUSSION
The high angular resolution of our new mid-IR images obtained with Michelle on Gemini South reveal the extended IR morphology of source G, and show that the concentrated peak of source G:IRS1 is coincident with a hot molecular core and the origin point of the powerful H2O maser in W49. This allows us to bring together several observational clues that shed light on the nature of the driving source of the outflow. The key observational parameters to consider are:
1. The peak of the mid-IR 8-20 m emission is coincident with the origin point of the H2O maser outflow to within the registration uncertainty of our data. Our positional uncertainty of 007 is smaller than the size scale of the maser outflow and allows for meaningful comparison with high-resolution radio continuum data. Although this association with the water maser was suspected when the IR source was first discovered by Becklin et al. (1973), their measurements were made using a single element detector with a 7″ diameter aperture, leaving much room for ambiguity given the complex structure of source G. Our images show that several other faint sources would have contaminated that aperture as well. Dreher et al. (1984) compared the IR and radio continuum maps and located the IR source about 2″ (20,000 AU) north of the position we adopt here, which is clearly in conflict with our new data and would have precluded it from having any role in the outflow.
2. The peak of the mid-IR 8-20 m emission is not coincident with any strong compact radio continuum source. Although IRS1 is surrounded by more diffuse radio continuum emission from source G on large scales (several times larger than the whole maser outflow), the closest peak of compact radio continuum emission that signifies an UCHII region is source G2a/b, which is offset more than 035 or 4,000 AU to the north. This is beyond our estimated positional uncertainty. Our finding that the compact source G:IRS1 is coincident with the origin of the water masers and not radio source G2a/b supports the emerging view (De Buizer et al. 2005; Tofani et al. 1995) that maser sources tend to be associated with mid-IR emission rather than radio continuum emission from UCHII regions.
3. The peak of the mid-IR 8-20 m emission is coincident with a hot molecular core revealed by tracers such as CH3CN, seen in the high resolution mm-wavelength maps made by Wilner et al. (2001).
4. This hot core in source G also shows signs of accretion through inverse P Cygni absorption profiles in CS (Williams et al. 2004). This accretion signature in the hot core is consistent with the high effective envelope accretion rate in our model fits to the IR SED (about 10-3 yr-1).
5. The morphology of source G:IRS1 suggests strongly that it is associated with not only the maser outflow, but a much larger bipolar outflow and cavity traced by CO emission (Scoville et al. 1986), radio continuum, and X-ray emission. While the inner source itself shows no compact radio continum emission, diffuse radio continuum emission is present on large scales from the bipolar cavity, implying that some Lyman continuum radiation escapes out the poles. The large scale CO outflow and the H2O maser outflow appear to be orthogonal. Diffuse X-ray emission partly fills the interior cavity of the eastern lobe (Tsujimoto et al. 2006), perhaps marking a reverse shock in the polar outflow.
This combination of observed properties — a strong mid-IR source associated with a hot molecular core and maser emission, but not strong radio continuum — is quite similar to the hot core in Orion that powers the extended BN/KL bipolar molecular outflow. Even the apparent geometry is similar, with the water maser outflow oriented orthogonal to the larger wide-angle bipolar molecular outflow in both cases. Thus, in many ways, source G in W49 appears to be a more luminous analog of the OMC-1 outflow, and may provide critical insight to the formation of very massive stars. However, there is also an important difference between these outflows: Unlike Orion, at least one of W49A/G’s outflow cavities is filled with ionized gas seen in the radio continuum (see Fig. 9), and appears to have diffuse X-ray emission. These ionized cavities span a region roughly 8″ or almost 0.5 pc across, larger than the BN/KL outflow. The ionizing flux to sustain source G that was deduced by De Pree et al. (1997) requires the equivalent of at least six O6-type stars or a single O4 star. Thus, perhaps Source G is simply in a somewhat more evolved wind-blown cavity stage than BN/KL, more akin to the bipolar H ii region S106 (Bally et al. 1998; Smith et al. 2001). Interestingly, in the case of S 106, the smaller of the two bipolar lobes is also more deeply embedded in the parent cloud.
Normally, these observations of G:IRS1 as a traditional hot molecular core that is still in a stage of active envelope accretion would seem to be at odds with its much larger cavity filled with radio continuum emission and X-ray emission, because one does not expect a hot core to produce significant ionizing flux. The high envelope accretion rate of 10-3 yr-1 that we infer from models of the IR emission would be sufficient to quench the ionizing flux if the source were spherical. One might naturally ask what ionizes the gas in the large outflow cavity? We note two possible interpretations that have different implications.
Given its bipolar geometry, G:IRS1 itself may be the source of ionization for the outflow despite its high envelope accretion rate. As noted earlier, the equivalent ionizing flux of an O4 star needed to account for the radio continuum emission is in good agreement with the massive (45 ) and luminous (3105 ) star that we infer from models of the IR emission. Even though it is a strong mid-IR source inside a hot molecular core, the embedded massive star may have become hot enough to generate a large UV luminosity that may be able to escape through lower density regions in the polar directions. Our model fits to the SED favor a relatively hot star. The required Lyman continuum flux passing through a small polar “nozzle” would exceed the dust Eddington limit (radiation force on dust grains), but that is part of the basic notion behind using geometry to allow massive stars to form (e.g., Tan & McKee 2004).
It is unlikely that stellar radiation alone could have been the agent responsible for driving the powerful outflow observed in Source G. From observations of the CO outflow, Scoville et al. (1986) derive an outflow mass of 138 and a momentum of 3500 km s-1. Located within 4″ of the central star, the outflow dynamical timescale for an average 25 km s-1 outflow speed is roughly 104 yr. The momentum supplied by the stellar radiation field, , during this time falls short by a factor of 50 if the stellar luminosity has been constant at the value of 3105 that we infer from radiative transfer models. Similarly, the mass-loss rate required for the mechanical energy of a stellar wind to power the outflow over the same time period, assuming a typical O-star wind speed of 1500 km s-1, would need to be roughly 210-4 yr-1. This is 100 times higher than typical main-sequence O star mass-loss rates in the relevant luminosity range (see Repolust et al. 2004; Smith 2006). However, such a high mass-loss rate is still only 20% of the effective envelope accretion rate that we infer from models. Therefore, the likely conclusion is that the large-scale CO outflow in W49A/G was in fact driven by accretion, at least until very recently, and that the central star in Source G is therefore an example of a massive star of 45 that is forming by accretion from a disk. Our models imply that the inner disk has been cleared out to radii of 1000–2000 AU, but this depends on the short-wavelength tail of the IR SED that is also severly affected by extinction, so we regard this result with some caution. If true, this must have occured recently compared to the 104 yr age of the large CO outflow. The H2O maser outflow, on the other hand, is distributed over a smaller 1″ (0.06 pc) region with speeds up to 100 km s-1, implying a dynamical age of only 500 yr.
This interpretation of W49/G directly supports the picture of single massive star formation by accretion advocated by Yorke & Sonnhalter (2002), Krumholz et al. (2005), and others. Indeed, nearly all the physical parameters we infer for the central star and outflow of source G:IRS1 (the stellar mass and luminosity, the bipolar cavity opening angle, the envelope accretion rate, etc.) are closely matched in the numerical simulation studied by Krumholz et al. (2005). Source G:IRS1 may be an excellent observational test case for developing models of massive star formation that include the disruptive effects of radiative feedback and stellar winds (e.g., Krumholz et al. 2005, 2009). In this context, future observations of this source with facilities such as ALMA may be of great interest in order to confirm the tentative inner disk hole that we infer.
On the other hand, G:IRS1 is in a crowded and observationally complex environment, leaving room for other possibilities. A second conceivable interpretation is that the outflow cavity from source G is actually ionized by neighboring O stars that already formed within the same cloud core. The best candidate for this type of symbiotic relationship is the nearby source G2a/b, located just a few thousand AU to the north in projection (see Fig. 8). G2a/b appears to be a small bipolar UCHII region where the putative polar axis is aligned with that of G:IRS1 and its large-scale outflow. This alignment makes it seem plausible that UV radiation generated by the O star in G2a/b could escape out the poles to ionize the environment of source G seen in diffuse radio continuum emission. This interpretation highlights the degree to which dense clustered environments are important in massive star formation where feedback from neighboring massive stars may join forces in disrupting their common natal environment.
In any case, G:IRS1 may trace a brief but critical phase in massive star formation, akin to that of the BN/KL outflow in Orion. Returning to the UCHII region lifetime problem mentioned earlier, we note that among the 40–50 UCHII regions in W49A, G:IRS1 is the only water maser outflow source and large-scale bipolar outflow. (Source A, undetected in the IR, appears to be a fledgeling bipolar cavity and circumstellar torus or disk; De Pree et al. 1997, 2004.) If the UCHII region lifetime really is of order 105 yr, then it is likely that the maser outflow phase exemplified by Source G is transient, lasting no longer than a few thousand years. This is comparable to the dynamical timescale of the observed outflow in Source G with a characteristic size scale of a few arcseconds and the fastest expansion speeds of 100 km s-1 in the H2O maser outflow. Similarly, 500–1000 yr is the dynamical timescale of the related outflow in the OMC-1 core (e.g., O’Dell et al. 2008).
This returns our attention to the significance of the possible inner disk hole existing simultaneously with the bipolar outflow. Namely, the short timescale involved suggests that this inner disk is being cleared away at the same time that the H2O maser outflow is driven. Although direct radiative or stellar wind feedback from the central star has too little momentum to have powered the large scale CO outflow over the past 104 yr, it may drive the much younger maser outflow. However, we caution that we only infer the inner disk hole from the absence of short-wavelength IR emission, so it would be interesting if future high-resolution techniques could directly resolve this putative inner disk hole, to catch G:IRS1 in the act of destroying its own accretion disk and thereby fixing the central star’s final mass.
ACKNOWLEDGMENTS
We thank C. McKee and an anonymous referee for a helpful comments. N.S. was partially supported by NASA through Spitzer grants 1264318 and 30348 administered by JPL. P.S.C. appreciates continued support from the NSF. This study has made use of data obtained with Spitzer/IRAC as part of the GLIMPSE Legacy survey.
References
- [] Allen, D.A., & Burton, M.G. 1993, Nature, 363, 54
- [] Alves, J., & Homeier, N. 2003, ApJ, 589, L45
- [] Bally, J., & Zinnecker, H. 2005, AJ, 129, 2281
- [] Bally, J., Cunningham, N., Moeckel, N., & Smith, N. 2005, IAUS 227, 12
- [] Bally, J., Yu, K.C., Rayner, J., & Zinnecker, H. 1998, AJ, 116, 1868
- [] Becklin, E.E., Neugebauer, G., & Wynn-Williams, C.G. 1973, Ap. Letters, 13, 147
- [] Benjamin, R.A., et al. 2003, PASP, 115, 953
- [] Blum, R.D. 2005, IAUS 227, 216
- [] Bonnel, I., & Bate, M.R. 2002, MNRAS, 336, 659
- [] Bonnel, I., Bate, M.R., & Zinnecker, H. 1998, MNRAS, 298, 93
- [] Bourke, T., Hyland, A.R., & Robinson, G. 2005, ApJ, 625, 883
- [] Churchwell, E. 2002, ARAA, 40, 27
- [] Conti, P.S., & Blum, R.D. 2002, ApJ, 564, 827
- [] De Buizer, J.M., Watson, A.M., Radomski, J.T., Piña, R.K., & Telesco, C.M. 2002, ApJ, 564, L101
- [] De Buizer, J.M., Radomski, J.T., Telesco, C.M., & Piña, R.K. 2005, ApJS, 156, 179
- [] De Pree, C.G., Mehringer, D.M., & Goss, W.M. 1997, ApJ, 482, 307
- [] De Pree, C.G., Wilner, D.J., Goss, W.M., Welch, W.J., & McGrath, E. 2000, ApJ, 540, 308
- [] De Pree, C.G., et al. 2004, ApJ, 600, 286
- [] De Pree, C.G., et al. 2005, ApJ, 624, L101
- [] Dickel, H.R., & Goss, W.M. 1990, ApJ, 351, 189
- [] Dreher, J.W., Johnston, K.J., Welch, W.J., & Walker, R.C. 1984, ApJ, 283, 632
- [] Figer, D.F. 2005, Nature, 434, 192
- [] Garay, G. 2005, IAUS 227, 86
- [] Gezari, D.Y., Beckman, D.E., & Werner, MW. 1998, ApJ, 509, 283
- [] Gillet, F.C., Forrest, W.J., Merrill, K.M., Capps, R.W., & Soifer, B.T. 1975, ApJ, 200, 609
- [] Greenhill, L., Gwinn, C.R., Schwartz, C., Moran, J., & Diamond, P. 1998, Nature, 396, 650
- [] Greenhill, L., et al. 2004, IAUS 221, 203
- [] Gwinn, C.R., Moran, J.M., & Reid, M.J. 1992, ApJ, 393, 149
- [] Hoare, M.G. 2006, ApJ, 649, 856
- [] Hoare, M.G., Kurtz, S.E., Lizano, S., Keto, E., & Hofner, P. 2007, Protostars & Planets V, 181
- [] Jackson, J.M., & Kraemer, K.E. 1994, ApJ, 429, L37
- [] Jijina, J., & Adams, F.C. 1996, 462, 874
- [] Kahn, F.D. 1974, A&A, 37, 149
- [] Kaifu, N., et al. 2000, PASJ, 52, 1
- [] Keohane, J.W., Reach, W.T., Rho, J., & Jarrett, T.H. 2007, ApJ, 654, 938
- [] Keto, E. 2003, ApJ, 599, 1196
- [] Kratter, K.M., & Matzner, C.D. 2006, MNRAS, 375, 1563
- [] Kroupa, P. 2005, Nature, 434, 148
- [] Krumholz, M.R., Klein, R.I., McKee, C.F., Offner, S.S.R., & Cunnigham, A.J. 2009, Science, 323, 754
- [] Krumholz, M.R., McKee, C.F., & Klein, R.I. 2005, ApJ, 618, L33
- [] Kurtz, S., Cesaroni, R., Churchwell, E., Hofner, P., & Walmsley, C.M. 2000, Protostars and Planets IV, 299
- [] Kwan, J., & Scoville, N.Z. 1976, ApJ, 210, L39
- [] Larson, R.B. 1969, MNRAS, 145, 271
- [] Mac Low, M.M., & Elitzur, M. 1992, ApJ, 393, 33
- [] Mac Low, M.M., Elitzur, M., Stone, J.M., Konigl, A. 1994, ApJ, 427, 914
- [] McKee, C.F., & Tan, J.C. 2003, ApJ, 585, 850
- [] Nakano, T. 1989, ApJ, 345, 464
- [] O’Dell, C.R., Muench, A., Smith, N., & Zapata, L. 2008, in Handbook of Star Forming Regions Vol. I (San Francisco: ASP), p. 544
- [] Plambeck, R.L., Wright, M.C.H., Welch, W.J., Bieging, J.H., Baud, B., Ho, P.T.P., & Vogel, S.N. 1982, ApJ, 259, 617
- [] Repolust, T., Puls, J., & Herrero, A. 2004, A&A, 415, 349
- [] Robitaille, T.P., Whitney, B.A., Indebetouw, R., Wood, K., & Denzmore, P. 2006, ApJS, 167, 256
- [] Robitaille, T.P., Whitney, B.A., Indebetouw, R., & Wood, K. 2007, ApJS, 169, 328
- [] Scoville, N.Z., Sargent, A.I., Sanders, D.B., Claussen, M.J., Masson, C.R., Lo, K.Y., & Phillips, T.G. 1986, ApJ, 303, 416
- [] Serabyn, E., Güsten, R., & Schultz, A. 1993, ApJ, 413, 571
- [] Shuping, R.Y., Bally, J., Morris, M., & Throop, H. 2003, ApJ, 587, L109
- [] Smith, N. 2006, MNRAS, 367, 763
- [] Smith, N., Bally, J., Shuping, R.Y., Morris, M., &Hayward, T.L. 2004, ApJ, 610, L117
- [] Smith, N., Bally, J., Shuping, R.Y., Morris, M., & Kassis, M. 2005, AJ, 130, 1763
- [] Smith, N., & Brooks, K.J. 2007, MNRAS, 379, 1279
- [] Smith, N., Jackson, J.M., Kraemer, K.E., Deutsch, L.K., Bolatto, A., Hora, J.L., Fazio, G., Hoffmann, W.F., & Dayal, A. 2000, ApJ, 540, 316
- [] Smith, N., Jones, T.J., Gehrz, R.D., Klebe, D., & Creech-Eakman, M.J. 2001, AJ, 121, 984
- [] Stahler, S.W., Palla, F., & Ho, P.T.P. 2000, Protostars and Planets IV, 327
- [] Tan, J.C., & McKee, C.F. 2004, ApJ, 603, 383
- [] Tofani, G., Felli, M., Taylor, G.B., & Hunter, T.R. 1995, A&AS, 112, 299
- [] Tsujimoto, M., Hosokawa, T., Feigelson, E.D., Getman, K.V., & Broos, P.S. 2006, ApJ, 653, 409
- [] Weaver, R., McCray, R., Castor, J., Shapiro, P., & Moore, R. 1977, ApJ, 218, 377
- [] Welch, W.J., Dreher, J.W., Jackson, J.M., Tereby, S., & Vogel, S.N. 1987, Science, 238, 1550
- [] Whitney, B.A., Indebetouw, R., Bjorkman, J.E., & Wood, K. 2004, ApJ, 617, 1177
- [] Williams, J.A., Dickel, H.R., & Auer, L.H. 2004, ApJS, 153, 463
- [] Wilner, D.J., De Pree, C.G., Welch, W.J., & Goss, W.M. 2001, ApJ, 550, L81
- [] Wood, D.O.S., & Churchwell, E. 1989, ApJS, 69, 831
- [] Wolfire, M.G., & Cassinelli, J.P. 1987, ApJ, 319, 850
- [] Yorke, H.W., & Sonnhalter, C. 2002, ApJ, 569, 846
- [] Zapata, L.A., Rodriguez, L.F., Kurtz, S.E., O’Dell, C.R., & Ho, P.T.P. 2004, ApJ, 610, L121