Foams Foams, rheology Yield stress (rheology)
The origin of the strain-rate discontinuity in 2D foam rheometry with circular geometry
Abstract
The observed discontinuity in strain-rate for a two-dimensional foam undergoing shear in a (circular) Couette system is explained in terms of the continuum (Herschel-Bulkley) model. It is attributed to the finite difference between yield and limit stress.
pacs:
82.70.Rrpacs:
83.80.Izpacs:
83.60.La1 Introduction
Many of the existing observations in 2D foam rheology [1, 2, 3, 4] may be accounted for within the general continuum model that incorporates bulk dissipation and, where appropriate, wall drag [5, 6, 7, 8]. One feature that has so far escaped such an explanation is the discontinuity of the derivative of velocity (or of the shear rate), reported by the group of M. Dennin [3, 9] for the case of a 2D foam in a circular (Couette) rheometer. Figure 1 shows the data. These measurements were made using the variety of 2D foam that is also known as the Bragg raft.
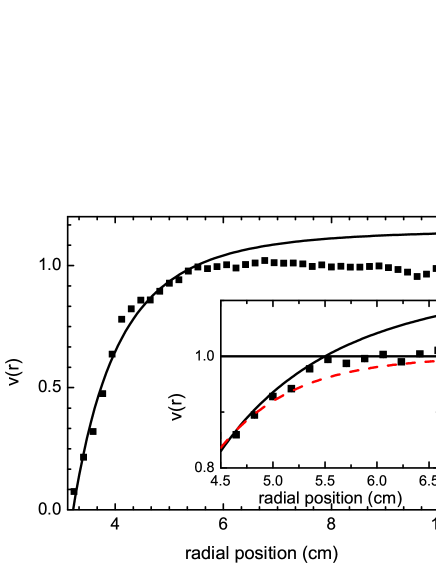
This derivative in question is everywhere continuous in the existing continuum model. In the present paper we show that a natural refinement of that model gives rise to just what is observed, and our simulations of the effect offer opportunities for further experimental tests.
The refinement that is required is the incorporation of a stress-strain relation that has a peak or overshoot before it settles down to its asymptotic value. That is, there is a yield stress that is in excess of the eventual limit stress, and it is the difference between these quantities that relates to the discontinuity (see Fig. 3). This has for long been a familiar feature of measurements and simulations of foam rheology (e.g.[11]).
However, as elsewhere in the physics of foams, the outcome depends on the detailed history (and even prehistory) of the experiment, so it is essential to study simulations of the velocity profile in various cases. We shall see that this discontinuity does indeed depend on the experimental protocol.
The effect should not, of itself, be restricted to the 2D foam system in question, but we are not aware of any reference to it in 3D foams. In any case, it offers further support for the continuum model in the present context.
In most of what we present, the original primitive version of the continuum model is used [5]. In this, linear forms are used for bulk dissipation and wall drag terms. Later we will indicate the straightforward modification of the main result that arises from the introduction of nonlinear forms, corresponding to the later and more realistic development of the model [8].
2 The continuum model with distinct yield and limit stresses
Clancy et al. [6] have provided an extensive analysis of the 2D foam continuum model for circular (Couette) geometry. It is a much richer scenario than that of simple shear between straight boundaries, although the two are closely similar in some limits. Localisation due to wall drag is combined with geometric effects in this case, so that there are several qualitatively distinct forms of the velocity profile, according to the dimensions of the system, the parameters of the model, the imposed velocity, and whether it is applied to the inner or outer boundary.
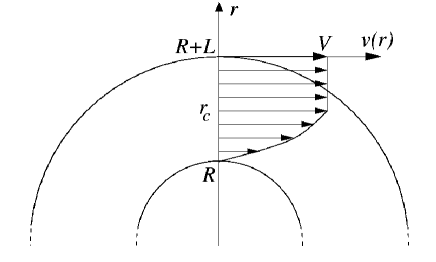
A particular feature of the circular case is the possibility of the existence of a range of radial positions , , at which the strain rate is zero (implying rigid body rotation), as in Figure 1 and the sketch in Figure 2.
The present topic relates to just this feature, specifically to the boundary point between the ranges of zero and non-zero shear rate.
We follow closely the formalism and algorithms of the previous work [5, 6, 7, 8]. In the analysis presented here we will restrict ourselves to a moving outer cylinder to match the experimental conditions of Figure 1. The local strain rate will thus be positive throughout.
We begin with an elementary steady-state treatment that yields a formula for the discontinuity, before embarking on a time-dependent simulation.
The constitutive relation expressing local stress as a function of radial position , local strain and local strain rate is given by [5, 6, 7, 8]
| (1) |
where we call the first term on the right-hand side the elastic-plastic stress. Yield and limit stress are denoted by and , respectively, and are yield and limit strain. The viscosity component of stress (also called consistency) is denoted by . As a function representing the scaled quasi-static stress-strain relation we have arbitrarily chosen
| (2) |
where is fixed in terms of and by the value of the maximum of (w.r.t. ) for ,
| (3) |
See Fig. 3 for a plot of the yielding curve used in our simulations in our time-dependent simulations, described below.

As the strain-rate discontinuity is reported for bubble rafts [3, 9], the expression for the wall drag in the continuum model [5] is omitted. However, the key result of this paper would not be affected by it.
Following from appendix A.3 of [6] we thus have (in the absence of inertia)
| (4) |
and so the radial variation of stress is given by
| (5) |
where is a constant, fixed, for example, by the stress on the moving boundary.
The matching conditions for the steady state profile at the boundary point are as follows.
-
•
Velocity is continuous (otherwise the strain rate would be infinite).
-
•
Total stress is continuous since it is given by eqn. 5.
The second condition is most relevant here. On the side of that is undergoing continuous shear with rate , Equation (1) reduces to:
| (6) |
where is the limit stress (Fig. 3).
On the other side of , there is no continuous shear, so the total stress is given by the elastic-plastic stress (first term in Equation 1). Prima facie, it appears that the value of the elastic-plastic stress at can be anywhere in the range , and we here assume the value is appropriate. The next section describes time-dependent simulations that validate this choice for the usual experimental procedure.
Equating the total stress on the two sides of , we obtain
| (7) |
Since the yield stress exceeds the limit stress, , the strain-rate on the shearing side is finite at , leading to a discontinuity in the strain-rate at that point, hence to a discontinuity in the azimuthal velocity gradient at this point.
3 Range of possible magnitudes of the discontinuity
The argument above allows any value of the elastic-plastic stress at that is less than , however, the possibility of having may be dismissed as follows.
Such a value would imply, through Equation 6, a negative value of for values of radii less than, but close to . Assuming continuity of the velocity, this in term implies a velocity maximum in this range, at some value . There is no force on an element at that radius due to the elastic-plastic stress (in the shearing region the elastic-plastic stress must be the limit stress everywhere, because we are dealing with the steady state), but there is a force present due to . Since this cannot be balanced, a value of which is less than is thus not possible.
4 Time-dependent simulations
To explore this further, we resort to the full implementation of the time-dependent model [6], and simulate an experiment in which the system starts from static stress-free equilibrium, and the outer boundary is set in motion with a fixed velocity.
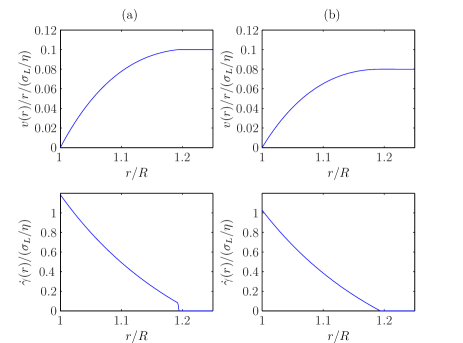
Figure 4 (a) shows angular velocity and strain-rate once a steady state is reached 222Movies of the simulations can be downloaded at http://www.tcd.ie/physics/foams/publications.php. The strain-rate is discontinuous at . Also, in agreement with our argument above and Eqn. 7, it remains positive in the vicinity of , and is given by for the choice of in the simulations shown. Upon decrease of the velocity of the outer boundary a new steady state is reached with velocity and strain-rate profiles as shown in Figure 4 (b). Our simulations show the absence of the discontinuity of the strain rate for this scenario.
As in previous work [6] our algorithm for the implementation of the continuum model is not stable unless allowance is made for the possibility of negative strain rate , even though this would appear not to occur in the solution represented by the numerical results. We still do not have any explanation of this technicality.
5 General continuum model
In the generalisation of the continuum model we introduce a non-linear dependency of the strain rate dependent term in the constitutive relation of Equation (1),
| (8) |
where the exponent is called the Herschel-Bulkely exponent [8]. Using the same argument as for the linear case, we again find a discontinuity in the strain rate at the boundary point between the ranges of zero and non-zero strain-rate. The value of strain rate at this point is given by
| (9) |
6 Conclusion
The overshoot that plays a central role in the above arguments is quite familiar in foam physics, but is nevertheless not understood in any detailed sense. It is attributable to the change of structure under imposed continuous shear [12].
The meaning of this is not entirely self-evident. Suppose we shear a foam considerably, and then reduce stress to zero. Of course, the new structure is microscopically different from the original one, but it is also different in an average, statistical sense. It will, for example, be anisotropic, even if the original sample was not.
The explanation of the shear rate discontinuity, as presented here, may not be unique but seems compelling. It invites further tests, by varying the experimental parameters and, in particular, following the protocol which is predicted to eliminate the discontinuity.
This particular effect is not confined to two-dimensional samples. Accordingly, it may well have been noted in 3d rheometry at some earlier stages, but we are unaware of any direct such observations. In the present context, its explanation lends further support to the continuum model as the natural “mean field” model to be applied to shear localisation in 2D foams, at least as a first approximation. It also offers a test for further experiments, to verify that the discontinuity may be eliminated by a different protocol, as seen in our time-dependent simulations.
7 Acknowledgments
We are grateful to M Dennin for discussions an permission to reproduce Figure 1. This research was supported by the European Space Agency (MAP AO-99-108:C14914/02/NL/SH and (MAP AO-99-075:C14308/00/NL/SH) and the COST P21 action (European Science Foundation) on “The physics of droplets”.
References
- [1] G. Debrégeas, H. Tabuteau, and J.-M. di Meglio. Deformation and flow of a two-dimensional foam under continuous shear. Phys. Rev. Lett., 87:178305, 2001.
- [2] J. Lauridsen, M. Twardos, and M. Dennin. Shear-induced stress relaxation in a two-dimensional wet foam. Phys. Rev. Lett., 89:098303, 2002.
- [3] J. Lauridsen, G. Chanan, and M. Dennin. Velocity profiles in slowly sheared bubble rafts. Phys. Rev. Lett., 93:018303, 2004.
- [4] Y. Wang, K. Krishan, and M. Dennin. Impact of boundaries on velocity profiles in bubble rafts. Phys. Rev. E, 73:031401, 2006.
- [5] E. Janiaud, D. Weaire, and S. Hutzler. Two-dimensional foam rheology with viscous drag. Phys. Rev. Lett., 93:18303, 2006.
- [6] R. J. Clancy , E. Janiaud, D. Weaire and S. Hutzler. The response of 2d foams to continuous applied shear in a couette rheometer. Eur. Phys. J. E, 21:123–132, 2006.
- [7] E. Janiaud, D. Weaire, and S. Hutzler. A simple continuum model for the dynamics of a quasi-two dimensional foam. Colloids and Surfaces A: Physicochem. Eng. Aspects, 309:125–131, 2007.
- [8] D. Weaire, S. Hutzler, V.J. Langlois, and R.J. Clancy. Velocity dependence of shear localisation in a 2d foam. Phil. Mag. Lett., 88:387–396, 2008.
- [9] C. Gilbreth, S. Sullivan, and M. Dennin. Flow transitions in two-dimensional foams. Phys. Rev. E, 74:051406, 2006.
- [10] M. Dennin. Discontinuous jamming transitions in soft materials: coexistence of flowing and jammed states. J. Phys.: Condens. Matter, 20:283103 (14pp), 2008.
- [11] S.A. Khan, C.A. Schnepper, and R.C. Armstrong. Foam rheology: Iii. measurement of shear flow properties. J. Rheol., 32:69–92, 1988.
- [12] D. Weaire, F. Bolton, T. Herdtle, and H. Aref. The effect of strain upon the topology of a soap froth. Philosophical Magazine Letters, 66:293–299, 1992.