Above-Bandgap Magneto-optical Kerr Effect in Ferromagnetic GaMnAs
Abstract
We have performed a systematic magneto-optical Kerr spectroscopy study of GaMnAs with varying Mn densities as a function of temperature, magnetic field, and photon energy. Unlike previous studies, the magnetization easy axis was perpendicular to the sample surface, allowing us to take remanent polar Kerr spectra in the absence of an external magnetic field. The remanent Kerr angle strongly depended on the photon energy, exhibiting a large positive peak at eV. This peak increased in intensity and blue-shifted with Mn doping and further blue-shifted with annealing. Using a 30-band model with antiferromagnetic - exchange interaction, we calculated the dielectric tensor of GaMnAs in the interband transition region, assuming that our samples are in the metallic regime and the impurity band has merged with the valence band. We successfully reproduced the observed spectra without ad hoc introduction of the optical transitions originated from impurity states in the band gap. These results lead us to conclude that above-bandgap magneto-optical Kerr rotation in ferromagnetic GaMnAs is predominantly determined by interband transitions between the conduction and valence bands.
pacs:
78.67.Ch,71.35.Ji,78.55.-mI Introduction
Dilute magnetic semiconductors,Furdyna and Kossut (1988) i.e., II-VI or III-V semiconductors doped with transition metal ions, show a variety of magnetic phenomena arising from the interplay between localized and delocalized carriers. The strong - exchange interaction between band carriers (,) and Mn local moments () results in enormous enhancement of carrier -factors as well as the formation of magnetic polarons. The discovery of carrier-induced ferromagnetism in (III,Mn)V semiconductorsMunekata et al. (1989); Ohno et al. (1992); Munekata et al. (1993); Ohno et al. (1996) with relatively high Curie temperatures ( 190 K)Novák et al. (2008) has stimulated further interest in these systems both from applied and fundamental viewpoints.MacDonald et al. (2005) Although it has been experimentally established that the ferromagnetic interaction between Mn moments is mediated by free holes,Koshihara et al. (1997); Ohno et al. (2000) there remain some basic questions as to the nature of the free holes (-like or -like) and the role of Mn impurity bands in transport and optical processes.
Magneto-optical (MO) spectroscopy is useful for studying spin-dependent electronic states in magnetic systems via polarization-dependent reflection and absorption, i.e., the MO Kerr effect (MOKE) and magnetic circular dichroism (MCD). Previous MO studies of GaMnAs,Ando et al. (1998); Szczytko et al. (1999); Beschoten et al. (1999); Okabayashi et al. (2001); Komori et al. (2003); Singley et al. (2003); Burch et al. (2004, 2006); Lang et al. (2005); Chakarvorty et al. (2007); Ando et al. (2008); Berciu et al. (2009); Acbas et al. (2009) however, have produced much controversy regarding the value and sign of the - exchange coupling constant, , the position of the Fermi level, the insulating vs. metallic nature of the samples, and the contribution of the optical transitions originated from Mn impurity states.
One of the commonly observed characteristics in MO spectra for ferromagnetic GaMnAs is that the sign of MO signal above the band gap ( to eV) corresponds to greater absorption for polarization of light than for polarization, which is opposite to (II,Mn)VI systemsFurdyna and Kossut (1988) as well as paramagnetic GaMnAs with low Mn doping. An opposite sign of MO signal could indicate an opposite sign of exchange coupling. Szczytko et al.Szczytko et al. (1999) proposed that the sign difference is a result of being inside the valence band in ferromagnetic GaMnAs while - exchange coupling is still antiferromagnetic () as in (II,Mn)VI; due to exchange splitting, the Moss-Burstein shift Moss (1954) is expected to become spin-dependent, and thus, the lowest-energy transition should occur at a large momentum, while the lowest-energy transition should still occur near the zone center. Komori et al. also explained their MO data by adopting this model.Komori et al. (2003) However, Lang et al.,Lang et al. (2005) in analyzing their MO data within a parabolic band model assuming that resides inside the valence band, had to conclude that - exchange coupling is ferromagnetic (); in order to explain their data quantitatively, they were also forced to introduce a dispersionless level of unclear origin inside the conduction band that would need to have a very large oscillator strength (three times larger than the usual valence-band-to-conduction-band transitions). In order to identify the optical contribution from the impurity band, infrared spectroscopy studies have been carried out as it probes electronic states near the Fermi surface. Burch et al.Burch et al. (2004, 2006) interpreted the observed peak around 0.2 eV as the valence-band-to-impurity-band transition. On the contrary, Acbas et al.Acbas et al. (2009) measured infrared Kerr and Faraday effects in GaMnAs and explained the spectra with a valence-band-hole theory. In addition, Ando et al.Ando et al. (2008) and Berciu et al.Berciu et al. (2009) both performed a MCD study on paramagnetic and low- ferromagnetic GaMnAs samples. Ando et al. claimed that the MO features below 1.4 eV are likely to be related to impurity states. They interpreted their above-band-gap spectra in ferromagnetic samples as being composed of a broad positive impurity-related background and negative and positive peaks associated with band-edge singularities ( and critical points, respectively), concluding that is in the Mn impurity band and there is no Moss-Burstein shift. Berciu et al., based on their sample-dependent analysis and simplified one-dimensional model, proposed a unified interpretation of MCD spectra taking into account both impurity band and valence band contributions. Different from Ando et al., they concluded that the broad positive feature was due to valence-band-to-conduction-band transitions while the negative MCD near 1.4 eV, which occurred only when the sample was fully magnetized, was due to impurity-band-related transitions.
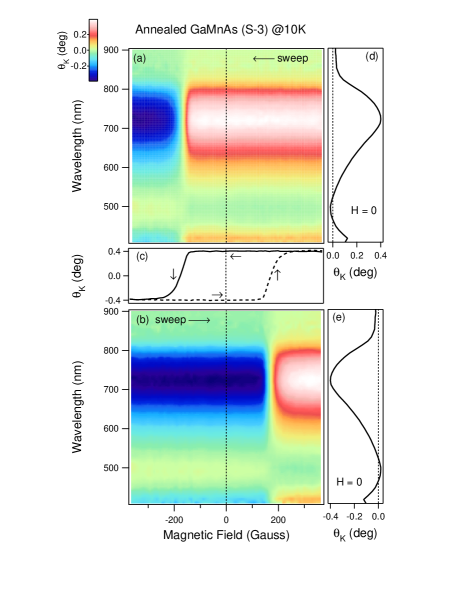
Here, we report results of a systematic MOKE spectroscopy study of GaMnAs samples with different Mn densities with three continuously varying experimental parameters: temperature (10 K - 75 K), magnetic field ( - Gauss), and photon energy (1.4 eV - 3.1 eV). Figure 1 displays representative Kerr rotation data measured for a Ga0.976Mn0.024As sample (S-3) at 10 K when the magnetic field was swept between positive 400 Gauss and negative 400 Gauss. Strong variations of the Kerr angle are seen as a function of wavelength and magnetic field. Magnetic hysteresis is also evident by comparing the down-sweep [in (a)] and up-sweep [in (b)] data.
We focus on the remanent Kerr angle, i.e., the Kerr angle at zero external magnetic field, which was found to strongly depend on the photon energy, exhibiting positive peaks near 1.7 eV and 3 eV and a negative peak near 2.5 eV. Without an external magnetic field, the MOKE spectra were caused by the interband transitions between the spontaneously spin-split bands. The eV peak increased in intensity and blue-shifted with the Mn density and further blue-shifted with annealing. Using a 30-band model with antiferromagnetic sign of p-d exchange interaction, disorder broadening, and density dependent band gap, we calculated the dielectric tensor of GaMnAs in the interband transition region and successfully reproduced the observed spectra assuming that our samples are in the metallic regime and the Mn impurity band has merged with the valence band. There was no need to add any background dielectric constant or the optical transitions involving impurity states located in the band gap in order to explain our spectra.
II Samples and Experimental Methods
| sample | S-1 | S-2 | S-3 |
|---|---|---|---|
| 0.01 | 0.024 | 0.024 | |
| (K) | 30 | 45 | 70 |
| unannealed | unannealed | annealed |
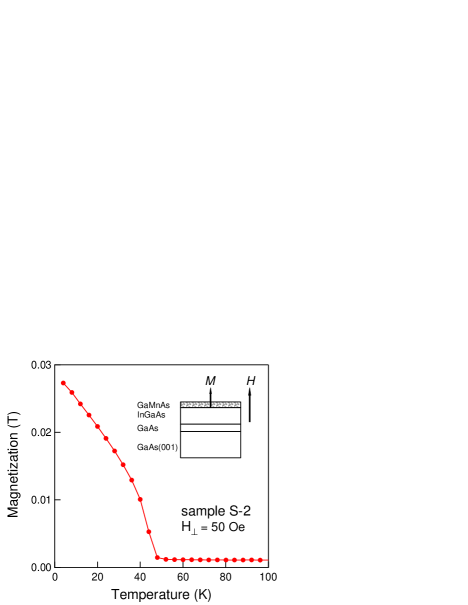
The three GaMnAs samples studied were grown by low-temperature molecular beam epitaxy (LT-MBE). They have a similar structure consisting of a 50-nm epilayer of Ga1-xMnxAs and a buffer layer of 1000-nm In0.14Ga0.86As on a GaAs (001) substrate. The sample structure is depicted in the inset of Fig. 2. Sample S-1 had a nominal Mn content () of 0.01 and = 30 K. Sample S-2 had a nominal Mn content of 0.024 and = 45 K. The third sample, S-3, was from the same wafer as S-2, but was further annealed in air at 190 for four hours. Its was increased to 70 K. Annealing is known to remove the interstitial Mn defects (Mn) in LT-MBE GaMnAs and increase the effective Mn content and the hole density .Blinowski and Kacman (2003); Edmonds et al. (2004); Zhao et al. (2005) As a donor, Mn compensates acceptors and decreases the hole carrier concentration in the sample. Mn also prefers to be antiferromagnetically coupled to substitutional Mn in such a way that it reduces the local spins in the lattice. Thus, we expect that sample S-3 has a higher concentration of holes as well as effective Mn than S-2. The sample parameters are summarized in Table 1. All the samples exhibited an “out-of-plane” easy axis, i.e., the magnetization direction was perpendicular to the sample surface. Temperature dependent magnetization of sample S-2 measured with a small perpendicular field of 50 Oe is shown in Fig. 2. A of 45 K is clearly observed.
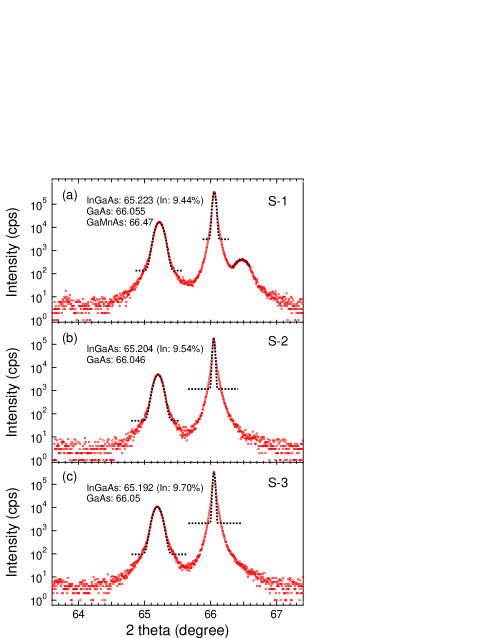
The “out-of-plane” anisotropy indicates that all three samples are strained. The x-ray diffraction (XRD) patterns of the three samples are shown in Fig. 3. The spacings of the (004) planes of the InGaAs, GaAs, and GaMnAs layers are measured. In the case of sample S-1, the peaks of the three layers are observed at 65.2, 66, and 66.5 degrees, respectively, indicating that the lattice parameter of InGaAs is larger than that of the GaAs, whereas the lattice parameter of the GaMnAs is smaller than that of the GaAs. Therefore, the epilayer of sample S-1 is fully strained. The indium composition inferred from the lattice parameter is about 9.44% in the buffer layer. In sample S-2 and S-3, peaks for InGaAs and GaAs remain around 65.2 and 66 degrees, respectively. However, the peak for GaMnAs is missing. It indicates that there is no well-defined lattice parameters for GaMnAs in these two samples. This happens when the epilayer is neither fully strained nor fully relaxed. Instead, the lattice parameter changes continuously across the growth direction. Thus, diffracted x-ray waves do not result in the well-defined Laue function with a sharp feature.
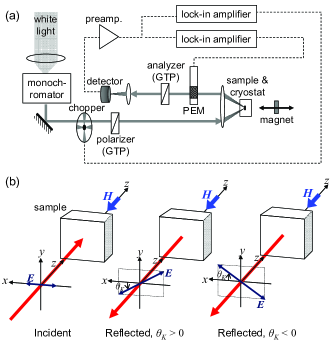
MOKE measurements were performed in the polar geometry in which the light beam was quasi-normally incident on the sample surface. Figure 4(a) is a schematic diagram of the experimental setup. White light from a 100 W Xe lamp is first focused into a monochromator. Light with selected wavelength is then polarizaed with a Glan-Thompson polarizer and modulated with a mechanical chopper. The linearly polarized light impinges on the magnetic sample at a nearly normal incident angle. The reflected beam passes through a photoelastic modulator (PEM), and an analyzer, and then its intensity is detected with a Si photodiode. The current signal is amplified and converted into a voltage and fed into lock-in amplifiers. The Kerr angle caused by the different reflection of is proportional to the signal at the second harmonic of the PEM modulation frequency. The two lock-in amplifiers are used to demodulate the signal. The first lock-in amplifier is referenced to the chopper frequency to provide a measurement of the average light intensity at each wavelength. The second lock-in amplifier is referenced to the second harmonic of the PEM frequency to record the fast oscillating signal at 100 kHz. The Kerr rotation angle () is derived from the ratio of these two.
Figure 4(b) schematically shows our configuration in more detail. Note that the magnetic field vector is opposite to the wave vector of the incident light. This is important in determining how the refractive indices of circularly polarized normal waves in the material are related to the components of the dielectric tensor. The Kerr angle is defined as an arctangent of the negative ratio of the -component to the -component of the reflected electric field, assuming that the incident wave propagating in the positive -direction is linearly polarized in the -direction. To determine the sign of rotation, we first replace the sample with a silver mirror and induce a rotation of polarization by rotating the polarizer in front of the cryostat. Depending on the direction of rotation (clockwise or counterclockwise), there is a -phase shift in the lock-in reading. We define it to be positive if the rotation is clockwise. When the sample is mounted and a magnetic field is applied in the negative -direction, the polarization rotation, i.e., the Kerr angle, is then measured and recorded.
Samples are kept in a helium-flow cryostat, allowing us to vary the temperature () from 10 K to above . An external magnetic field () is applied perpendicular to the sample surface. The coercivity and saturation field are known to be small for all three samples from SQUID measurements. Thus, the magnetic field is swept within the range between 400 Gauss. The Faraday rotation induced by the cryostat window was subtracted. Any polarization anisotropy caused by components in the setup was carefully calibrated and subtracted to get the accurate Kerr rotation.
III Experimental Results
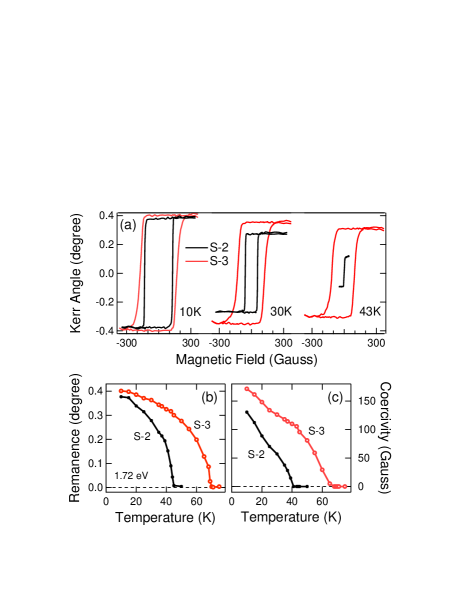
Hysteresis loops measured with 720 nm (1.72 eV) for sample S-2 and S-3 are compared in Fig. 5(a) at three temperatures, 10 K, 30 K, and 43 K. Generally, the annealed sample S-3 has a larger hysteresis loop than S-2 with both larger saturation Kerr angle and increased coercive field . At low temperature (10 K), the difference between the two is relatively small; the remanent Kerr angles are 0.4∘ and 0.38∘, respectively, and the coercive fields are Gauss and Gauss, respectively. With increasing temperature, the difference becomes more and more pronounced. The sharp vertical switching of Kerr angle near the coercive field indicates the high quality of the sample with strong perpendicular magnetization for S-2. Annealed sample S-3 also presents strong anisotropy out of plane although the change over occurs at a slightly slower rate when compared to S-2. Figures 5(b) and 5(c) display the temperature dependence of remanent (at 1.72 eV) and , respectively, for S-2 and S-3. It is clearly seen that increases as a result of annealing.
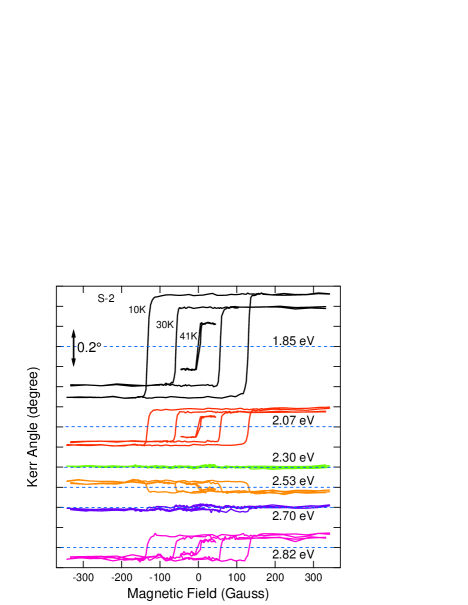
The photon energy dependent hysteresis loops, versus , for sample S-2 are presented in Fig. 6. For each photon energy, three hysteresis loops measured below ( = 10 K, 30 K, and 41 K) are displayed, and the size of the loop is seen to shrink with increasing temperature. At each temperature, the vertical size of the hysteresis loop (i.e., the remanent ) shows considerable variation with photon energy, while its horizontal width (i.e., the coercivity ) remains constant. As we can see, the hysteresis loops are sharp and well-defined at most photon energies but disappear at 2.30 eV and 2.70 eV, although the temperature is below . In addition, the sign of remanent depends on the photon energy. With the same sweeping direction, the hysteresis loop at 2.53 eV varies in the opposite way to that at 2.07 eV and 2.82 eV.
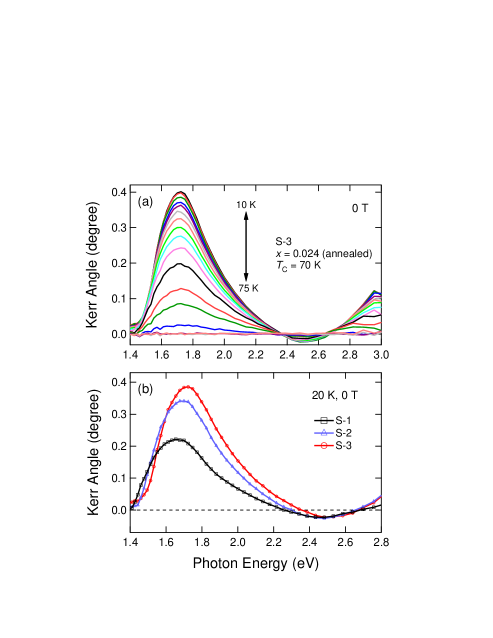
Remanent Kerr spectra ( at = 0 versus photon energy) for sample S-3 at various (from 10 K to 75 K) are shown in Fig. 7(a). Above , there is no Kerr signal left. Below , each spectrum contains a pronounced positive peak at eV and a weaker positive peak at eV. The spectrum flips signs in the range of 2.4 - 2.7 eV. With increasing temperature, the main 1.72 eV peak remains in the same spectral position, while the magnitude decreases and finally disappears above 70 K. Spectra for S-1 and S-2 were essentially the same as S-3, except that the main peaks occurred at slightly lower energies. Spectra for all three samples at 20 K are plotted together in Fig. 7(b). We clearly see that the main peak shifts from 1.65 eV in S-1 to 1.7 eV in S-2 and to 1.72 eV in S-3, due to increasing Mn content (S-1 to S-2 and S-2 to S-3) and annealing (S-2 to S-3).
IV Theoretical modeling
IV.1 Band Structure Calculation
Our theoretical model is based on the methodLuttinger and Kohn (1955); Bir and Pikus (1974); Richard et al. (2004); Radhia et al. (2007) and treats the antiferromagnetic exchange coupling between the hole spins in the host semiconductor and the substitutional Mn2+ spins within the mean-field approximation.Dietl et al. (1997); Jungwirth et al. (1999); Dietl et al. (2000, 2001); König et al. (2001) Recently, this approach was used to explain observed MO effects in GaMnAs in the metallic regime, especially in the infrared spectral region near the Fermi level located inside the valence band.Acbas et al. (2009) Here we model our experimental magneto-optical Kerr spectra in the interband region with a similar approach, but using a full band structure obtained with a 30-band methodRichard et al. (2004) instead of the effective band structure calculation based on the 2-level model, which includes only and / (here we follow the double group notation throughout the paper). We show that this approach provides quantitatively and qualitatively reasonable results in reproducing the measured Kerr spectra and magnetization.
To model MOKE spectra up to eV, the extension to the full band structure is critical, since the 8-band method based on the 2-level model, which is often employed to explain the electronic band structure of metallic GaMnAs, is valid only up to Å-1 measured from the edge, in both the conduction band and the valence band. Optical transitions with energy eV involve states with -vectors higher than the above value, where the 2-level model breaks down. Furthermore, the dielectric tensor in the spectral range of interest obtains significant contributions from transitions with energies higher than 3 eV. Simulations based on the 8-band model have to include an adjustable static dielectric constant added by hand.
Furthermore, within the 2-level model, one needs to specify the Luttinger parameters in order to take into account the interaction of the valence band with remote bands. The 30-band Hamiltonian does not contain the Luttinger parameters; instead, the coupling between bands is described in terms of the matrix elements and band edges that are retrieved from the experiments. Once the band structure is determined with the 30-band method, one can calculate the Luttinger parametersRichard et al. (2004); Radhia et al. (2007) for the subsequent use in simplified 8-band calculations. This is an important advantage of the 30-band method as compared to the 8-band method. Therefore, the modification of the valence band interaction with remote bands due to antiferromagnetic Mn-hole spin exchange coupling, strain, and Coulomb interaction effects in diluted magnetic semiconductors can be simultaneously taken into account within the 30-band model. Also, the lack of inversion symmetry is taken into account through the matrix element between and /.
The extended method is known to be valid up to 5 eV above and 6 eV below the top of the valence band, covering interband transitions of energies up to 11 eV. It has been successfully applied to calculating effective masses and factors for the group IV and III-V semiconductors.Richard et al. (2004); Fraj et al. (2007) The general shortcomings of the method are also known; e.g., limited experimental data for higher conduction bands, the numerical difficulty in ensuring the continuity between U and K symmetry points. The accuracy of the GaAs band structure calculations with the 30-band method is discussed, e.g., in Ref. Richard et al. (2004). Here, we do not reproduce all the complicated basis orbitals, energy level structures, band edge energies, and matrix elements for pure GaAs in a 30-band model, instead referring the reader to Refs. Richard et al., 2004 and Radhia et al., 2007.
Our model Hamiltonian matrix is expressed as
| (1) | |||||
where
| (2) |
is a 30-band matrix, is the strain Hamiltonian matrix, is the strain tensor, in which all off-diagonal elements are zero; and are coordinates, consists of the linear combination of the deformation potentials,Bir and Pikus (1974) is the bare electron mass, and describes the spin exchange interaction between the substitutional Mn magnetic impurity spins and the itinerant charge carrier spins in the host semiconductor within the mean-field approximation. The indices and run over all 30-band basis orbitals. The antiferromagnetic spin exchange constant is not zero only when the bases correspond to , , and ; meVnm3 for , meVnm3 for ,Okabayashi et al. (1998); Szczytko et al. (2001) and , where is the lattice constant of GaMnAs. The strain effects are included only for the bases , , and . In this approximation, the edges of , , and states are shifted by strain in the same way as those in the 8-band model.
We qualitatively took into account many-body Coulomb interactions through the phenomenological band gap narrowing (BGN). The hole-occupied exchange spin-split bands were assumed to be rigidly shifted by an amount , where cmeV and is in cm-3.Jain et al. (1990) The proportionality constant is compatible with that used in Ref. Acbas et al., 2009. Several iterations were necessary to obtain self-consistent positions of the edges and the Fermi level. Still, the resulting BGN shifts are only qualitative; rigorous calculations will be attempted elsewhere. The disorder effect was also phenomenologically described as broadening of interband optical transitions ( meV half-width at half-maximum) in the linear dielectric response function.
The thermal fluctuations of Mn spin ordering at temperature = 20 K, at which the experimental data in Fig. 7(b) was obtained, can be roughly estimated by comparing the measured amplitudes of the remanent Kerr angle as a function of an external magnetic field at 10 K and 20 K. The effect of thermal fluctuations was included in the calculation of temperature-dependent dielectric tensors and Kerr angle spectra. The temperature dependence of other physical parameters, for example, the band gap, the lattice constant, the strain tensor, and the hole density were assumed to be negligible in this narrow temperature range.
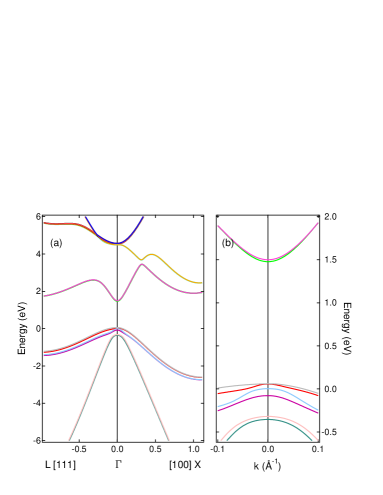
We assumed that our samples only have the epitaxial biaxial tensile strain (see Section II), which breaks the crystallographic cubic symmetry due to the lattice mismatch between the GaMnAs epilayer and the relaxed GaInAs buffer layer. The same strain parameters as for GaAsVurgaftman et al. (2001) were used for the GaMnAs epilayer except for its lattice constant. Depending on the Mn () and In (9.5%) contents, the strain tensor varies from 0.4 to 0.57% for the MnAs lattice constant 5.98 Å.Ohno et al. (1996) We assumed that our experimental post-growth procedure does not produce any additional significant strain. An example of the band structure calculated with the 30-band method for 5% Mn is shown in Fig. 8.
IV.2 Hole Densities and Magnetic Anisotropy
Before proceeding with the calculation of the frequency-dependent dielectric tensor and magneto-optical Kerr angle spectra, we roughly estimate the hole densities and Curie temperatures in our samples by calculating temperature-dependent magnetization based on the mean-field Zener modelDietl et al. (2000, 2001). In addition, we determine the easy axis of magnetization with the estimated hole densities obtained for various Mn fractions. These will provide not only guidelines for the subsequent Kerr angle calculation but also justification for the results obtained by the extended method in the metallic regime in the interband range. To calculate the ferromagnetic critical temperature, temperature-dependent magnetization, and magnetic anisotropy, we use the 6-band method since these quantities depend only on the very top portion of the valence band structure.
| Mn (%) | hole density, ( cm-3) | |
|---|---|---|
| 3 | 2.35 | |
| 45 (S-2) | 4 | 1.6 |
| 5 | 1.2 | |
| 3 | 5 | |
| 70 (S-3) | 4 | 3.05 |
| 5 | 2.2 | |
| 2 | 2.4 | |
| 30 (S-1) | 3 | 1.39 |
| 4 | 0.97 |
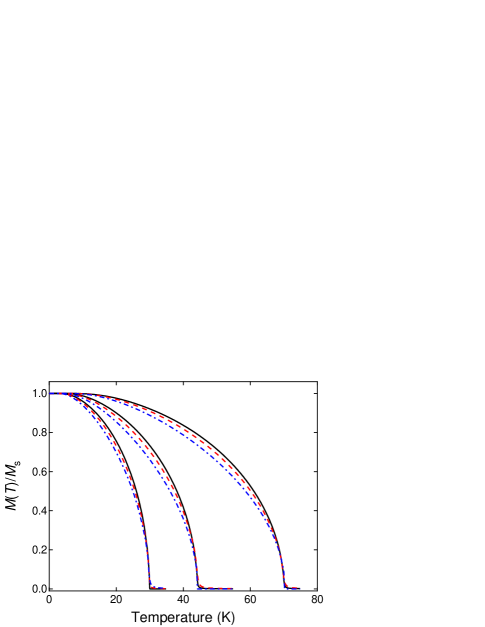
The temperature-dependent magnetization in Fig. 9 was calculated in the limit of strong degeneracy with zero external magnetic field based on the mean-field Zener model.Dietl et al. (2001) Table 2 lists the hole densities for various nominal Mn fractions, for which the calculated Curie temperatures are equal to the experimental ferromagnetic phase transition temperatures obtained from the SQUID measurement of the temperature-dependent magnetization in sample S-2 (Fig. 2) and the measurement of the saturated remanent Kerr angle as a function of temperature (Fig. 5). The calculation neglects the Fermi-liquid effect, which increases ,Dietl et al. (2001) as well as the spin-wave excitations,König et al. (2001) which decrease for a given Mn fraction and a hole density. We simulate the annealing effect,Edmonds et al. (2004) which increased to 70 K for sample S-3, by increasing the hole density for each Mn fraction. Note that generally not only the hole density increases, but also the lattice constant of GaMnAs is reduced upon annealing.Zhao et al. (2005)
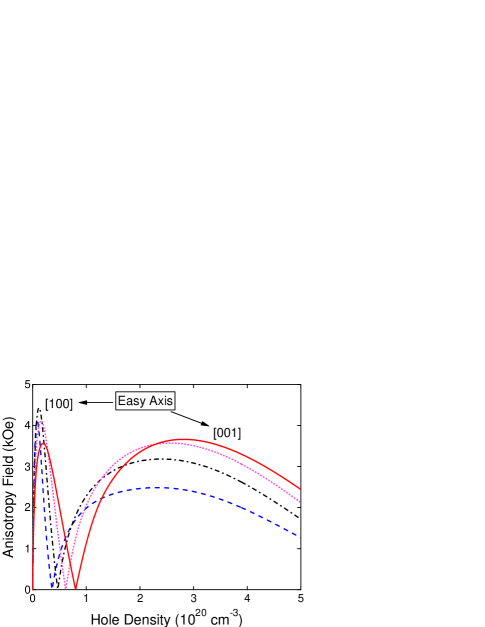
The magneto-crystalline anisotropy, caused by the spin-orbit interaction, is attributed to the valence band holes since the total angular momentum of the local Mn moments is solely due to spins. The anisotropy gives certain preferred directions for the spins to be aligned in crystals, so that the easy direction of magnetization is determined. We estimated the anisotropy field, which is proportional to the difference of hole free energies in [001] and [100] directions,Dietl et al. (2001) for different nominal Mn fractions, showing magnetic easy axes under tensile strain as a function of hole density as shown in Fig. 10. All hole densities shown in Table 2 fall into the out-of-plane magnetic easy axis case ([001]) because they are all larger than the critical hole density for each Mn fraction, in which the easy axis is changed from [100] to [001]. The out-of-plane easy axis is further confirmed by the single domain like-behavior in the hysteresis loops of the measured remanent Kerr angles for the applied out-of-plane external magnetic field shown in Fig. 5.
IV.3 Frequency-Dependent Dielectric Tensor and Kerr Angle Spectra
With the estimated hole densities and magnetic easy axis directions, calculations of the dielectric tensor were performed based on the linear response theory (or the Kubo formulaMarder (2000); Yang et al. (2003); Sinova et al. (2003)) shown in Eq. (3) for several different hole densities (shown in Table 3 from the range of the hole densities and Mn fractions calculated for our samples in the previous section (see Table 2)):
| (3) |
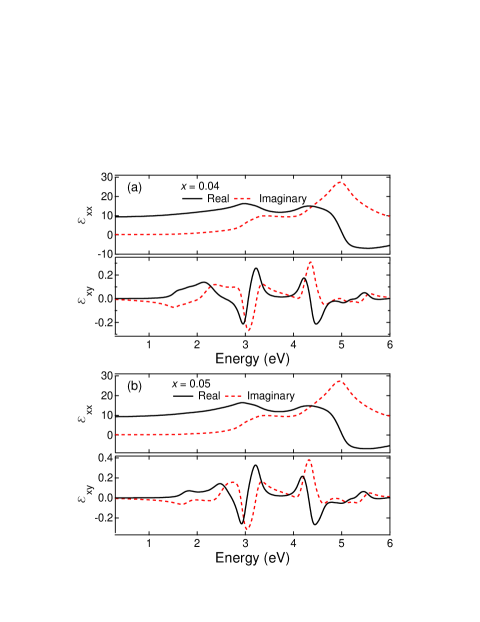
where and denote coordinates and and represent valence bands and conduction bands, respectively. Only interband transitions are included in calculations; is the Fermi-Dirac distribution and are components of the momentum matrix element . The integration is extended over the first Brillouin zone using full band structure calculated with the 30-band method described in Section IV.1. An example of the calculated dielectric tensor is shown in Fig. 11.
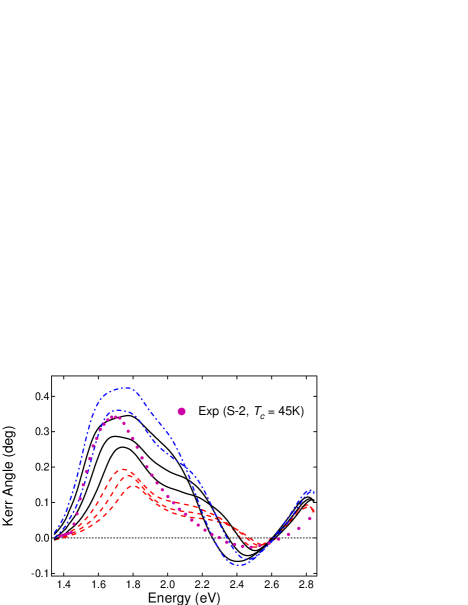
Once frequency-dependent dielectric functions are obtained, calculating Kerr angle spectra is straightforward, taking into account all effects of propagation and reflections in a thin GaMnAs layer and the buffer layer. For the dielectric function of the GaInAs buffer layer, the linear interpolation of the experimental dataPalik (1998) for GaAs and InAs was used. The calculated Kerr angle results are shown in Fig. 12 for sample S-2. Note that for a fixed Mn fraction, the Kerr angle peak magnitude decreases with increasing hole density. This happens because at these densities the Fermi level is already located below the lowest band edge of the spin-split . With increasing hole density, the Fermi level is shifted further downward, which reduces the number of states that contribute to interband optical transitions. On the other hand, if the Fermi level were initially in the middle of the spin-split , increasing the hole density would not necessarily decrease the Kerr angle amplitude.
| Mn (%) | hole density, ( cm-3) | |
| 45 | 2 | |
| 3 | 2.5 | |
| 3 | ||
| 1 | ||
| 4 | 1.5 | |
| 2 | ||
| 5 | 1 | |
| 1.5 | ||
| 2 | ||
| 2 | 2.5 | |
| 3 | ||
| 1.2 | ||
| 30 | 3 | 1.4 |
| 1.6 | ||
| 0.8 | ||
| 4 | 1 | |
| 1.2 | ||
| 2.5 | ||
| 4 | 3 | |
| 70 | 3.5 | |
| 5 | 2 | |
| 2.5 |
Kerr angle calculation results for 4% Mn give the best agreement with the experimental MOKE spectra of S-2, as shown in Fig. 12. The first positive peak that can be attributed to the interband transitions around the critical point is red-shifted due to phenomenological band gap narrowing of 0.121 and 0.138 eV, respectively, for each case. Note that the above Mn fractions are 1.5-2 times larger than the experimental nominal value, 2.4% for S-2, as we discuss in the following section.
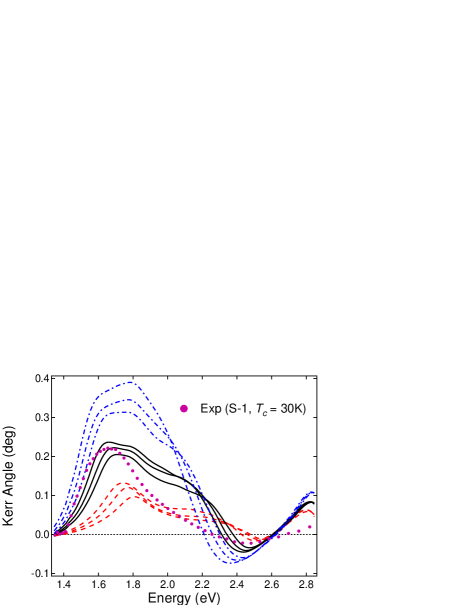
For sample S-1, the calculated result for Kerr angles is closest to the experimental MOKE spectra for 3% Mn, as shown in Fig. 13 and Table 3. This Mn fraction is also larger than the experimental value of 1.5% for sample S-1.
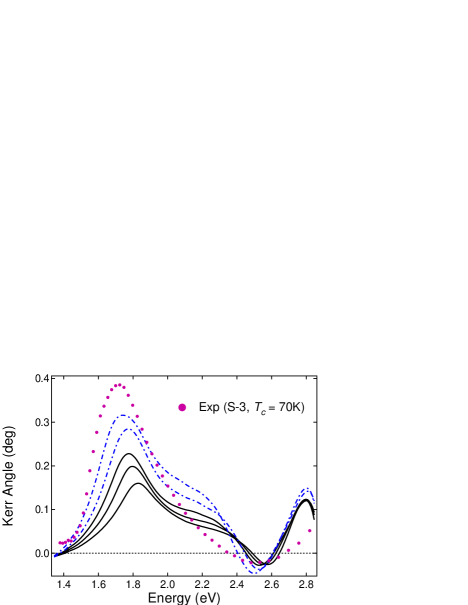
In Table 2, the hole densities that are predicted for K based on the 6-band model are overestimated since at large hole densities the hole free energy calculated with the 6-band model becomes non-negligibly smaller than the one calculated with the full-band model. This originates from the difference between the valence band structures calculated with these two models at large . Therefore, it is expected that the full band structure calculation yields the hole densities lower than those listed in Table 2. Note also that with 4% or 5% Mn fraction, the Kerr angle calculation agrees better with the experimental Kerr spectra for K (S-2), as shown in Fig. 12. Therefore, for the annealed case of K the Kerr angle calculations are performed only for 4% and 5% Mn fractions. The results are shown in Fig. 14, and their corresponding hole densities are listed in Table 3.
V Discussion
Our calculated MOKE spectra of ferromagnetic GaMnAs samples in the interband transition range reveal a general pattern of a large-amplitude positive peak around 1.4-2.3 eV followed by negative and positive peaks with lower-amplitudes at higher photon energies, similar to the experimental data. At the same time, the quantitative spectral shapes and the positions of the peaks sensitively depend on the amount of substitutional Mn, the hole density, and the layer thickness. We determined the range of Mn fractions and corresponding hole densities for which the calculated Curie temperatures were equal to the experimentally measured ferromagnetic transition temperatures. Then the parameters from this range providing the best fit to the measured MOKE spectra were found. The resulting Mn fractions turned out to be larger than the experimental nominal doping values for all samples. If we assume that the experimental Mn concentrations are quite accurate, this result could indicate that antiferromagnetic - exchange coupling strengths are 1.5-2 times stronger than the value of adopted in the simulations. This is because in the mean-field approximation that we used throughout the calculations the exchange coupling Hamiltonian contains the product of and , as shown in Eq. (IV.1).
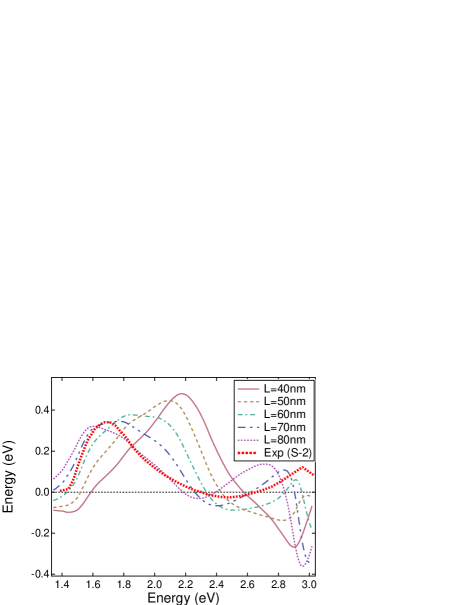
Unlike magnetic circular dichroism, which has a clear physical interpretation as the difference of absorption coefficients between the and polarizations, it is difficult to extract a single physical parameter that determines the characteristics of the Kerr angle spectra in a thin layer limitLang et al. (2005) since the contribution of the GaMnAs layer thickness, diagonal and off-diagonal components of dielectric functions, and the dielectric function of the buffer layer should be explicitly considered. However, the first positive peak can still be attributed to the interband transitions around the critical point. The position of this peak and those of subsequent peaks are affected by the layer thickness. Figure 15 shows a set of calculated MOKE spectra for a fixed Mn fraction (4%) and hole density ( cm-3) but different thicknesses of the GaMnAs epilayer. The Kerr angle peaks red-shift as the thickness increases. The best match to the spectrum of sample S-2 is obtained when the layer thickness is about 70 nm, which is somewhat higher than our nominal value of 50 nm.
For the annealed sample (S-3) the main peak in the measured MOKE spectrum shows a slightly increased amplitude as well as a slight blue-shift as compared to that before annealing (S-2). If we assume that the only effect of annealing is an increased hole density for a given Mn fraction, our simulations predict an opposite trend: a decrease in the amplitude of the Kerr angle peak with increasing hole density. Within the mean field approximation, the observed effect of annealing indicates that the annealing also leads to an increase in the exchange interaction energy through an increase in the Mn fraction or/and .
VI Conclusions
We have used the magneto-optical Kerr effect to investigate three GaMnAs samples with out-of-plane anisotropy but different Mn densities. We measured the magneto-optical Kerr rotation as a function of three continuously varying parameters: photon energy, magnetic field, and temperature. We observed remanent Kerr spectral peaks near 1.7 eV, which increased in intensity and blue-shifted with Mn-doping and further blue-shifted with annealing. We presented theoretical modeling of magnetic and optical properties of ferromagnetic GaMnAs using the mean-field approximation and the 30-band method, in which interband optical transitions are calculated over the whole first Brillouin zone and modified valence band interactions with remote bands affected by the Mn-hole spin exchange interaction, the biaxial strain, and the phenomenological Coulomb interaction and disorder effect are explicitly and simultaneously taken into account. Our calculation of MOKE spectra of thin-film ferromagnetic GaMnAs samples in the metallic regime is in good agreement with the experimental spectra. This supports the GaMnAs electronic band structure in which the impurity band is smeared out into the valence band, although it cannot rule out the presence of impurity states in the band gap. To treat the MOKE spectra more rigorously in the interband range within the full band method, the -dependent self-energy, which explicitly takes into account many-body Coulomb interaction and disorder effects, has to be calculated.
Acknowledgements.
Y.-H. Cho and A. Belyanin acknowledge many helpful discussions with J. Sinova and T. Jungwirth. This work was supported by the NSF through Award Nos. OISE-0530220 and ECS-0547019.References
- Furdyna and Kossut (1988) J. K. Furdyna and J. Kossut, eds., Diluted Magnetic Semiconductors, vol. 25 of Semiconductors and Semimetals (Academic Press, Boston, 1988).
- Munekata et al. (1989) H. Munekata, H. Ohno, S. von Molnár, A. Segmüller, L. L. Chang, and L. Esaki, Phys. Rev. Lett. 63, 1849 (1989).
- Ohno et al. (1992) H. Ohno, H. Munekata, T. Penney, S. von Molnár, and L. L. Chang, Phys. Rev. Lett. 68, 2664 (1992).
- Munekata et al. (1993) H. Munekata, A. Zaslavski, P. Fumagalli, and R. J. Gambino, Appl. Phys. Lett. 63, 2929 (1993).
- Ohno et al. (1996) H. Ohno, A. Shen, F. Matsukara, A. Oiwa, A. Endo, S. Katsumoto, and Y. Iye, Appl. Phys. Lett. 69, 363 (1996).
- Novák et al. (2008) V. Novák, K. Olejník, J. Wunderlich, M. Cukr, K. Výborný, A. W. Rushforth, K. W. Edmonds, R. P. Campion, B. L. Gallagher, J. Sinova, et al., Phys. Rev. Lett. 101, 077201 (2008).
- MacDonald et al. (2005) A. H. MacDonald, P. Schiffer, and N. Samarth, Nature Materials 4, 195 (2005).
- Koshihara et al. (1997) S. Koshihara, A. Oiwa, M. Hirasawa, S. Katsumoto, Y. Iye, C. Urano, H. Takagi, and H. Munekata, Phys. Rev. Lett. 78, 4617 (1997).
- Ohno et al. (2000) H. Ohno, D. Chiba, F. Matsukara, T. Omiya, E. Abe, T. Dietl, Y. Ohno, and K. Ohtani, Nature 408, 944 (2000).
- Ando et al. (1998) K. Ando, T. Hayashi, M. Tanaka, and A. Twardowski, J. Appl. Phys. 83, 6548 (1998).
- Szczytko et al. (1999) J. Szczytko, W. Mac, A. Twardowski, F. Matsukura, and H. Ohno, Phys. Rev. B 59, 12935 (1999).
- Beschoten et al. (1999) B. Beschoten, P. A. Crowell, I. Malajovich, D. D. Awschalom, F. Matsukura, A. Shen, and H. Ohno, Phys. Rev. Lett. 83, 3073 (1999).
- Okabayashi et al. (2001) J. Okabayashi, A. Kimura, O. Rader, T. Mizokawa, A. Fujimori, T. Hayashi, and M. Tanaka, Phys. Rev. B 64, 125304 (2001).
- Komori et al. (2003) T. Komori, T. Ishikawa, T. Kuroda, J. Yoshino, F. Minami, and S. Koshihara, Phys. Rev. B 67, 115203 (2003).
- Singley et al. (2003) E. J. Singley, K. S. Burch, R. Kawakami, J. Stephens, D. D. Awschalom, and D. N. Basov, Phys. Rev. B 68, 165204 (2003).
- Burch et al. (2004) K. S. Burch, J. Stephens, R. K. Kawakami, D. D. Awschalom, and D. N. Basov, Phys. Rev. B 70, 205208 (2004).
- Burch et al. (2006) K. S. Burch, D. B. Shrekenhamer, E. J. Singley, J. Stephens, B. L. Sheu, R. K. Kawakami, P. Schiffer, N. Samarth, D. D. Awschalom, and D. N. Basov, Phys. Rev. Lett. 97, 087208 (2006).
- Lang et al. (2005) R. Lang, A. Winter, H. Pascher, H. Krenn, X. Liu, and J. K. Furdyna, Phys. Rev. B 72, 024430 (2005).
- Chakarvorty et al. (2007) R. Chakarvorty, S. Shen, K. J. Yee, T. Wojtowicz, R. Jakiela, A. Barcz, X. Liu, J. K. Furdyna, and M. Dobrowolska, Appl. Phys. Lett. 91, 171118 (2007).
- Ando et al. (2008) K. Ando, H. Saito, K. C. Agarwal, M. C. Debnath, and V. Zayets, Phys. Rev. Lett. 100, 067204 (2008).
- Berciu et al. (2009) M. Berciu, R. Chakarvorty, Y. Y. Zhou, M. T. Alam, K. Traudt, R. Jakiela, A. Barcz, T. Wojtowicz, X. Liu, J. K. Furdyna, et al., Phys. Rev. Lett. 102, 247202 (2009).
- Acbas et al. (2009) G. Acbas, M.-H. Kim, M. Cukr, V. Novak, M. A. Scarpulla, O. D. Dubon, T. Jungwirth, J. Sinova, and J. Cerne, Phys. Rev. Lett. 103, 137201 (2009).
- Moss (1954) T. S. Moss, Proc. Phys. Soc. London, Sect. B 67, 775 (1954).
- Blinowski and Kacman (2003) J. Blinowski and P. Kacman, Phys. Rev. B 67, 121204(R) (2003).
- Edmonds et al. (2004) K. W. Edmonds, P. Bogusławski, K. Y. Wang, R. P. Campion, S. N. Novikov, N. R. S. Farley, B. L. Gallagher, C. T. Foxon, M. Sawicki, T. Dietl, et al., Phys. Rev. Lett. 92, 037201 (2004).
- Zhao et al. (2005) L. X. Zhao, C. R. Staddon, K. Y. Wang, K. W. Edmonds, R. P. Campion, B. L. Gallagher, and C. T. Foxon, Appl. Phys. Lett. 86, 071902 (2005).
- Luttinger and Kohn (1955) J. M. Luttinger and W. Kohn, Phys. Rev. 97, 869 (1955).
- Bir and Pikus (1974) G. L. Bir and G. E. Pikus, Symmetry and Strain-Induced Effects in Semiconductors (John Wiley & Sons, New York, 1974).
- Richard et al. (2004) S. Richard, F. Aniel, and G. Fishman, Phys. Rev. B 70, 235204 (2004).
- Radhia et al. (2007) S. B. Radhia, N. Fraj, I. Saidi, and K. Boujdaria, Semicond. Sci. Technol. 22, 427 (2007).
- Dietl et al. (1997) T. Dietl, A. Haury, and Y. M. d’Aubigne, Phys. Rev. B 55, R3347 (1997).
- Jungwirth et al. (1999) T. Jungwirth, W. A. Atkinson, B. H. Lee, and A. H. MacDonald, Phys. Rev. B 59, 9818 (1999).
- Dietl et al. (2000) T. Dietl, H. Ohno, F. Matsukura, J. Cibert, and D. Ferrand, Science 287, 1019 (2000).
- Dietl et al. (2001) T. Dietl, H. Ohno, and F. Matsukura, Phys. Rev. B 63, 195205 (2001).
- König et al. (2001) J. König, H. H. Lin, and A. H. MacDonald, in Lecture Notes in Physics, edited by R. Haug and H. Schoeller (Springer, Berlin, 2001), vol. 579.
- Fraj et al. (2007) N. Fraj, S. B. Radhia, and K. Boujdaria, Solid State Commun. 142, 342 (2007).
- Okabayashi et al. (1998) J. Okabayashi, A. Kimura, O. Rader, T. Mizokawa, A. Fujimori, T. Hayashi, and M. Tanaka, Phys. Rev. B 58, R4211 (1998).
- Szczytko et al. (2001) J. Szczytko, W. Bardyszewski, and A. Twardowski, Phys. Rev. B 64, 075306 (2001).
- Jain et al. (1990) S. C. Jain, J. M. McGregor, and D. J. Roulston, J. Appl. Phys. 68, 3747 (1990).
- Vurgaftman et al. (2001) I. Vurgaftman, J. R. Meyer, and L. R. Ram-Mohan, J. Appl. Phys. 89, 5815 (2001).
- Marder (2000) M. P. Marder, Condesed Matter Physics (John Wiley, New York, 2000).
- Yang et al. (2003) S.-R. E. Yang, J. Sinova, T. Jungwirth, Y. P. Shim, and A. H. MacDonald, Phys. Rev. B 67, 045205 (2003).
- Sinova et al. (2003) J. Sinova, T. Jungwirth, J. Kucera, and A. H. MacDonald, Phys. Rev. B 67, 235203 (2003).
- Palik (1998) E. D. Palik, Handbook of Optical Constants of Solids (Academic Press, San Diego, 1998).