MUSTANG: 90 GHz Science with the Green Bank Telescope.
Abstract
MUSTANG is a 90 GHz bolometer camera built for use as a facility instrument on the 100 m Robert C. Byrd Green Bank radio telescope (GBT). MUSTANG has an 8 by 8 focal plane array of transition edge sensor bolometers read out using time-domain multiplexed SQUID electronics. As a continuum instrument on a large single dish MUSTANG has a combination of high resolution () and good sensitivity to extended emission which make it very competitive for a wide range of galactic and extragalactic science. Commissioning finished in January 2008 and some of the first science data have been collected.
keywords:
Millimeter receiver, TES bolometer, Green Bank Telescope, Multiplexing1 INTRODUCTION
Advances in radio astronomy have been driven by the development of more sensitive receivers. However at higher frequencies (60 GHz) the receiver noise is beginning to be dominated by the random arrival of photons so building lower noise detectors will no longer produce a more sensitive receiver. When this happens the only way to improve on an instrument is to put in more detectors. Large arrays of detectors also have many other advantages over receivers with just a few pixels. For example many systematic effects such as emission from the atmosphere will be common mode to all detectors and so can be removed in data analysis, reducing the need for chopping or rapid scanning, techniques that lower observing efficiency.
The Robert C. Byrd Green Bank Telescope (GBT) is a 100 m diameter radio telescope located in West Virginia, USA. It has an off-axis Gregorian design and an active primary mirror consisting of 2004 panels. A semi-empirical model of how the telescope deforms under gravity keeps the shape of the mirror accurate to 390 m RMS with an eventual target of 240 m. At 90 GHz, a 240 m RMS corresponds to a surface efficiency of 43% (or an effective surface area of 2700 m2). This large surface area combined with a 90 GHz resolution of 8′′ FWHM makes the GBT a unique instrument for a wide range of science. Although interferometers can achieve higher resolution they have little sensitivity to extended emission and their total collecting area is often small.
MUSTANG is a bolometer camera designed for the GBT. It operates at the GBT’s Gregorian focus where a rotating turret houses seven other receivers. This allows users to change between receivers in just a few minutes. Using the GBT at 90 GHz requires benign weather with low wind, low opacity and observations must be at night so uneven heating from the Sun does not distort the dish. Currently the GBT operates on a flexible scheduling scheme with back-up low frequency projects getting the use of the telescope when high frequency observations are not possible. True dynamic scheduling will be implemented shortly. During the winter of 2008 the MUSTANG team found that approximately half of available nights had reasonable weather for 90 GHz observing.
1.1 Science Goals
MUSTANG’s current sensitivity allows it to map a patch of sky to 2.5 mJy/beam in one hour. We expect this to improve by a factor of 10 over the next few years. As a user instrument these sensitivities will allow for a wide range of new galactic, extragalactic, and solar system science. Some examples where MUSTANG will make an impact are discussed next.
1.1.1 Galaxy clusters and the Sunyaev-Zel’dovich Effect
In the next few years experiments such as ACT[1] and the SPT[2] will finish blind surveys for clusters using the Sunyaev-Zel’dovich Effect (SZE). These surveys aim to constrain the evolution of dark energy by measuring the abundance of clusters as a function of redshift. In interpreting these surveys it is important to understand the relation of mass to SZE observables and to constrain the physics contributing to the scatter in these relations. For instance, high angular resolution X-ray observations have revealed relic “cold fronts” in the intra-cluster plasma[3] and bubbles inflated by AGN ejecta.[4] Spatially resolved SZE measurements are essential to understanding these phenomena and their effect on the lower-resolution SZE measurements from the surveys.
1.1.2 Star & planet formation
The details of how opaque clouds of dust and gas collapse into stars have been the subject of a number of studies.[5] [6] [7] There are many questions about what triggers the collapse of a cloud, what determines the mass of the stars formed and the physics of accretion disks known to form around most protostars. When combined with higher frequency data, accurate photometry at 90 GHz will constrain the spectral index of the dust emission from any disks observed. From this, the size of dust grains can be found, restricting some theories of planet formation.
2 INSTRUMENT DESCRIPTION
At the heart of MUSTANG is an eight by eight array of Transition Edge Sensor (TES) bolometers read out using time-domain SQUID multiplexing electronics. The pixels are used without feedhorns and are spaced by approximately half a beam width () on the sky to give a square field of view. This arrangement ensures that the sky is fully sampled in a single pointing of the GBT. To avoid artifacts in maps, multiple observations of different points on the sky should be made on time-scales less than typical drifts in the sky brightness (every few seconds). With a fully sampled array, the scan speeds and accelerations required to do this are reduced. On a structure the size of the GBT this is a great advantage.
TES bolometers use a voltage biased superconducting film to measure optical power. Electrical power heats the TES up above the bath temperature to its transition temperature, , where a natural feedback mechanism keeps the temperature constant. An increase in the optical power being absorbed by the bolometer warms the TES and its resistance increases. Consequently, the current flowing through the device drops reducing the amount of electrical heating so that the sum of the electrical and optical power (and hence the temperature of the device) remains almost constant. Conversely, a decrease in optical power results in a decrease in resistance and an increase in electrical heating. By measuring the current flowing through the TES you measure the optical loading on the bolometer. The strong electrothermal feedback means that a TES bolometer has a response time faster than its thermal time constant, its heat capacity divided by the thermal conductivity from the bolometer to the cold sink. The phonon noise in a regular bolometer increases as the square root of the thermal conductivity and the temperature, so for a given set of operating conditions and target noise levels, an optimally designed TES bolometer will be faster than an optimally designed semiconductor bolometer[8]. To map large areas MUSTANG must scan at tens of beamwidths per second so the faster time constants intrinsic to TES bolometers made them more attractive for use in MUSTANG. Another attractive feature of TES bolometers is that they are of low impedance devices making them less susceptible to microphonics in the readout electronics.
The TES film is made of two layers, a superconducting metal (in our case Molybdenum) and a normal metal (in our case gold). The proximity effect lowers the transition temperature of the superconductor. The thickness of the layers can be varied to give a wide range of possible transition temperatures. The exact choice of depends on the desired detector properties but is limited by the choice of refrigeration used in the receiver. MUSTANG’s detectors are cooled to 300 mK using a helium-3 sorption refrigerator backed by a helium-4 sorption refrigerator. The helium-4 refrigerator is, in turn, backed by a two stage pulse tube. Details of the cryogenic design and performance are given below in section 2.2.
2.1 Detector Design
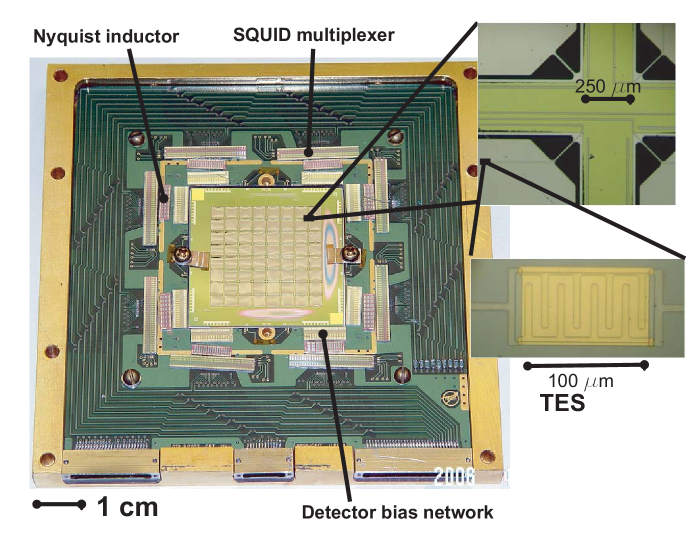 |
A photograph of the MUSTANG detector package is shown in figure 1. Each bolometer consists of a 1 m thick, 2.88 mm square membrane. This is suspended by four 10 m wide legs from a frame 0.25 mm wide. Pixels are spaced by 3.2mm. The array was micromachined out of a 450 m thick silicon wafer at Goddard Space Flight Center[10]. The pixels are coated with an absorbing layer of bismuth which has an impedance matched to free space (400). The TES is deposited close to the edge of the membrane and superconducting aluminum traces run out along two of the legs that suspend the membrane and along the supporting beams to the edge of the array chip. When laying out the design care was taken so that only traces from neighboring pixels run close to each other. This reduces the effect of electrical cross talk as the neighboring pixels observe overlapping parts of the sky.
To maximize absorption efficiency there is a reflecting backshort behind the array. It is constructed of gold plated alumina which has a similar thermal expansion coefficient to the array so stress during cool down is minimized. The alumina is epoxied to flexible copper mounts in the bottom of the copper box.
Two of the most important parameters that affect the noise in a TES bolometer are and , the conduction from the membrane to the bath. These parameters also set the saturation power, a loading above which the TES will not function. Unfortunately values for these parameters that give low noise also give low saturation powers. Bolometer design is inevitably a trade off between good performance in the best weather and the ability to operate in a wider range of weather conditions. For MUSTANG the expected loading per detector was calculated to be between 2 and 9 pW while the photon noise limit was calculated to be 2.4–, depending on weather and elevation. So as to allow for headroom, target saturation powers of 12 pW and a target NEPs of were chosen. Later in the design process it was found that pixels with a 12 pW saturation power would be very fragile so the design saturation power was raised to 25 pW. To give plenty of headroom for operating off the helium-3 refrigerators, the transition temperature was chosen to be 450 mK.
To read out the TES we use the time-domain SQUID multiplexers made by NIST[11] and the Mark III electronics developed at Goddard[12]. Eight multiplexer chips are arranged around the array along with resistor networks, used to provide a constant voltage bias across each TES, and Nyquist inductors that limit high frequency noise. Each multiplexer chip and the electronics used to drive them can read up to 32 detectors so future expansion of the array is possible. Currently, each chip reads out 8 bolometers and a dark channel which is used to detect noise in the electronics. To avoid producing interference in other GBT receivers, all room temperature electronics are housed in RFI tight boxes. Tests in an anechoic chamber showed that, above 30 MHz, no signal larger than -65 dBm was emitted.
2.2 Cryogenic Design and Performance
 |
MUSTANG’s detectors are cooled to below 300 mK using a helium-3 sorption refrigerator backed by a helium-4 sorption refrigerator (700 mK). This in turn, is backed up with a two-stage pulse tube that has temperature stages at 3 K and 40 K[13]. By using a pulse tube, expendable cryogens are not needed, greatly simplifying the logistics of operating on the GBT where access to receivers is limited. This comes at the expense of a dependence of operating temperature on elevation as the pulse tube’s performance drops off when it is tipped by more than 45∘. Consequently, observations at elevations below 20∘ are limited. However, the 90 GHz opacity of the atmosphere at these elevations limits observations so little is lost. Pulse tubes have the advantage of much lower vibrations than other types of cryocoolers, (such Gifford-McMahon).
In the lab, after a 3 hour cycling procedure, the hold time for the helium-4 refrigerator is 48 hours and the helium-3 refrigerator can stay cold for over 96 hours. On the telescope MUSTANG is constantly being tipped and cycling is often carried out with the receiver at 45 degrees from the vertical. In order to ensure successful cycling of the sorption refrigerators in as little time as possible, a second cycling procedure was developed so that the cycle time was halved to 1.5 hours. This cycle was able to complete with the GBT tipped over to elevations as low as 30 degrees. This cycle procedure has a reduced the hold time for the helium-4 refrigerator of 14 hours, however, this is more than enough for most observing sessions. When the helium-4 refrigerator runs out the temperature of the helium-3 stage increases by 15 mK and becomes more sensitive to drifts in the temperature of the pulse tube. The array still functions and data taken in this state are still of good quality. All cycles are completed under the control of a computer and can be started automatically when the helium-3 or helium-4 refrigerators run out or on demand.
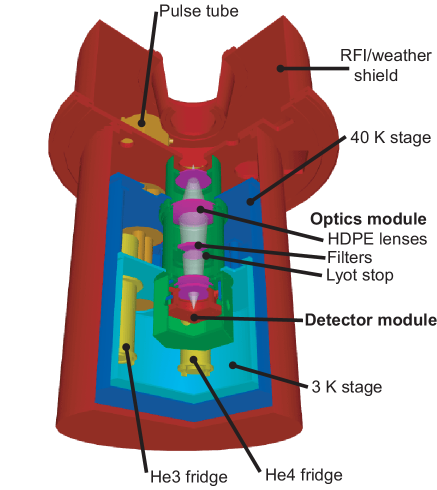
2.3 Optical Design
MUSTANG’s optical design is shown in figure 3. A high density polyethylene (HDPE) lens forms an image of the primary mirror of the GBT at the Lyot stop. The aperture of the Lyot stop is chosen to give uniform illumination of the GBT’s primary out to a diameter of 90 m. Calculations show that once diffraction is taken into account, spillover at the primary is less than 1.6%[14]. After the Lyot stop a second lens reimages the Gregorian focus of the GBT at so as to obtain a pixel spacing on the sky. A small black body placed at the Lyot stop uniformly illuminates the array. During observations this source can be pulsed and used to monitor changes in the response of detectors. To reduce optical loading on the detectors, the first lens is cooled to 40 K and the second lens and the Lyot stop are cooled to 3 K.
MUSTANG’s 81–99 GHz band-pass is defined by a capacitive mesh filter placed over the array. Other low-pass capacitive mesh filters at the Lyot stop and in front of the first lens, block leaks in the band-pass filter and, with the help of IR blocking filters, control the optical loading on the cryogenics. All these filters are made of sheets of patterned metalized polypropylene at Cardiff University. The band-pass and low-pass filters are made of many layers hot-pressed together and are more robust than traditional air-gap filters[15].
Care was taken to control stray light. Stray light can cause a number of problems. Excessive loading on detectors can cause them to saturate and reflections between pairs of optical elements can reimage astronomical sources onto different parts of the array (ghosting). These problems can be especially acute in on-axis optical designs. To reduce reflections, the lenses have grooves in their surfaces. Cold, light absorbing baffles are placed throughout the optical system. Simulations showed that no ghost image with an amplitude greater than the diffraction limited point spread function is formed on the array[14].
 |
3 INSTRUMENT PERFORMANCE
Extensive lab characterization of the instrument has been carried out with the detectors looking at 300 mK and with the detectors looking out into the room. After lab characterization in late 2006, MUSTANG had its first commissioning run on the GBT. The results of this run were used to make some improvements to the instrument, most significantly a large reduction in the amount of 1/f noise. In December 2007 we had another period of commissioning followed, in the spring of 2008, by our first science observations. During the summer of 2008 upgrades to the instrument are being carried out before next winter’s observing season.
3.1 Lab Characterization
Currently, MUSTANG has 57 pixels which show a good response to the internal calibrator a yield of 89%. Of the remaining pixels, five are electrically dead while two show a poor optical response and excessive noise. The optical efficiency of the receiver was measured using hot and cold loads and found to be 73%.
Measurements of the transition temperatures of all working pixels gave a mean of 490 mk, 40 mK hotter than our target value. There was also a larger than expected scatter with some values over 500 mK and others as low as 477 mK. The dimensionless measure of the steepness of the transitions, , was estimated to be 460, three to four times higher than expected. The saturation power of detectors was also found to be higher than expected, typically 42 pW instead of 25 pW.
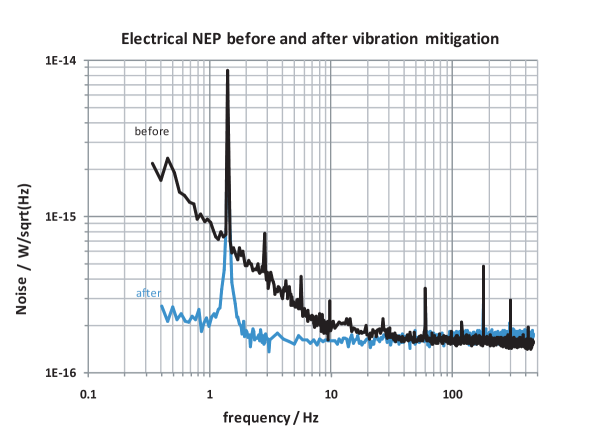 |
Noise power spectra measurements on good pixels gave electrical NEPs between 20 and 110 Hz of around , significantly above our target value. In addition most pixels had excess noise below 20 Hz. Below 20 Hz is where our astronomical signal is located so reducing the noise was a priority. The noise was shown to be uncorrelated between pixels. It was eventually discovered that pixels had narrow mechanical resonances at frequencies around 150 Hz with different pixels having slightly different resonance peaks. Vibrational isolation of the pulse tube mitigated the problem. It is worth noting that other experiments such as ACT[1] successfully use TES bolometers, cooled using pulse tubes in similar cryostats to MUSTANG, without seeing this problem. It is likely that our susceptibility to vibrations comes from the mechanical design of our pixels. Examples of power spectra for some of our pixels can be seen in figure 4.
A clear feature in the power spectra is a narrow (0.1 Hz) spike at 1.4 Hz. This is the frequency our pulse tube operates at. This spike is common mode to all pixels and we attribute the majority of it to temperature fluctuations of the 3 K optical components. A smaller fraction of this noise can be traced to temperature fluctuations of the series array SQUID amplifiers that are the last stage of the NIST multiplexing electronics. As the 1.4 Hz noise is so narrow and common mode it is easy to remove in data processing. In the long term, passive damping of the temperature fluctuations at the head of the pulse tube would be of benefit. Active temperature control would be less desirable as it requires extra power and has a greater chance of failure.
In an effort to understand our higher than expected white noise between 20 and 110 Hz we measured the complex impedance and the response to bias of our detectors. Simple models of our detectors that took into account thermal coupling between the absorber, the membrane, the TES, and the thermal bath were able to produce a qualitative fit to our data and predicted theoretical NEPs around . Our model did not take into account factors such as a finite thermal conduction across our large membranes and possible hanging heat capacities, all of which can increase the noise. What was clear from our simple model was that many parameters such as the phonon conduction between the membrane and the bath differed from their target values in such a way so as to increase the noise significantly above our target.
In summary, our lab tests showed that MUSTANG’s current array is not ideal, having a phonon noise level 8 times higher than the background photon noise expected at Green Bank. However, sensitivity calculations showed that MUSTANG had enough sensitivity for useful preliminary science observations. Now that these observations have been made we are looking into the design of a replacement array with better sensitivities.
3.2 On Telescope Performance
Initial tests showed identical noise performance on the telescope as in the lab. The one exception was that at elevations less than 30 degrees some of the noise returned. In this case it could be traced to the high vibration Gifford-McMahon refrigerators in other receivers. Typically only a few detectors were affected at a time, however, it is our intention to move to a different array design in order to mitigate this problem.
Measurements of bright point sources showed that MUSTANG had a round beam shape of 8–10′′ FWHM, in good agreement with our optical models. By measuring the amplitude of Mars, the surface efficiency for the GBT was found to be 12%, consistent with the surface RMS measured at Q-band (390 m). Deep beam maps show that most of the power lost due to the primary mirror’s RMS is being scattered to large angular scales or into a pedestal around the beam. This implies that the most of the errors in the GBT surface are on small (panel to panel) or medium length scales not gross distortions of the dish that would distort the main beam. However out-of-focus holography using MUSTANG was able to detect some large scale distortions in the GBT’s primary. Out-of-focus holography[16] uses data similar to what is currently taken when focusing MUSTANG. In the future it should be possible to measure and remove all remaining large scale distortions, typically produced by thermal effects, when focusing MUSTANG. Detector loading at was found to vary between 4 pW in our best weather () and 9 pW when the weather had a .

|
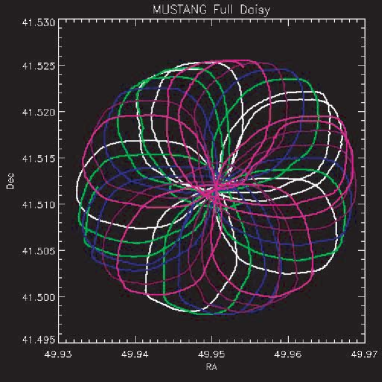
When making total power measurements, any change in atmospheric emission and any low frequency drifts in the receiver will produce large amounts of noise in maps. This is often removed by chopping between positions on the sky. With an array such as MUSTANG it is possible to create scan patterns that make repeated observations of the same part of the sky on many different time-scales. In a single pass, a point source on the sky will only be in a few detectors at any moment in time so it is possible to remove common mode noise such as our 1.4Hz signal which appears in all detectors simultaneously. Multiple re-observations of different patches sky on many different time scales (1–300 seconds) enable slow drifts from the atmosphere or receiver to be removed. We use two such scan strategies, the daisy pattern shown in figure 5 which is good for point source observations and a basket weave pattern which gives more uniform coverage and is good for mapping large areas. An example of an observation made using a basket weave pattern is shown in figure 5.
It is worth noting that many aspects of MUSTANG and the GBT were remarkably stable. The instrument was operated continuously on the GBT for a period of over 3 months without incident. The detector and SQUID biases could be reused with minimal adjustment from night to night. Selection of optimal bias values for the detectors and setting up the SQUID amplifiers typically takes 15 minutes. Gain changes, measured using the black body source were less than 3.7% during an eight hour observing session.
4 CONCLUSIONS
MUSTANG has already demonstrated the potential of bolometer arrays on large telescopes such as the GBT. Over the coming year we will be making a number of improvements to both the instrument and the GBT’s surface enabling more sensitive observations. By achieving a 240 m RMS in the primary of GBT we could gain a factor of 3.5 in sensitivity. Another factor of 2 could be gained by replacing the current array with one that has saturation powers closer to the maximum loading we expect. Expanding the array to 256 pixels would only require changes to the detector package and the optical elements and this is part of our long term plan. NRAO have invited others in the astronomical community to make proposals to use MUSTANG on a shared risk basis. In order for it to fully become a functional facility instrument, work is being carried out on the user interface. In particular we hope to incorporate the improved bias tuning software developed for the ACT experiment[17]. We will better integrate focusing routines into the GBT’s control system and develop the capability for rapid, real-time, out-of-focus Holography which will correct for any large scale aberrations of the primary.
Acknowledgements.
Funding for this project was provided by the National Radio Astronomy Observatory through the NSF and NSF award number AST-0607654.References
- [1] Fowler, J. W. and ACT Collaboration, “The Atacama Cosmology Telescope,” in [Bulletin of the American Astronomical Society ], 38, 1227–+ (Dec. 2006).
- [2] Miknaitis, K., “The South Pole Telescope,” APS Meeting Abstracts , 11005–+ (Apr. 2007).
- [3] Markevitch, M., Ponman, T. J., Nulsen, P. E. J., Bautz, M. W., Burke, D. J., David, L. P., Davis, D., Donnelly, R. H., Forman, W. R., Jones, C., Kaastra, J., Kellogg, E., Kim, D. W., Kolodziejczak, J., Mazzotta, P., Pagliaro, A., Patel, S., Van Speybroeck, L., Vikhlinin, A., Vrtilek, J., Wise, M., and Zhao, P., “Chandra Observation of Abell 2142: Survival of Dense Subcluster Cores in a Merger,” ApJ 541, 542–549 (Oct. 2000).
- [4] Bîrzan, L., Rafferty, D. A., McNamara, B. R., Wise, M. W., and Nulsen, P. E. J., “A Systematic Study of Radio-induced X-Ray Cavities in Clusters, Groups, and Galaxies,” ApJ 607, 800–809 (June 2004).
- [5] Weintraub, D. A., Sandell, G., and Duncan, W. D., “Submillimeter measurements of T Tauri and FU Orionis stars,” ApJ 340, L69–L72 (May 1989).
- [6] Beckwith, S. V. W., Sargent, A. I., Chini, R. S., and Guesten, R., “A survey for circumstellar disks around young stellar objects,” AJ 99, 924–945 (1990).
- [7] Mannings, V. and Emerson, J. P., “Dust in discs around T Tauri stars: Grain growth?,” MNRAS 267, 361–378 (Mar. 1994).
- [8] Irwin, K. D. and Hilton, G. C., “Transition-Edge Sensors,” in [Cryogenic Particle Detection ], Enss, C., ed., 63–150, Berlin: Springer (2005).
- [9] Staguhn, J. G., Benford, D. J., Chervenak, J. A., Moseley, Jr., S. H., Allen, C. A., Stevenson, T. R., and Hsieh, W. T., “Design techniques for improved noise performance of superconducting transition edge sensor bolometers,” in [Millimeter and Submillimeter Detectors for Astronomy II. ], Zmuidzinas, J., Holland, W. S., and Withington, eds., Proc. SPIE 5498, 390–395 (Oct. 2004).
- [10] Benford, D. J., Dicker, S. R., Wollack, E. J., Supanich, M. P., Staguhn, J. G., Moseley, S. H., Irwin, K. D., Devlin, M. J., Chervenak, J. A., and Chen, T. C., “A planar two-dimensional superconducting bolometer array for the Green Bank Telescope,” in [Millimeter and Submillimeter Detectors for Astronomy II ], Zmuidzinas, J., Holland, W. S., and Withington, S., eds., Proc. SPIE 5498, 208–219 (Oct. 2004).
- [11] Irwin, K. D., Vale, L. R., Bergren, N. E., Deiker, S., Grossman, E. N., Hilton, G. C., Nam, S. W., Reintsema, C. D., Rudman, D. A., and Huber, M. E., “Time-division SQUID multiplexers,” Low Temperature Detectors 605, 301–304 (Feb. 2002).
- [12] Forgione, J. B., Benford, D. J., Buchanan, E. D., Moseley, S. H., Rebar, J., and Shafer, R. A., “Enhancements to a superconducting quantum interference device (SQUID) multiplexer readout and control system,” in [Millimeter and Submillimeter Detectors for Astronomy II ], Zmuidzinas, J., Holland, W. S., and Withington, S., eds., Proc. SPIE 5498, 784–795 (Oct. 2004).
- [13] Devlin, M. J., Dicker, S. R., Klein, J., and Supanich, M. P., “A high capacity completely closed-cycle 250 mK 3He refrigeration system based on a pulse tube cooler,” Cryogenics 44, 611–616 (Sept. 2004).
- [14] Dicker, S. R. and Devlin, M. J., “Millimeter wave reimaging optics for the 100 m Green Bank telescope,” Appl. Opt. 44, 5855–5858 (Oct. 2005).
- [15] Ade, P. A. R., Pisano, G., Tucker, C., and Weaver, S., “A review of metal mesh filters,” in [Millimeter and Submillimeter Detectors and Instrumentation for Astronomy III. ], Zmuidzinas, J., Holland, W. S., Withington, S., and Duncan, W. D., eds., Proc SPIE 6275 (July 2006).
- [16] Nikolic, B., Prestage, R. M., Balser, D. S., Chandler, C. J., and Hills, R. E., “Out-of-focus holography at the Green Bank Telescope,” A&A 465, 685–693 (Apr. 2007).
- [17] Battistelli, E. S., Amiri, M., Burger, B., Devlin, M. J., Dicker, S. R., Doriese, W. B., Dünner, R., Fisher, R. P., Fowler, J. W., Halpern, M., Hasselfield, M., Hilton, G. C., Hinks, A. D., Irwin, K. D., Kaul, M., Klein, J., Knotek, S., Lau, J. M., Limon, M., Marriage, T. A., Niemack, M. D., Page, L., Reintsema, C. D., Staggs, S. T., Swetz, D. S., Switzer, E. R. Thornton, R. J., and Zhao, Y., “Automated SQUID tuning procedures for kilo-pixel arrays of TES boblometers on ACT,” in [This proceedings ], (2008).