Measurement of the antiproton/proton ratio at few-TeV energies with the ARGO-YBJ experiment
Abstract
Cosmic ray antiprotons provide an important probe for the study of cosmic-ray propagation in the interstellar space and to investigate the existence of Galactic dark matter. Cosmic rays are hampered by the Moon, therefore a deficit of cosmic rays in its direction is expected (the so-called Moon shadow). The Earth-Moon system acts as a magnetic spectrometer. In fact, due to the geomagnetic field the center of the Moon shifts westward by an amount depending on the primary cosmic ray energy. Paths of primary antiprotons are therefore deflected in an opposite sense in their way to the Earth. This effect allows, in principle, the search of antiparticles in the opposite direction of the observed Moon shadow.
The ARGO-YBJ experiment, in stable data taking since November 2007 with an energy threshold of a few hundreds of GeV, is observing the Moon shadow with high statistical significance. Using about 1 year data, an upper limit of the flux ratio in the few-TeV energy region is set to a few percent with a confidence level of 90%.
ARGO-YBJ experiment, Antiproton/proton ratio measurement, TeV Dark Matter
1 Introduction
The study of cosmic ray (CR) antiprotons may present an opportunity to investigate the baryonic asymmetry of the universe and to uncover evidence for the existence of galactic dark matter. Antiprotons are anyway produced by standard nuclear interactions of CR nuclei over the interstellar medium (spallation processes). Therefore, the observation of abundance in the CR flux is a key to understanding CR propagation and provide information complementary to that provided by secondary nuclei as Li, Be and B or secondaries of iron. Unlike secondary nuclei, antiprotons are tracers primarily of the propagation history of the proton, the dominant CR component [1]. Recent measurements of the antiproton flux up to about 100 GeV [2, 3, 4] are consistent with the conventional CR model, in which antiprotons are secondary particles yielded by the spallation of CR nuclei over the interstellar medium.
Nevertheless, exotic models of primary production not ruled out by low energy measurements yet are available. Antiprotons can be produced from primordial black hole evaporation or in anti-galaxies. In some scenarios models of primary antiprotons production can provide a ratio increasing up to the 10% level in the few-TeV energy range (see the review paper by Stephen and Golden [5]).
In addition, cosmic ray antiprotons, as well as positrons, are considered as prime targets for indirect detection of galactic dark matter (see for example [6] and reference therein). As an example, some recent analyses suggest that the overall PAMELA [4, 7] and data and ATIC/PPB-BETS [8, 9] data can be reproduced taking into account a heavy DM particle (M 10 TeV) that annihilates into or [10]. This scenario implies that the ratio, consistent with the background of secondary production up to about 50 GeV, increases rapidly reaching the 10-2 level in the TeV energy region.
Linsley [11] and Lloyd-Evans [12] in 1985 independently explored the possibility to use the Moon or Sun shadows as mass spectrometer in order to measure the charge composition of cosmic ray spectrum. In particular Linsley first discussed the idea to measure the cosmic ray antiprotons abundance exploiting the separation of the proton and antiproton shadows. The geomagnetic field should deflect the antimatter component of the cosmic rays in the opposite direction with respect to the matter one. Therefore, if protons are deflected by the geomagnetic field towards east, antiprotons are deflected towards west. If the energy and the angular resolution are respectively low and small enough, we can distinguish, in principle, between two shadows, one shifted towards west due to the protons and the other shifted towards east due to the antiprotons one. At high energy ( 10 TeV) the magnetic deflection is too small compared to the angular resolution and the shadows cannot be disentangled. At low energy (100 GeV) the well separated shadows are washed out by the poor angular resolution, thus limiting the sensitivity. Therefore, there is an optimal energy window for the measurement of the antiproton abundance.
In this paper we report on the measurement of the ratio in the few-TeV energy region exploiting the observation of the galactic cosmic ray Moon shadowing effect performed by the ARGO-YBJ experiment.
2 The ARGO-YBJ experiment
The ARGO-YBJ detector, located at the YangBaJing Cosmic Ray Laboratory (Tibet, P.R. China, 4300 m a.s.l.), is the only experiment exploiting the full coverage approach at very high altitude. The detector is constituted by a central carpet 7478 m2, made of a single layer of Resistive Plate Chambers (RPCs) with 92 of active area, enclosed by a partially instrumented guard ring that extends the detector surface up to 100110 m2. The apparatus has a modular structure, the basic data acquisition element being a cluster (5.727.64 m2), namely a group of 12 RPCs (2.801.25 m2 each). Each chamber is read by 80 strips of 762 cm2 (the spatial pixel), logically organized in 10 independent pads of 5662 cm2 representing the time pixel of the detector. The RPCs are operated in streamer mode with a standard gas mixture (Argon 15%, Isobutane 10%, TetraFluoroEthane 75%), the High Voltage settled at 7.2 kV ensures an overall efficiency of about 96% [14]. The central carpet contains 130 clusters (hereafter ARGO-130) and the full detector is composed of 153 clusters for a total active surface of 6700 m2.
All events giving a number of fired pads N Ntrig in the central carpet within a time window of 420 ns are recorded. The spatial coordinates and the time of any fired pad are then used to reconstruct the position of the shower core and the arrival direction of the primary.
The ARGO-YBJ experiment started recording data with the whole central carpet in June 2006. The period until autumn 2007 has been mainly devoted to installation and debugging operations, the duty cycle being lower in that period. Since 2007 November the full detector is in stable data taking at the multiplicity trigger threshold N20 and a duty cycle : the trigger rate is about 3.6 kHz.
The reconstruction of shower parameters is split into the following steps. First the shower core position is derived with the Maximum Likelihood method from the lateral density distribution of the secondary particles. In the second step, given the shower core position, the shower axis is reconstructed by means of an iterative un-weighted planar fit being able to reject the time values belonging to the non-gaussian tails of the arrival time distributions. A conical correction with a slope fixed to = 0.03 rad is applied to the surviving hits in order to improve the angular resolution [15].
3 Monte Carlo Simulation
The air showers development in the atmosphere has been generated with the CORSIKA v. 6.500 code including the QGSJET-II.03 hadronic interaction model for primary energy above 80 GeV and the FLUKA code for lower energies [16]. Cosmic ray spectra of p, He and CNO have been simulated in the energy range from 30 GeV to 1 PeV following [17]. The relative fractions (in % of the total) after triggering by the ARGO-YBJ detector for events with N30 are: p88%, He10%, CNO2%. About 31011 showers have been distributed in the zenith angle interval 0-60 degrees. The secondary particles have been propagated down to a cut-off energy of 1 MeV. The experimental conditions have been reproduced via a GEANT3-based code. The shower core positions have been randomly sampled in an energy-dependent area up to 10103 m2, centered on the detector. Simulated events have been generated in the same format used for the experimental data and they have been analyzed by using the same reconstruction code.
A detailed Monte Carlo simulation of cosmic rays propagation in the Earth-Moon system has been developed to compare the observed displacement of the shadow with the expectations, so disentangling the effect of the geomagnetic field from a possible systematic pointing error. The algorithm is described in [18].
4 Data analysis
For the analysis of the shadowing effect a 10 10∘ sky map in celestial coordinates (right ascension and declination) with 0.10.1∘ bin size, centered on the Moon location, is filled with the detected events. The background is evaluated with the so-called time swapping method as described in [19].
To form conservative estimate of the ratio in this preliminary work the analysis refers to about 6108 events collected only during the stable operation period of data taking after the following event selection: (1) each event should fire more than 30 strips on the ARGO-130 central carpet to avoid any threshold effect; (2) the zenith angle of the event arrival direction should be less than 50∘; (3) the reconstructed core position should be inside an area 250250 m2 around the detector; (4) the reduced of the final temporal fit should be less than 100 ns2.
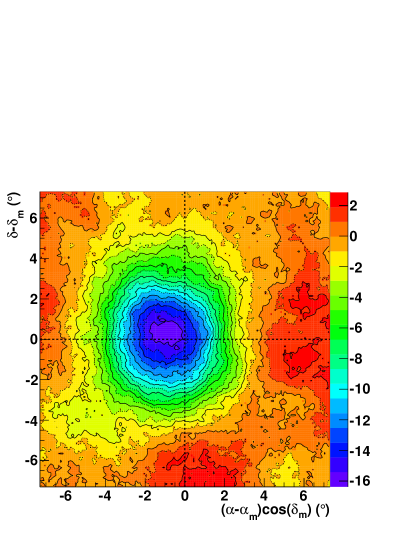
A significance map of the Moon shadow is shown in Fig. 1. It contains all the events belonging to the lowest multiplicity bin investigated (Nstrip = 30 - 60), collected by ARGO-YBJ during the period December 2007 - December 2008 (1350 hours on-source). The sensitivity of the observation is about 17 standard deviations and the Moon is shifted westward by about 1∘. This means that a potential antiproton signal is expected eastward within 1.5∘ from the actual Moon position. The median energy of selected events is E1.4 TeV (mode energy 0.30 TeV) for proton-induced showers. The corresponding angular resolution is 1.8∘ (a detailed analysis of the Moon shadowing effect is given in [19]).
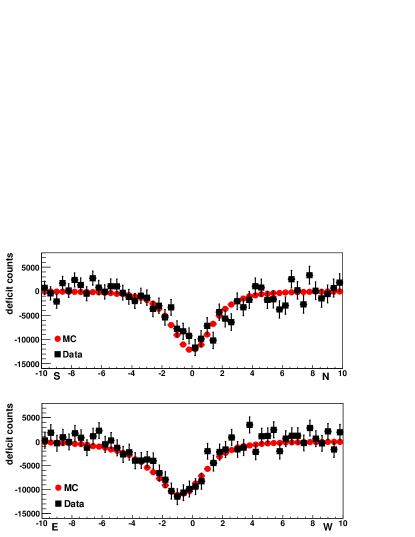
The projection along the North-South (East-West) direction of the deficit counts around the Moon is shown in the upper (lower) panel of Fig. 2 for Nstrip = 30 - 60. The vertical axis reports the events contained in an angular slice parallel to the North-South (East-West) axis and centered to the observed Moon position. The width of this band is 3.3∘. The data are in good agreement with the MC simulation and the observed shadow is shifted westward by about 1∘ (lower panel), as expected. Since at the Yangbajing latitude the effect of the geomagnetic field along the North-South direction is negligible, a nearly symmetrical and centered projection is expected. A detailed analysis of this sort of projections and of the energy calibration of the detector is given in [19]. We stress that the systematic pointing error has been taken into account in the upper limit calculations.
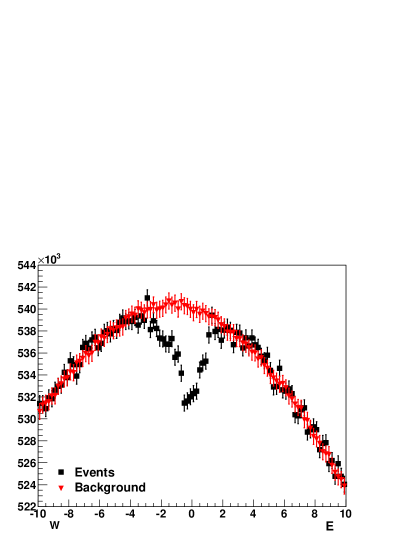
The event and background maps around the position of the Moon projected along the East-West axis for N60 are compared in Fig. 3. As can be seen, the shadow clearly appears in the event map, without any background subtraction.
5 Results and discussion
In order to evaluate the ratio, a maximum likelihood fit is performed using the content as a free parameter with following procedure:
-
1.
the Moon shadow EW projection has been drawn both for data and MC.
-
2.
the MC Moon shadow has been split into a ”matter” part plus an ”antiproton” part, in such a way that the total amount of triggered events remains unchanged:
-
3.
for each matter-to-antiproton ratio, the expected Moon shadow EW projection is compared with the experimental one via the calculation of the likelihood function:
(1) where the Ni is the number of experimental events included within the bin, while is the number of events expected within the same bin. The number is calculated by adding the contribution expected from MC () to the measured background.
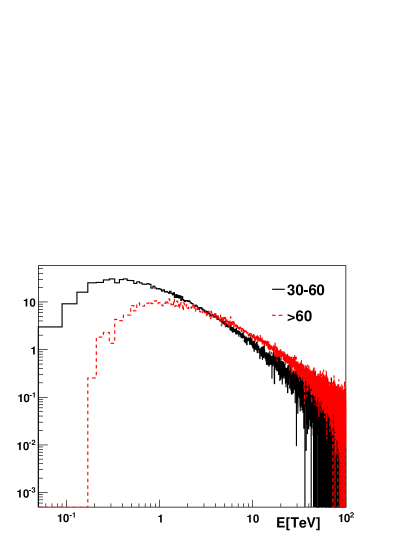
This calculation has been performed for two different multiplicity bins: Nstrip = 30 - 60 and N60. The distributions of cosmic ray primary energy contributing to these intervals are shown in Fig. 4. From the MC simulation it results that the median energy of all selected events is E50 = 1.85 TeV for Nstrip = 30 - 60 and E50 = 4.10 TeV for N60.
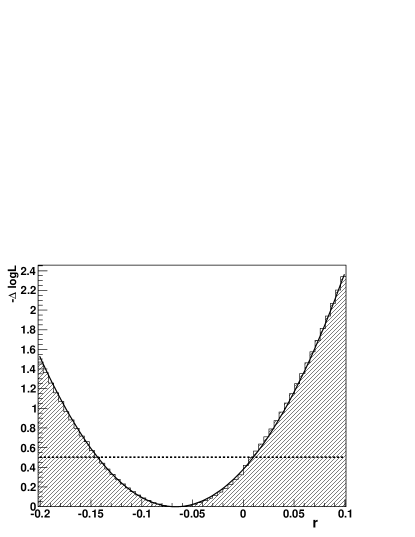
The result of this analysis is shown in Fig. 5 for Nstrip = 30 - 60 and one finds . The result is below a physical boundary (the content must be positive). An upper limit of 7.4% with 90% confidence level is set using the unified approach of Feldmann & Cousin [20] for Nstrip = 30 - 60. For higher multiplicities (N60) an upper limit of 7.4% is set with 90% c.l.. Notice that the two values are similar, in spite of the difference of the multiplicity interval. It is a consequence of the combination of the two opposing effects of the angular resolution and of the geomagnetic deviation about which we said before.
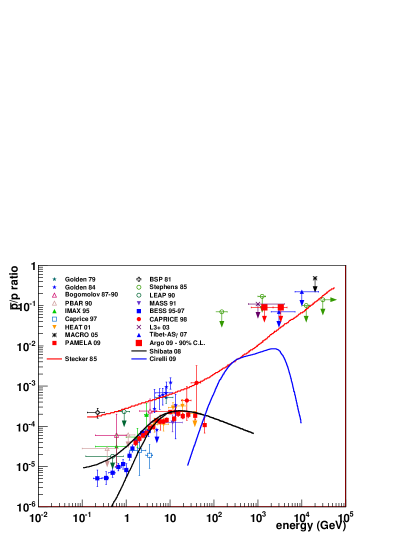
With the assumed flux composition in the few-TeV energy range of 88% protons and 12% heavier nuclei responsible of the observed deficit, these limits corresponds to a ratios of 0.09 for Nstrip = 30 - 60 with 90% c.l. and 0.09 for N 60 with 90% c.l., respectively. In Fig. 6 the ARGO-YBJ results are shown with a compilation of available measurements [21].
6 Conclusions
The ARGO-YBJ experiment, in stable data taking since November 2007 with an energy threshold of a few hundreds of GeV, is observing the Moon shadow with high statistical significance. Using about 1 year data, a preliminary upper limit of the flux ratio is set to 0.09 with a confidence level of 90% at a median energy of 1.85 and 4.10 TeV. We stress that in the few-TeV range this result is among the lowest available. In 3 years of data taking the ARGO-YBJ experiment will be able to lower this limit down to the percent level, thus excluding some of the current antiproton direct production models.
References
- [1] A.W. Strong et al., Annu. Rev. Nucl. Part. Sci. 57 (2007) 285.
- [2] A. Yamamoto et al., Nucl. Phys. B Proc. Suppl. 166B (2007) 62.
- [3] M. Boezio et al., ApJ 561 (2001) 787.
- [4] O. Adriani et al., Phys. Rev. Lett. 102 (2009) 051101.
- [5] S.A. Stephen and R.L. Golden, Space Sci. Rev. 46 (1987) 31.
- [6] F. Donato et al., Phys. Rev. Lett. 102 (2009) 071301.
- [7] O. Adriani et al., Nature 458 (2009) 607.
- [8] J. Chang et al., Nature 456 (2008) 362.
- [9] K. Yoshida et al., Adv. in Space Res. 42 (2008) 1670.
- [10] M. Cirelli et al., hep-ph/0809.2409v3 (2008) and hep-ph/0903.3381 (2009).
- [11] J. Linsley, Proc. 19th ICRC 3 (1985) 465.
- [12] J. Lloyd-Evans, Proc. 19th ICRC 2 (1985) 173.
- [13] A. Yamamoto et al., Nucl. Phys. B Proc. Suppl. 14B (1990) 223.
- [14] G. Aielli et al., NIM A562 (2006) 92.
- [15] G. Di Sciascio et al., Proc. 30th ICRC (2007) (preprint: arXiv:0710.1945).
- [16] D. Heck et al., Report FZKA 6019 (1998).
- [17] B. Wiebel-Sooth et al., A&A 330 389, 1998.
- [18] G. Di Sciascio and R. Iuppa, these proceedings.
- [19] R. Iuppa et al., these proceedings.
- [20] G. Feldman and R. Cousin, Phys. Rev. D 57 (1998) 3873.
- [21] M. Amenomori et al., Astrop. Phys. 28 (2007) 137 and reference therein.