11email: tian@mps.mpg.de 22institutetext: Department of Geophysics, Peking University, Beijing, China 33institutetext: School of Space Science and Physics, Shandong Univ. at Weihai, Weihai, Shandong, China
33email: xld@sdu.edu.cn
Network oscillations at the boundary of an equatorial coronal hole
Abstract
Aims. We investigate intensity oscillations observed simultaneously in the quiet chromosphere and in the corona, above an enhanced network area at the boundary of an equatorial coronal hole.
Methods. A Fourier analysis is applied to a sequence of images observed in the 171 Å and 1600 Å passbands of TRACE. Four interesting features above the magnetic network are further investigated by using a wavelet analysis.
Results. Our results reveal that, in both the 171 Å and 1600 Å passbands, oscillations above the magnetic network show a lack of power at high frequencies (5.0-8.3 mHz), and a significant power at low (1.3-2.0 mHz) and intermediate frequencies (2.6-4.0 mHz). The global 5-min oscillation is clearly present in the 4 analyzed features when seen in the 1600 Å passband, and is also found with enhanced power in feature 1 (leg of a large coronal loop) and feature 2 (legs of a coronal bright point loop) when seen in the 171 Å passband. Two features above an enhanced network element (feature 3 and feature 4) show repeated propagating behaviors with a dominant period of 10 minutes and 5 minutes, respectively.
Conclusions. We suggest these oscillations are likely to be slow magneto-acoustic waves propagating along inclined magnetic field lines, from the lower solar atmosphere into the corona. The energy flux carried by these waves is estimated of the order of for the 171 Å passband and is far lower than the energy required to heat the quiet corona. For the 1600 Å passband, the energy flux is about , which is about one third of the required energy budget for the chromosphere.
Key Words.:
Sun: oscillations-Sun: corona-Sun: chromosphere-Sun: UV radiation1 Introduction
The solar atmosphere is highly structured by the magnetic field. The chromospheric network, which is the upward extension of the supergranular boundaries above the photosphere, is characterized by clusters of magnetic flux concentrations (Gabriel 1976). Part of the network flux expands with height (Patsourakos et al. 1999; Tian et al. 2008a) and opens into the corona with a funnel shape, while the rest of the network consists of a dense population of low-lying loops with lengths less than km (Dowdy et al. 1986; Peter 2001).
The observation of oscillations in the chromosphere and corona can help us understand the magnetic structure of the solar atmosphere, and provides valuable insight into the unresolved coronal heating problem.
It has been shown that oscillations with different frequencies (0.6 mHz-2.7 mHz) are present in the chromospheric network (Curdt and Heinzel 1998; Lites et al. 1993; Curdt and Heinzel 1998; Cauzzi et al. 2000). McAteer et al. (2002) found waves with a period of 4-15 minutes (1-4 mHz) in the central portions of network bright points, and suggest that these waves are possibly magneto-acoustic or magneto-gravity modes. More recently, McAteer et al. (2004) found that the most frequent network oscillation has a period of 283 s, with a lifetime of 2-3 cycles in four TRACE (Transition Region and Coronal Explorer) passbands centered at 1700, 1600, 1216, and 1550 Å. The power of the intensity fluctuations in the 1600 Å passband (UV continuum at K plus Fe ii at K), which is formed at the temperature minimum (McAteer et al. 2004), is found to peak at 3-5 mHz and considered as a mixture of photospheric 5-min oscillations and chromospheric 3-min oscillations (Fossum and Carlsson 2005). The so-called ′′magnetic shadows′′, which surround magnetic network elements and show a lack of oscillatory power in the period range of 2-3 minutes, have received much attention (McIntosh and Judge 2001; Krijger et al. 2001; Vecchio et al. 2007) and have been considered to play an important role in the trapping of high-frequency magneto-acoustic oscillations (Srivastava et al. 2008).
Oscillations with different periods have also been found in different regions above the chromosphere. In the active region, 3-min oscillations have been found in the transition region and corona in sunspot regions (Fludra 1999; Brynildsen et al. 1999; De Moortel 2002), while 5-min oscillations are more likely to be found in ′′non-sunspot′′ loops (De Moortel 2002) and above AR plage (De Pontieu 2003, 2005). These oscillations are suggested to be due to upward-propagating slow magneto-acoustic waves. The 5-min oscillation is likely to be guided along inclined magnetic flux tubes, which can decrease the acoustic cutoff frequency to allow the low-frequency photospheric oscillations propagate into the outer atmosphere (De Pontieu 2004; McIntosh and Jefferies 2006; Hansteen et al. 2006). In the open-field regions, quasi-periodic perturbations with periods of 10-15 minutes (DeForest and Gurman 1998) and 10-25 minutes (Banerjee et al. 2000) have been found in polar plumes. These low-frequency perturbations are explained as compressive waves (such as sound waves or slow-mode magneto-acoustic waves) propagating along the plumes (Ofman et al. 1999). In spicules, the 5-min oscillation is also present (Xia et al. 2005), and might be driven by p-modes (De Pontieu 2004). By measuring phase delays between intensity oscillations and between velocity oscillations of different line pairs, O′Shea et al. (2007) concluded that propagating slow magneto-acoustic waves are present in coronal holes and that they occur preferentially in bright regions that are associated with magnetic field concentrations in the form of loops or bright points. Periodic oscillations (7-64 minutes) in coronal bright points have also been found by Ugarte-Urra et al. (2004a), Ugarte-Urra et al. (2004b), and Tian et al. (2008b). By using the new XRT data, Kariyappa and Varghese (2008) recently found that X-Ray bright point emission shows several significant peaks at different frequencies corresponding to time scales that range from a few minutes to hours.
In this contribution, we investigate intensity oscillations observed simultaneously in the quiet chromosphere and in the corona, above an enhanced network area at the boundary of an equatorial coronal hole.
2 Observations and data analysis
The data set analyzed here contains a sequence of images observed from 07:40 to 08:20 UTC on November 08 in 1999 in two passbands (1600 Å and 171 Å) of the TRACE instrument. The emissions of the 1600 Å and 171 Å passbands are formed in the chromosphere (at temperature minimum) and in the lower corona, respectively. The sequence of 171 Å only lasted from 07:40 to 08:12. The pixel size is for the 1600 Å images, and for the 171 Å images. Standard software for calibrating and correcting the TRACE data was applied to this data set, including removal of cosmic rays, subtraction of the dark current, normalization of the counts, and so on. We used the cross correlation technique to do the coalignment of the images in the sequence.
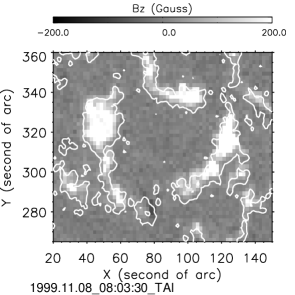
We extracted a sequence of sub-images with a size of from the original data set. The sub-images were taken around the boundary of an equatorial coronal hole above an enhanced network area. The average intensity images of the studied region in the 1600 Å and 171 Å passbands can be found in Fig. 2A and E, respectively. The chromospheric network pattern is clearly seen in the 1600 Å passband. The coronal hole and the surrounding quiet Sun can be easily discerned in the image of the 171 Å passband. Fig. 1 shows the magnetogram corresponding to the studied region.
The cadence of our TRACE data was about 30 s. At a few moments there were irregular gaps. This problem was overcome by applying a linear interpolation with the help of the INTERPOL function in the IDL software. We then created a sequence of running difference images, by subtracting each image from the image taken 30 s earlier. This sequence of running difference images was further analyzed to search for periodic signatures.
We applied a standard Fourier analysis to the sequence of running difference images of each passband. At each spatial pixel, we obtained a frequency-power curve. Then we added the total power respectively in three different frequency ranges, and calculated the percentage of this value relative to the total power in the full frequency range. In this way we obtained a relative power map in each frequency range. The three frequency ranges are 1.3-2.0 mHz (500-780 s, low frequencies), 2.6-4.0 mHz (250-384 s, intermediate frequencies), and 5.0-8.3 mHz (120-200 s, high frequencies). The power maps can be found in Fig. 2.
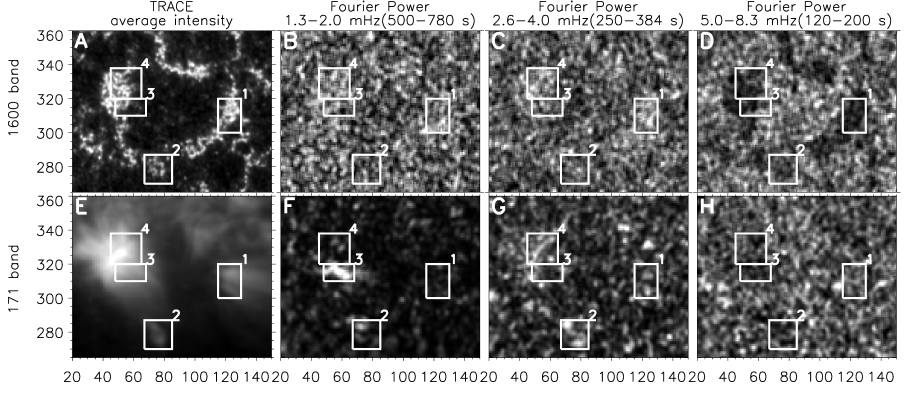
The intensity images and maps of Fourier power reveal several interesting features. We chose four features for a more detailed analysis. They are shown in Fig. 2 and outlined in white. By checking the original TRACE images and the full-disk MDI magnetogram, we found that feature 1 might be a leg of a large coronal loop, feature 2 is a coronal bright point. Feature 3 and feature 4 are above an enhanced network element and their enhanced power forms an elongated shape at low and intermediate frequencies, respectively.
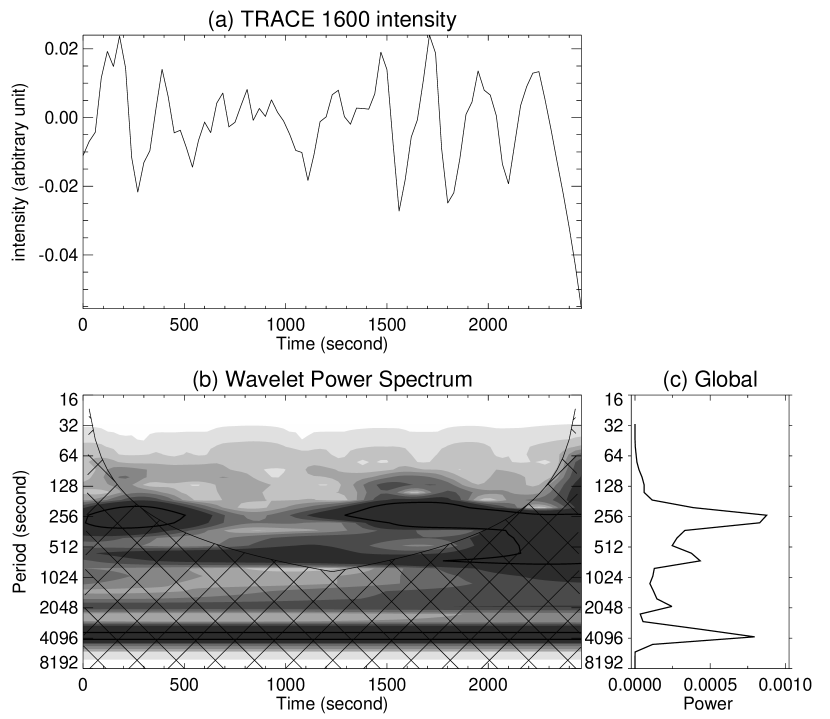
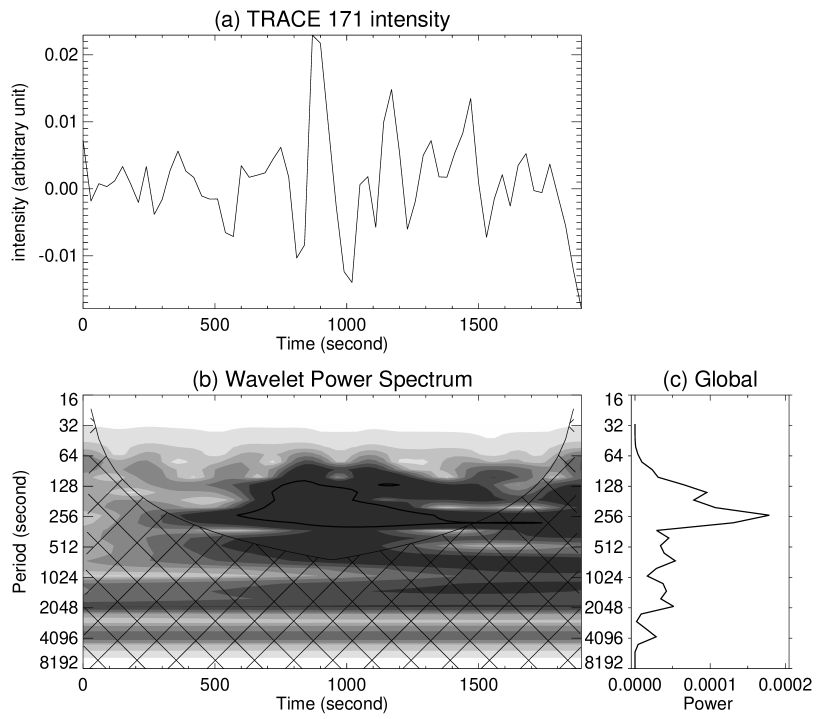
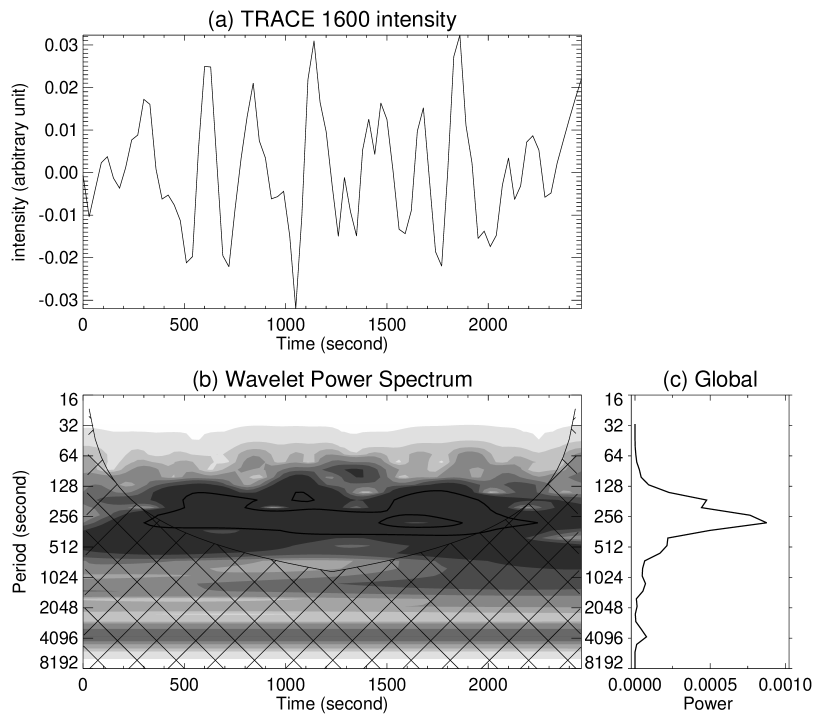
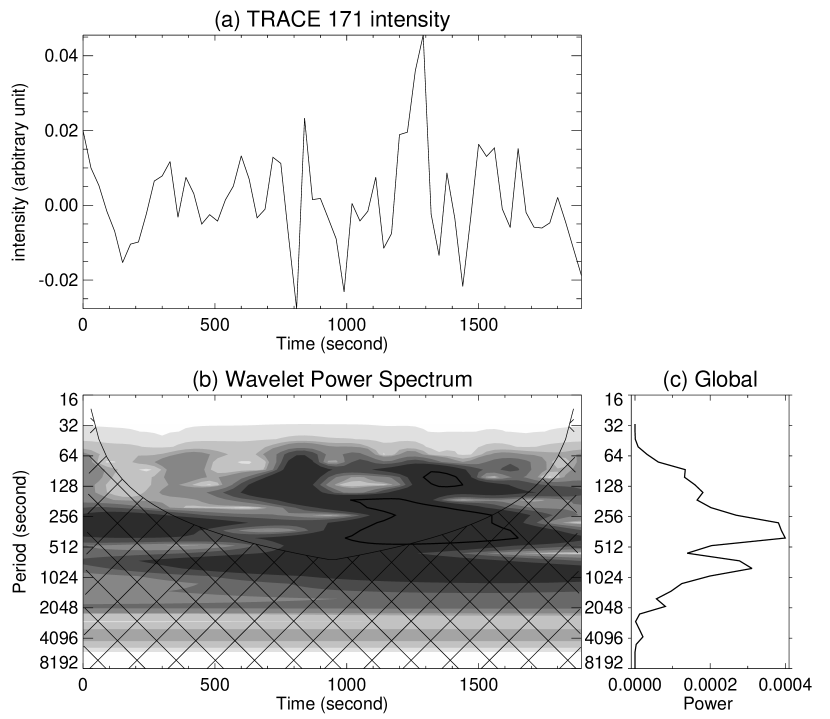
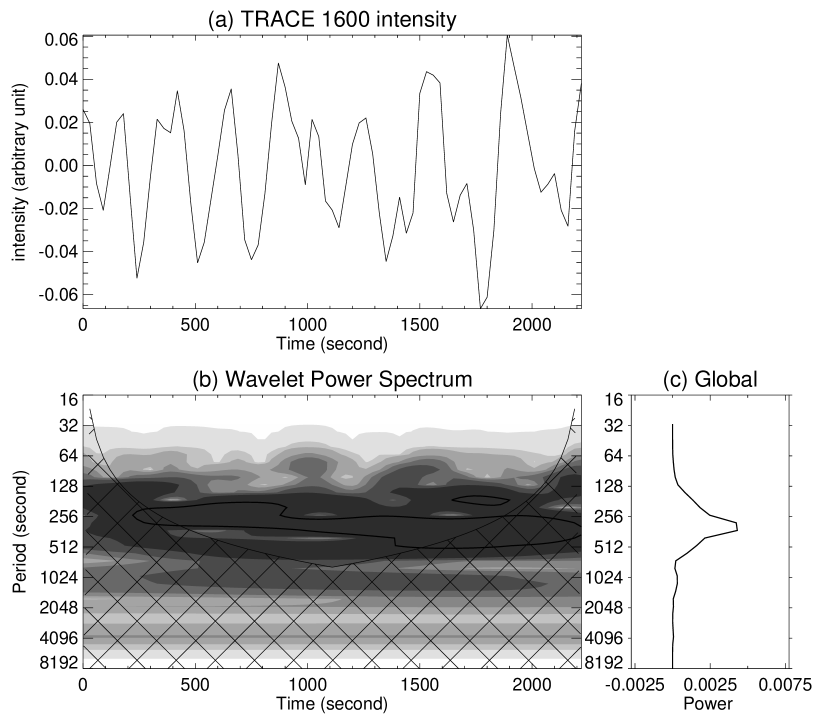
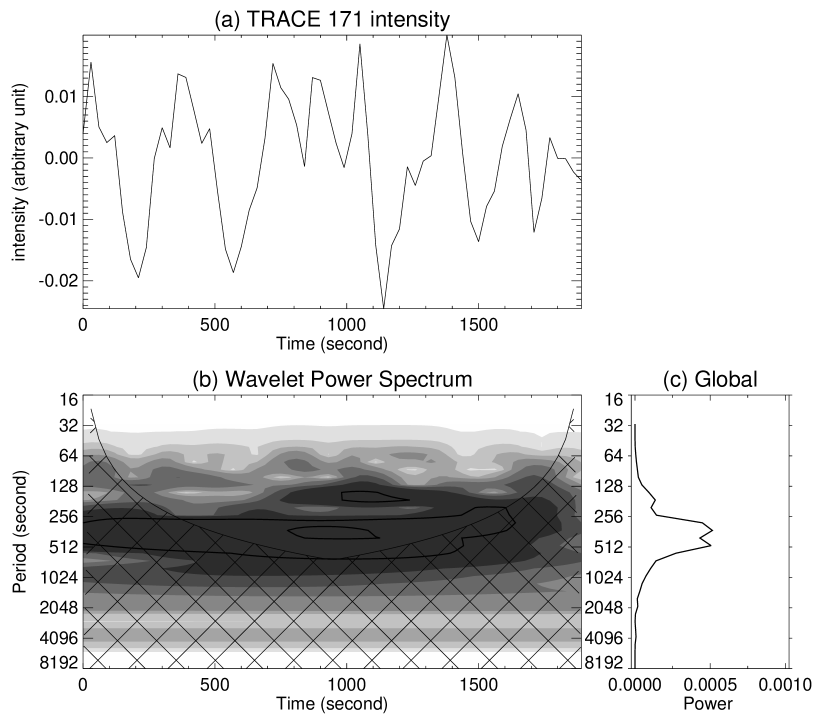
We averaged the intensity in the outlined rectangular area for each feature, and created the corresponding running difference light curve. These curves are shown in the upper panels of Fig. 4 to Fig. 7. Then we applied a Fourier analysis and a wavelet analysis to each running difference light curve. The Fourier spectra are shown in Fig. 3. The solid and dashed curves correspond to the power of the 1600 Å and 171 Å passband, respectively.

The localized nature of the wavelet transform allows us to study the duration of any statistically significant oscillations as well as their period (Banerjee et al. 2000). By decomposing a time series into time-frequency space, one is able to determine both the dominant modes of variability and how those modes vary in time (Torrence and Compo 1998). Here we also performed a wavelet analysis for the running difference light curves of the four features, in order to find the most reliable periods. We chose the Morlet wavelet function, defined as a sine wave modulated by a Gaussian window, for our analysis. The wavelet transform suffers from edge effect at both ends of the time series. And this effect is important in regions defined as the ′′cone of influence′′ (COI). To check whether the periodic signatures present in the wavelet spectrum are real or not, we have to perform a significance test. Here we chose a confidence level of 95%. The description of the wavelet function, COI, and significance test can be found in Torrence and Compo (1998).
The wavelet power spectra of the four features are shown in Fig. 4 to Fig. 7. Cross-hatched regions indicate the ′′cone of influence′′. The darker parts represent higher power, and the contours correspond to the 95% confidence level. We also averaged each wavelet power spectrum over time and plotted the global wavelet spectrum.
3 Results and discussion
The main motivation of this work is to search for the signature of oscillations at the boundary of an equatorial coronal hole, and to study oscillations observed almost simultaneously in the chromosphere and corona above the magnetic network. The Fourier and wavelet analyses show that obvious oscillations really exist in our data.
Fig. 2B-D show the maps of Fourier power in different frequency ranges in the 1600 Å passband. It is very clear that the network oscillations reveal a lack of power at high frequencies, and a significant power at low and intermediate frequencies. The reason why the power at high frequencies in the internetwork region is stronger than that in the network lane might be a result of the network magnetic structure. It is known that part of the network flux expands with height and opens into the corona(Dowdy et al. 1986; Peter 2001; Patsourakos et al. 1999; Tian et al. 2008a). Thus, photospheric oscillations with frequencies above the acoustic cutoff (about 5.5 mHz) can propagate into the chromosphere, where the network fluxes begin to stretch into the region above the internetwork in the shape of canopies (Srivastava et al. 2008). Below the canopy field, magnetic shadows with reduced oscillatory power at high frequencies are present within and immediately around the magnetic network (Vecchio et al. 2007). But the significant power (seen in Ca ii 854.2 nm) directly above the magnetic network in Vecchio et al. (2007) is not very clear in our data set, which might be due to the different formation height between Ca ii and the 1600 Å passband of TRACE, or due to the relatively low spatial resolution of our data set.
The result of a significant power at low and intermediate frequencies might be explained as a leakage of low-frequency photospheric oscillations into the chromosphere through ′′magneto-acoustic portals′′ which are positioned within the network. It might provide a significant energy source to heat the quiet chromosphere (Jefferies et al. 2006; Vecchio et al. 2007).
As for the power maps of the 171 Å passband, we can make a similar conclusion to that of the 1600 Å passband. But the significant powers at low and intermediate frequencies are more constricted and isolated in the network lane. Also, the regions with reduced power at high frequencies are not so prominent and are more diffused. It might be a natural result of the diffusion and expansion of the magnetic structure from the chromosphere to the corona.
As we stated above, feature 1 corresponds to a leg of a large coronal loop system. Fig. 2C and Fig. 2G reveal a significant power at intermediate frequencies in this loop leg, both in the 1600 Å and 171 Å passbands. The period corresponding to these frequencies is around 5 minutes. Although oscillations with periods 180-420 s have already been reported by De Moortel (2000), it is still very interesting to note that in feature 1 the two bright dots seen in Fig. 2G correspond exactly to the two parts of the loop leg seen in Fig. 2E. This result indicates that in a loop system, the strongest power of the 5-min oscillation locates at the lower part of the leg. As discussed in De Moortel (2000), the 5-min oscillation might be due to the propagating slow magneto-acoustic waves. From Fig. 3 and Fig. 4, we find that the power peak around 5 minutes is clearly present at most of the time. There is a weak peak at 10 minutes for the Fourier spectra in both the 1600 Å and 171 Å passbands, but not significant in the wavelet power spectra.
Feature 2 corresponds to a coronal bright point, which is characterized by an enhanced coronal emission associated with bipolar magnetic field. Ugarte-Urra et al. (2004a) and Ugarte-Urra et al. (2004b) studied periodic oscillations of coronal bright points, and found oscillations with a period of 400-1100 s. Longer period (8-64 minutes) oscillations were also detected by Tian et al. (2008b). Here from Fig. 3 and Fig. 5 we find that the oscillatory power of this bright point has a major peak around 5 minutes, and a second peak around 3 minutes. If we compare Fig. 2E and Fig. 2G, we can find that the strongest power of feature 2 corresponds to the two parts of the bright emission. These two parts might be the two legs of the loop system associated with the bright point.
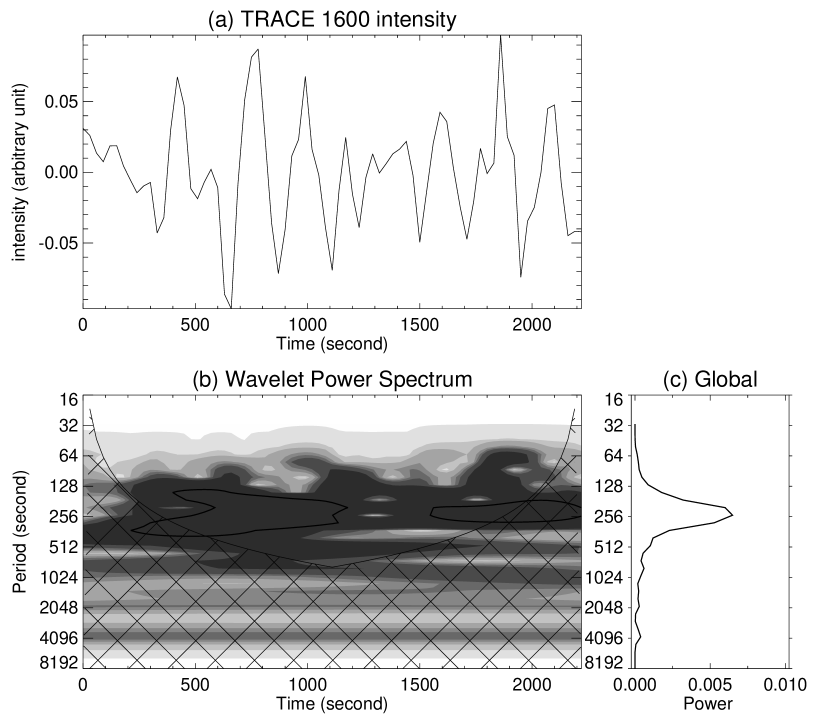
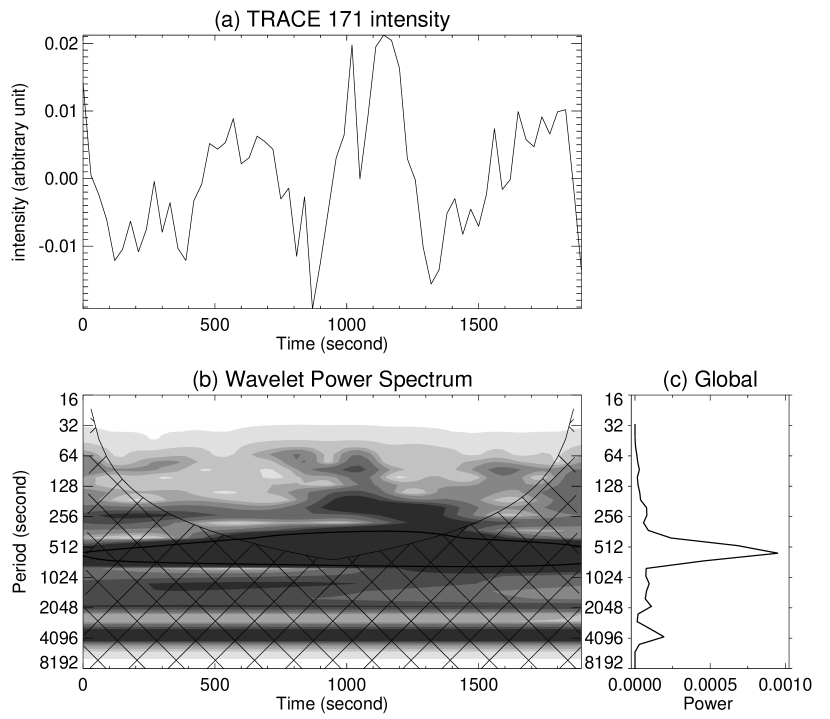
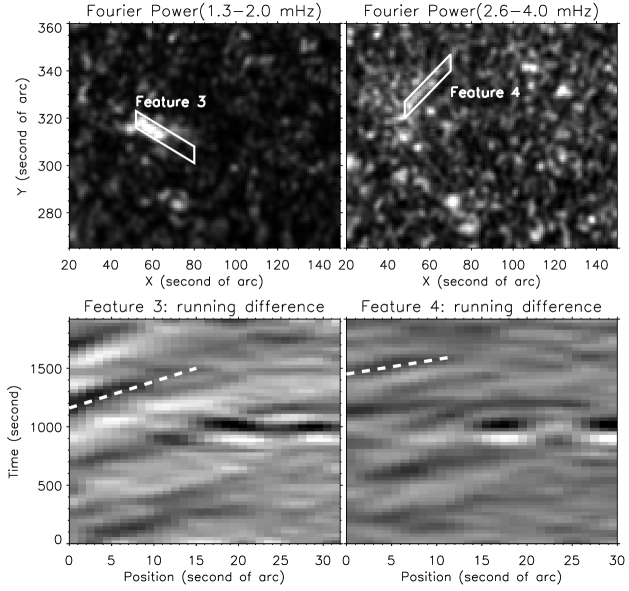
Feature 3 locates above the outer part of an enhanced network element. The most interesting point is that the enhanced Fourier power at low frequencies has an obvious elongated shape in the 171 Å passband. The movie of the image sequence clearly reveals that a periodic motion is present in this region, and the direction of this motion is exactly along this elongated shape. The Fourier and wavelet analyses both reveal a 10-min oscillation in the 171 Å passband. This oscillation is present in the entire duration of the time series, which can be seen in Fig. 6. While in the 1600 Å passband, the Fourier spectrum shows three peaks at 3, 5, and 10 minutes. However, only the 3-min and 5-min oscillations are considered as significant in the wavelet power spectrum. It has been known that strongly inclined magnetic fields can significantly decrease the acoustic cut-off frequency (De Pontieu 2004; McIntosh and Jefferies 2006; Hansteen et al. 2006), and thus allow high-frequency photospheric oscillations (above the acoustic cut-off frequency 5.5 mHz) to propagate into the chromosphere and corona. Fig. 2E gives us the impression that the magnetic field of feature 3 seems to be strongly inclined, and thus is very likely to guide the high-frequency oscillations from the lower part of the solar atmosphere to the corona. The weak peak at 10 minutes in the Fourier spectrum of the 1600 Å passband, although not prominent in the wavelet spectrum, might still be the counterpart of the dominant 10-min oscillation seen in the 171 Å passband.
As for feature 4, which is above the same enhanced network element as feature 3 but in a different location, the power peak around 5 minutes is also clear in both the Fourier and the wavelet spectra for each bandpass. From Fig. 7 we can see that in the 1600 Å passband the period is initially around 4 minutes, then increases to about 6 minutes in the second half of the duration. In the 171 Å passband, a period of 5-8 minutes is present through almost the entire duration. The strong power of the 5-min oscillation also seems to form an elongated shape in the 171 Å passband shown in Fig. 2G. A periodic motion is also present along this elongated direction when seen in the movie of the image sequence.
The propagation speeds can be estimated if we plot the running difference along the long side of the bars shown in the upper panels of Fig. 8, which indicate the directions of the propagating 10-min oscillation in feature 3 and 5-min oscillation in feature 4 in the 171 Å passband. These plots are demonstrated in the low panels of Fig. 8. The slope of the dashed line provides an estimate of the propagating speed, which is about 32 km/s for the 10-min oscillation, and 58 km/s for the 5-min oscillation. These values are lower than the propagating speed of the slow magneto-acoustic waves derived by De Moortel (2000) and DeForest and Gurman (1998), which are approximately 70-165 km/s at a bright loop-footpoint and 75-150 km/s in polar plumes, respectively. However, taking into account the line-of-sight effect of the measured propagating speed, our values are still of the order of the coronal sound speed, which is about 150 km/s (De Moortel 2000). Since oscillations are essentially velocity perturbations and do not reveal themselves in intensity fluctuations, our periodic propagating signatures are most likely to be slow magneto-acoustic waves.
Here we will roughly estimate the energy flux carried by these waves. We simply take the relationship in Sakurai et al. (2002):
| (1) |
where , , and are intensity fluctuation, density fluctuation, wave velocity amplitude, and sound speed, respectively. In our data, we found a value of about 0.015 for . Given the sound speed of 150 km/s at the formation temperature of the 171 Å passband, we can calculate the wave velocity amplitude as 1.05 km/s. Following Ofman et al. (1999), the energy flux carried by slow magneto-acoustic waves can be calculated in the following way:
| (2) |
where and represent energy flux and density, respectively. By using (De Moortel 2000) and substituting the values of and , we obtained an energy flux of about for the propagating oscillations. These values are much lower than the required heat input to the quiet corona, which is about in Withbroe and Noyes (1977). Thus, these waves are not appropriate candidates for coronal heating.
For the chromospheric oscillation, if we take the value of 0.04 for and the sound speed of 16 km/s at the formation temperature of the 1600 Å passband, we can calculate the wave velocity amplitude as 0.32 km/s by using Equation 1. Given a particle number density of at the temperature minimum (Peter 2004), we can calculate the proton mass density . By substituting the values of , , and in the chromosphere to Equation 2, we obtain a value of for the energy flux carried by the waves at the emission height of the 1600 Å passband. This value is very close to that estimated by Jefferies et al. (2006) and is almost one third of the required energy budget for the chromosphere. Thus, our results support the conclusion in Jefferies et al. (2006) that low-frequency magnetoacoustic waves provide a significant source of energy for balancing the radiative losses of the ambient solar chromosphere.
Finally, we have to point out that the relatively short length (low amount) of data restricts our discussion and lowers the solidness of the results. In order to fully understand network oscillations at boundaries of equatorial coronal holes, deep investigation to more data sets is required in the future.
4 Summary and conclusion
With the help of Fourier and wavelet analyses, we studied intensity oscillations observed simultaneously in the quiet chromosphere and corona, above an enhanced network area at the boundary of an equatorial coronal hole.
Images of Fourier power reveal that, oscillations above the magnetic network show a lack of power at high frequencies (5.0-8.3 mHz), and a significant power at low (1.3-2.0 mHz) and intermediate frequencies (2.6-4.0 mHz) in both the 171 Å and 1600 Å passbands. The former result suggests that ′′magnetic shadows′′ not only exist in the chromosphere, but also extend into the lower corona. The latter result supports the concept of ′′magneto-acoustic portals′′ within the network through which low-frequency photospheric oscillations can propagate into the chromosphere and corona.
We also studied 4 interesting features in more detail. The global 5-min oscillation is clearly present in all of the 4 analyzed features when seen in the 1600 Å passband, and is also found with enhanced power in feature 1 (leg of a large coronal loop) and feature 2 (legs of a coronal bright point loop) when seen in the 171 Å passband. Two features above an enhanced network element (feature 3 and feature 4) show repeated propagating behaviors with a dominant period of 10 minutes and 5 minutes, respectively. The derived values of the propagating speed are of the order of the coronal sound speed. These velocities, together with the compressional nature of the oscillation, suggest that our periodic propagating signatures are most likely to be slow magneto-acoustic waves.
We calculated the energy flux carried by these waves and found a value of about for the 171 Å passband, which is only a small fraction of the total energy required to heat the quiet corona. However, for the 1600 Å passband, the energy flux is about , which is of the order of the required energy budget for the chromosphere.
Acknowledgements.
The TRACE satellite is a NASA Small Explorer that images the solar photosphere, transition region and corona with unprecedented spatial resolution and temporal continuity. We thank C. Torrence and G. P. Compo for providing the Wavelet software, which is available at URL: http://paos.colorado.edu/research/wavelets/. We also thank Dr. Zhi Xu for the helpful discussion on the related topics and the anonymous referee for his/her careful reading of the paper and for the comments and suggestions. The work of H. Tian′s team at PKU is supported by the National Natural Science Foundation of China(NSFC) under contracts 40574078 and 40436015. H. Tian is now supported by China Scholarship Council for his stay in Germany. L.-D. Xia is supported by NSFC under Grant 40574064 and the Programme for New Century Excellent Talents in University (NCET).References
- Banerjee et al. (2000) Banerjee, D., O′Shea, E., & Doyle, J. G. 2000, Sol. Phys., 196, 63
- Brynildsen et al. (1999) Brynildsen, N., Kjeldseth-Moe, K., Maltby, P., & Wilhelm, K. 1999, ApJ, 517, L159
- Cauzzi et al. (2000) Cauzzi, G., Falchi, A., & Falciani, R. 2000, A&A, 357, 1093
- Curdt and Heinzel (1998) Curdt, W., & Heinzel, P. 1998, ApJ, 503, L95
- Damé et al. (1984) Damé, L., Gouttebroze, P., & Malherbe, J.-M. 1984, A&A, 130, 331
- DeForest and Gurman (1998) DeForest, C. E., & Gurman, J. B. 1998, ApJ, 501, L217
- De Moortel (2000) De Moortel, I., Ireland, J., & Walsh, R. W. 2000, A&A, 355, L23
- De Moortel (2002) De Moortel, I., Ireland, J., Hood, A. W., & Walsh, R. W. 2002, A&A, 387, L13
- De Pontieu (2003) De Pontieu, B., Erdélyi, R., & De Wijn, A. G. 2003, ApJ, 595, L63
- De Pontieu (2005) De Pontieu, B., Erdélyi, R., & De Moortel, I. D. 2005, ApJ, 624, L61
- De Pontieu (2004) De Pontieu, B., Erdélyi, R., & James, S. P. 2004, Nature, 430, 536
- Dowdy et al. (1986) Dowdy, J. F. Jr., Rabin, D., & Moore, R. L. 1986, Sol. Phys., 105, 35
- Doyle (2006) Doyle, J. G., Popescu, M. D., & Taroyan, Y. 2006, A&A, 446, 327
- Fossum and Carlsson (2005) Fossum, A., and Carlsson, M. 2005, Nature, 435, 16
- Fludra (1999) Fludra, A. 1999, A&A, 344, L75.
- Gabriel (1976) Gabriel, A. H. 1976, Philos. Trans. R. Soc. London A, 28l, 575
- Hansteen et al. (2006) Hansteen, V. H., De Pontieu, B., Rouppe van der Voort, L., van Noort, M., & Carlsson, M. 2006, ApJ, 647, L73
- Jefferies et al. (2006) Jefferies, S. M., McIntosh, S. W., Armstrong, J. D., et al. 2006, ApJ, 648, L151
- Kariyappa and Varghese (2008) Kariyappa, R. and Varghese, B. A. 2008, A&A, 485, 289
- Krijger et al. (2001) Krijger, J. M., Rutten, R. J., Lites, B. W., et al. 2001, A&A, 379, 1052
- Lites et al. (1993) Lites, B. W., Rutten, R. J., & Kalkofen, W. 1993, ApJ, 414, 345
- McAteer et al. (2002) McAteer, R. T. J., Gallagher, P. T.,Williams, D. R., et al. 2002, ApJ, 567, L165
- McAteer et al. (2004) McAteer, R. T. J., Gallagher, P. T., Bloomfield, D. S., et al. 2004, ApJ, 602, 436
- McIntosh and Judge (2001) McIntosh, S. W., & Judge, P. G. 2001, ApJ, 561, 420
- McIntosh and Jefferies (2006) McIntosh, S. W., & Jefferies, S. M. 2006, ApJ, 647, L77
- Ofman et al. (1999) Ofman, L., Nakariakov, V. M., & DeForest, C. E. 1999, ApJ, 514, 441
- O′Shea et al. (2007) O′Shea, E., Banerjee, D., & Doyle, J. G. 2007, A&A, 463, 713
- Patsourakos et al. (1999) Patsourakos, S., Vial, J.-C., Gabriel, A. H., & Bellamine, N. 1999, ApJ, 522, 540
- Peter (2001) Peter, H. 2001, A&A, 374,1108
- Peter (2004) Peter, H. 2004, Reviews in Modern Astronomy, 17, 87
- Popescu et al. (2005) Popescu, M. D., Banerjee, D., O′Shea, Doyle, J. G., & Xia, L. D. 2005, A&A, 442, 1087
- Sakurai et al. (2002) Sakurai, T., Ichimoto, K., Raju, K.P., & Singh, J. 2002, Sol. Phys., 209, 265
- Srivastava et al. (2008) Srivastava, A. K., Kuridze, D., Zaqarashvili, T. V.,& Dwivedi, B. N. 2008, A&A, 481, L95
- Tian et al. (2008a) Tian, H., Marsch, E., Tu, C.-Y., Xia, L.-D.,& He, J.-S. 2008a, A&A, 482, 267
- Tian et al. (2008b) Tian, H., Xia, L.-D.,& Li, S. 2008b, A&A, in press
- Torrence and Compo (1998) Torrence, C., & Compo, G.P., 1998. Bull. Amer. Meteor. Soc. 79, 61
- Ugarte-Urra et al. (2004a) Ugarte-Urra, I., Doyle, J. G., Madjarska, M. S., & O′Shea, E. 2004a, A&A, 418, 313
- Ugarte-Urra et al. (2004b) Ugarte-Urra, I., Doyle, J. G., Madjarska, M. S., & Foley, C. R. 2004b, A&A, 425, 1083
- Vecchio et al. (2007) Vecchio, A., Cauzzi, G., Reardon, K. P.,Janssen, K.,& Rimmele, T. 2007, A&A, 461, L1
- Withbroe and Noyes (1977) Withbroe, G. L. and Noyes, R. W. 1977, Ann. Rev. Astron. Astrophys. 15, 363
- Xia et al. (2005) Xia, L.-D., Popescu, M.D., Doyle, J.G., Giannikakis, J., 2005, A&A, 438, 1115