Swift Observations of Hard X-ray Emitting White Dwarfs in Symbiotic Stars
Abstract
The X-ray emission from most accreting white dwarfs (WDs) in symbiotic binary stars is quite soft. Several symbiotic WDs, however, produce strong X-ray emission at energies greater than keV. The Swift BAT instrument has detected hard X-ray emission from 4 such accreting WDs in symbiotic stars: RT Cru, T CrB, CD 57 3057, and CH Cyg. In one case (RT Cru), Swift detected X-rays out to greater than 50 keV at a confidence level. Combining data from the XRT and BAT detectors, we find that the 0.3-150 keV spectra of RT Cru, T CrB, and CD 57 3057 are well described by emission from a single-temperature, optically thin thermal plasma, plus an unresolved 6.4-6.9 keV Fe line complex. The X-ray spectrum of CH Cyg contains an additional bright soft component. For all 4 systems, the spectra suffer high levels of absorption from material that both fully and partially covers the source of hard X-rays. The XRT data did not show any of the rapid, periodic variations that one would expect if the X-ray emission were due to accretion onto a rotating, highly magnetized WD. The X-rays were thus more likely from the accretion-disk boundary layer around a massive, non-magnetic WD in each binary. The X-ray emission from RT Cru varied on timescales of a few days. This variability is consistent with being due to changes in the absorber that partially covers the source, suggesting localized absorption from a clumpy medium moving into the line of sight. The X-ray emission from CD 57 3057 and T CrB also varied during the 9 months of Swift observations, in a manner that was also consistent with variable absorption.
Subject headings:
stars: symbiotic — stars: individual (RT Cru, CH Cyg, CH Cyg, CD 57 3057)1. Introduction
To an optical astronomer, a symbiotic star is a red giant with an additional hot blue spectral component and emission lines. In most cases, the blue component is produced by an accreting white dwarf (WD), making symbiotic stars cousins of cataclysmic variables (CVs; in which a WD accretes from a Roche-lobe filling, late-type dwarf). In the soft X-ray regime, many symbiotic stars have been detected with ROSAT (Mürset et al., 1997). Mürset et al. (1997) found that some symbiotics could be classified as super-soft X-ray sources, in which the spectrum is approximately that of a blackbody with eV and the emission emanates from the photosphere of a hot WD with surface nuclear shell burning (Kahabka & van den Heuvel, 1997). For others, Mürset et al. (1997) fitted the spectra with optically thin thermal plasma models and found temperatures of K. They suggested that the emitting plasma was heated by the collision of the slow, dense wind from the M giant and the faster (1000 km s-1) wind from the accreting WD.
In this paper, we report on Swift (Gehrels et al., 2004) observations of 4 WD symbiotics that have been detected by the Swift Burst Alert Telescope (BAT, Barthelmy et al. 2005) at energies above keV: RT Cru, T CrB, CD 57 3057 (sometimes referred to as SS73 17), and CH Cyg. Although we have published preliminary reports on the detection of these BAT sources and the subsequent identification with symbiotic stars, here we present the first spectral and temporal analysis of the BAT data on these symbiotic stars. These observations reveal a new type of X-ray emission from WD symbiotics, since the extrapolation of super-soft and colliding-wind emission falls far short of the Swift BAT detections. After presenting the BAT survey data in §2 and the pointed Swift X-Ray Telescope (XRT, Burrows et al. 2005) observations and data analysis in §3 and §4, respectively, we summarize the combined XRT and BAT results in §5. In §6, we consider the origin of the hard X-rays in these 4 symbiotic stars through comparison with hard X-ray emission from CVs.
2. Symbiotic Star Identifications and BAT Results
All BAT data in this paper derive from the 9-month BAT survey described by Markwardt et al. (2005). In this survey, BAT data were collected with a nominal 5-minute sampling frequency. The data retained their full spatial and energy resolution. The data were filtered to remove any contamination from high detector background rates due to South Atlantic Anomaly radiation, bad spacecraft pointing, and electronics noise in the BAT detectors. To flat-field the images, the contributions from known bright sources and smooth variations due to sky background were subtracted. Sky images were then produced using a cross-correlation technique (e.g. Skinner et al. 1987). Finally, individual images were combined into an all-sky mosaic, weighted by the image noise level. These mosaics were then searched for excesses in each energy band, and a catalog of sources produced. To accurately identify BAT survey sources, a pointed observation with the Swift narrow field instruments was typically also obtained. Four WD symbiotics were detected in the BAT survey; we list their positions and count rates in Table LABEL:ta:batdet.
RT Cru was detected in hard X-rays by the INTEGRAL mission as IGR J123496434 (Bird et al., 2007; Masetti et al., 2005). Tueller et al. (2005c) confirmed the source identification with a Swift/XRT observation of the BAT survey source SWIFT J1234.76433. The presence of various optical emission lines superimposed on an M giant continuum, as well as a UV excess, indicates that RT Cru is a symbiotic star (Cieslinski et al., 1994). Cieslinski et al. (1994) further noted 0.03–0.05 mag optical flickering with time scales of 10–30 minutes in the V band, a characteristic that RT Cru shares with a subset of symbiotic stars, including CH Cyg, T CrB, Mira AB ( Ceti), MWC 560 and RS Oph (Sokoloski et al., 2001).
T CrB was detected in the BAT survey as SWIFT J1559.5+2553. Subsequent observations with the Swift/XRT confirmed that this hard X-ray source was associated with the symbiotic star T CrB (Tueller et al., 2005a, b). T CrB is a recurrent nova (with eruptions in 1866, 1946) and has an orbital period of 227.6 days (Kraft, 1958). For a recent study of its rapid variability, see Zamanov et al. (2004).
CD 57 3057 was detected in the Swift/BAT survey as SWIFT J1010.15747 (Tueller et al., 2005a, b). It was also detected by the IBIS instrument on INTEGRAL (Revnivtsev et al., 2006; Bird et al., 2007). Masetti et al. (2006) suggested CD 57 3057 as the likely optical counterpart of the hard X-ray source. Sanduleak & Stephenson (1973) made the original determination that CD 57 3057 is a symbiotic star, and Pereira et al. (2003) performed additional studies. Smith et al. (2008) reported on X-ray observations of this source with Suzaku.
CH Cyg is the only object of the 4 that has been well studied in the traditional X-ray band (e.g. Ezuka et al. 1998; Mukai et al. 2007; Galloway & Sokoloski 2004; Karovska et al. 2007). With a distance of 24540 pc (from the Hipparcos parallax; Perryman et al., 1997), it is one of the nearest symbiotic stars. Of the two known photometric periods, the 756-day period is thought to be due to pulsation of the M giant (Schmidt et al., 2006), and the 14.5-year period is probably the orbital period. CH Cyg was detected in the BAT survey.
| Source | kT | (dof) | Photon Index | (dof) | 15-150 keV Flux |
|---|---|---|---|---|---|
| (keV) | (erg/s/cm2) | ||||
| RT Cru | 0.27(2) | 2.56(2) | |||
| T CrB | 0.48(2) | 1.42(2) | |||
| CH Cyg | 0.80(2) | 0.88(2) | |||
| CD 57 3057 | 0.93(2) | 1.91(2) |
NOTE.— All errors are quoted at 90% confidence.
The BAT detected all 4 sources at energies above 24 keV, with RT Cru detected above 50 keV with a confidence level of greater than . Fitting the 4 channel BAT survey spectra to a simple bremsstrahlung model suggests that this hard emission is due to the presence of high-temperature plasma ( 15–30 keV for RT Cru, T CrB, and CD 57 3057, and keV for CH Cyg). Table 1 lists parameters of the fits to the BAT spectra for each source. Although the BAT spectra are not of high enough quality to make a strong statement about the hard X-ray emission mechanism, the lower values for the bremsstrahlung model fits compared to a power-law model suggest that the bremsstrahlung model is preferred.

Each source varied during the 9-month BAT survey. Figure 1 shows the BAT survey light curves of these 4 symbiotic stars during 2005, binned with approximately 30-day time bins. Although there are no obvious periodicities in the BAT light curves, fits to a constant model produced large values of reduced (, where is the number of degrees of freedom; in this case ranged from 3.5 to 8.0 and ). The hard X-ray flux from CH Cyg shows a clear decay to almost zero, which is consistent with the low flux seen in 2006 with Suzaku (Mukai et al., 2007). In 2000, INTEGRAL measured a 10–50 keV flux of 3.4 ergs cm-2s-1 for RT Cru (Chernyakova et al., 2005), which is substantially brighter than seen in the BAT measurements, indicating a dramatic X-ray variability over the 5 years previous to the BAT measurements.
3. Pointed Swift Observations
As part of a program to use Swift narrow-field instruments to identify the counterparts of new hard X-ray sources from the BAT All Sky Survey (Markwardt et al., 2005), Swift performed pointed observations of T CrB, CH Cyg, and CD 57 3057. RT Cru was initially observed to determine whether it was the X-ray counterpart to INTEGRAL source IGR J123496434. After the soft X-ray and optical counterparts to each of the 4 new hard X-ray source had been identified, Swift performed additional observations to obtain more detailed timing and spectral information. A log of these observations are presented in Table 2.
For all pointed observations, the XRT was in “Auto” state, in which the data collection mode is automatically chosen, based on the brightness of the source, to minimize the effects of pile-up. The two main modes of observing with the XRT are “Photon Counting” (PC) and “Window Timing” (WT) modes (Hill et al., 2005). PC mode provides full-field imaging and spectroscopy, with low temporal resolution (2.5 s). WT mode provides higher temporal resolution (1.8 ms) at the expense of imaging. The RT Cru, T CrB, and CD 57 3057 observations were taken exclusively in PC mode. For CH Cyg, the one pointed observation was performed in a mixture of WT and PC modes. Since the XRT has only a thin optical blocking filter, however, the PC-mode data for CH Cyg were severely contaminated by optical loading on the XRT CCD from the bright M giant. When CH Cyg was observed in PC mode, the data from all but the wings of the XRT point spread function were therefore effectively useless. The faster-exposure WT-mode data for CH Cyg were less affected by optical contamination and therefore suitable for spectral analysis.
4. Data Analysis
We used the Swift Release 2.5 software111http://swift.gsfc.nasa.gov/docs/software/lheasoft/ to analyze the data, and we reduced the XRT data in the standard fashion with xrtpipeline. We determined the coordinates for XRT point sources with xrtcentroid, and performed all timing and spectral analyses with counts extracted from a circular region with a 20-pixel radius around the centroid of the XRT point source. A region with this radius contains approximately 99% of all counts expected from an XRT point source. To correct for the presence of dead columns on the XRT CCD during timing analysis of XRT data, we used the standard tool xrtlcorr. For spectral fitting, we used XSPEC v12.3.0 (Arnaud, 1996) and the version-9 XRT calibration products. We performed simultaneous fits to the spectra from the cumulative XRT observations and those from the 9-month BAT survey observations for each source. Combining the XRT and BAT data allowed us to fit spectra spanning 0.3 to 150 keV.
5. Results
5.1. Timing analysis
To search for periodic brightness modulations arising from the WD spin, we performed timing analysis on barycentrically corrected XRT event data for all 4 symbiotic stars. Since WD spin periods typically lie in the range from minutes to a few hours, we calculated the statistic (e.g., Buccheri et al. 1983) for each source for a range of periods from 1 minute to 10 hours. We did not find any significant periodicities in the light curves of any of the symbiotic stars in our sample.
In order to determine the likelihood of detection of a WD spin period in our data, we performed Monte-Carlo simulations to recreate our data with varying degrees of modulation and periodicities in the 100 to 5000s range, following the most typical range of WD spin periods (Norton & Watson, 1989). We found that amplitude modulations of , where the amplitude modulation is defined as the sinusoidal amplitude divided by the peak flux, were detected at high significance, utilizing a search, in greater than 99% of our simulated datasets. Norton & Watson (1989) report that X-ray spin modulations in magnetic CV systems are typically in the 40–90% range, which would be clearly detected in our data. Therefore if WD spin modulation is present in any of these systems, it is at a level of modulation far lower than seen in well-established magnetic WD systems.
The sparsity of the pointed XRT data (see Table 2) did not permit a search for modulations with long periods (e.g., periods on the order of days or months). As the BAT light curves in Figure 1 show, however, the hard X-ray emission (15-25 keV) from all 4 symbiotic stars varied by a factor of 3 or more on a timescale of months. In addition, RT Cru showed considerable variability in the XRT band on a timescale of days. For example, between 2005 October 20 and 2005 October 22, the 0.3–10 keV flux tripled. On 2005 November 2, RT Cru was detected at 0.35 counts s-1, which was a factor of 6 higher than the lowest flux level, on 2005 October 20. The 0.3–10 keV flux from CD 57 3057 also varied over the course of the Swift observations, but by at most a factor of 2. Also in contrast to RT Cru, the 0.3–10 keV flux from T CrB varied by only a relatively modest factor of 1.4 (maximum/minimum). We consider the associated changes in the spectral shape in §5.3.
| Target | Observation ID | Date of Obs. | Exposure | Mean XRT Count rate |
|---|---|---|---|---|
| (ks) | (count/s, 0.3-10 keV) | |||
| RT Cru | 00035099001 | 2005-08-20 | 4.5 | |
| 00035099002 | 2005-10-20 | 1.9 | ||
| 00035099003 | 2005-10-22 | 18.9 | ||
| 00035178001 | 2005-11-02 | 2.2 | ||
| 00030840001 | 2006-12-18 | 2.7 | ||
| 00030840002 | 2006-12-21 | 4.6 | ||
| T CrB | 00035171001 | 2005-06-17 | 8.8 | |
| 00035171002 | 2005-10-07 | 5.2 | ||
| 00035171003 | 2005-10-19 | 10.3 | ||
| CH Cyg | 00035239001 | 2005-11-03 | 9.2 | |
| CD 57 3057 | 00035324001 | 2005-08-15 | 3.2 | |
| 00035324002 | 2005-08-17 | 3.5 | ||
| 00035324003 | 2005-09-27 | 4.6 | ||
| 00035324004 | 2005-11-22 | 3.8 |
5.2. Spectral Analysis
As a first approximation for the 0.3–150 keV spectra of these 4 WD symbiotic stars, we fit an absorbed, single-temperature thermal bremsstrahlung model, with the addition of a Gaussian line component at around 6.4-6.9 keV. Although plasma models that include spectral lines are more likely to correctly describe the data than simple thermal bremsstrahlung models, the quality of our data did not allow us to detect complex line features, and plasma models did not provide improved fits over bremsstrahlung models. We thus parameterized all spectral fits using absorbed single-temperature bremsstrahlung models. Such a model provided a good fit for T CrB. For CD 57 3057 and RT Cru, however, absorbed single-temperature models had problems below 2 keV. The single-temperature fit to CH Cyg gave a strong low temperature component ( keV) and significant residuals at higher energies, confirming the suggestion from the BAT data that additional broadband spectral components are needed to describe the spectrum above 2 keV.
5.2.1 RT Cru
An absorbed, single-temperature bremsstrahlung model provided a poor fit to the spectrum of RT Cru (, ). Because the initial fit generated a soft excess in the residuals, we tried including a second absorbed bremsstrahlung component. The addition of the second broadband emission component resulted in a much-improved fit (, ). In this second fit, however, the two bremsstrahlung temperatures were consistent to within the errors ( keV), with only the absorption differing significantly for the two bremsstrahlung components: and . These results strongly suggest the presence of an absorber that only partially covers the source.
| Source | (FC)a | (PC)b | PCFc | Line Peak | Line Width | (dof) | |
|---|---|---|---|---|---|---|---|
| cm2 | cm2 | (keV) | (keV) | (eV) | |||
| RT Cru | 1.17 (80) | ||||||
| T CrB | 0.047(fixed) | 0.84(28) | |||||
| CD 57 3057 | 1.34(43) |
NOTE.— All errors are quoted at 90% confidence.
a(FC) is the column density of absorbing material that fully
covers the source.
b(PC) is the column density of absorbing material that
partially covers the source.
cPCF is the partial-covering fraction.
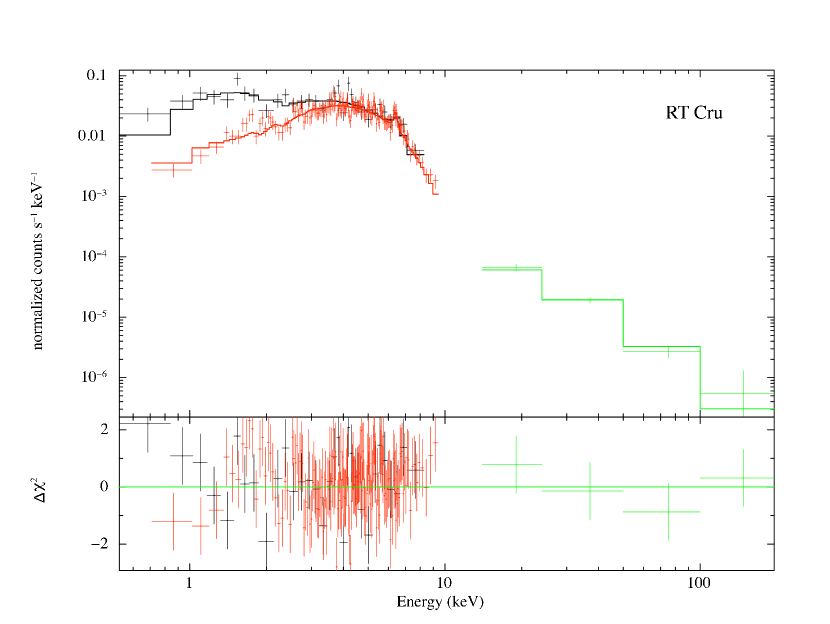
A single-temperature thermal bremsstrahlung model with one absorber that fully covers the source, and another that only partially covers the source (i.e., the XSPEC pcfabs model), provided a good fit to the data (, ), with a fitted partial covering absorption is (PC) and an intrinsic absorption of , consistent with the expected total Galactic absorbing column of (Dickey & Lockman, 1990). Table 3 lists the parameters of this fit. The temperature from the fit to the combined XRT and BAT spectrum is consistent, to within the errors, with the temperature from the fit to the BAT spectrum alone. Allowing the normalization for the bremsstrahlung fit to differ for the XRT and BAT data did not improve the fit. Moreover, the normalizations for the XRT and BAT data were consistent to within the errors.

The XRT spectrum of RT Cru included a strong emission feature associated with the 6.4-6.9 keV Fe line complex. To parameterize this feature, we fit the 5-10 keV portion of the XRT spectrum with a single-temperature bremsstrahlung continuum plus a variety of Gaussian lines. Although a single broad Gaussian provided an adequate fit to the line complex ( for ), both the physical parameters (a line energy of keV and a Gaussian of eV) and the residuals suggested that the line complex actually required multiple Gaussian components. Fitting a 2-Gaussian model gave a much improved fit ( for ), in which the line complex was well described by a narrow ( eV) Fe K line at keV and a broader ( eV) line, probably due to H-like Fe xxvi emission, at keV. Given the detection of Fe xxv line emission at 6.7 keV in the Chandra grating spectra of RT Cru (Luna & Sokoloski, 2007), in addition to the Fe K and Fe xxvi lines suggested by the XRT fits, it is likely that the width of the 6.9 keV line is due to blending of the 6.7 and 6.9 keV lines. A fit to the XRT spectrum with 3 line components fixed at the energies given by Luna & Sokoloski (2007) provided a good fit to the data, but no statistical improvement over the two-line model. Figure 2 shows the two-line fit to the Fe-line complex. We provide additional discussion of the spectral continuum, which is variable, in §5.3.
5.2.2 T CrB
For T CrB, the single-temperature bremsstrahlung model with a Gaussian line provided an acceptable fit to the full 0.3–150 keV spectrum ( with ). T CrB has a high level of absorption, with . The total Galactic absorbing column in the direction of T CrB is (Dickey & Lockman, 1990). The fitted value is more than 400 times this maximum Galactic value, and therefore the majority of must be intrinsic to T CrB. The temperature from our fit to the full spectrum was keV — somewhat higher than the temperature from the BAT spectrum alone (Table 1). The Gaussian line in this model is required with a high significance; the fitted line energy is keV, with a line width of eV. The large width of this line suggests the presence of a number of blended Fe lines, like those seen in CH Cyg (Mukai et al., 2007). The XRT spectrum for this source, however, did not have a high enough signal-to-noise ratio to identify multiple lines.
As the XRT and BAT observations were not contemporaneous, and T CrB varies in both the XRT and BAT energy bands, we re-fit the 0.3–150 keV spectrum with the normalizations for the XRT and BAT data free to differ. With all other parameters forced to be the same for the two data sets, we obtained an improved fit ( for ) with a bremsstrahlung temperature of keV, which was consistent with the temperature from the fit to the BAT spectrum alone. The other parameters remained unchanged. The normalization for the BAT data was approximately 75% higher than that for the XRT data, suggestive of variations in brightness between the time of the BAT and XRT observations. Allowing — as opposed to the normalization — to have different values for the XRT and BAT data sets did not provide a significant improvement over simply allowing the BAT normalization to vary. There was therefore no evidence for spectral variations within the BAT energy band.
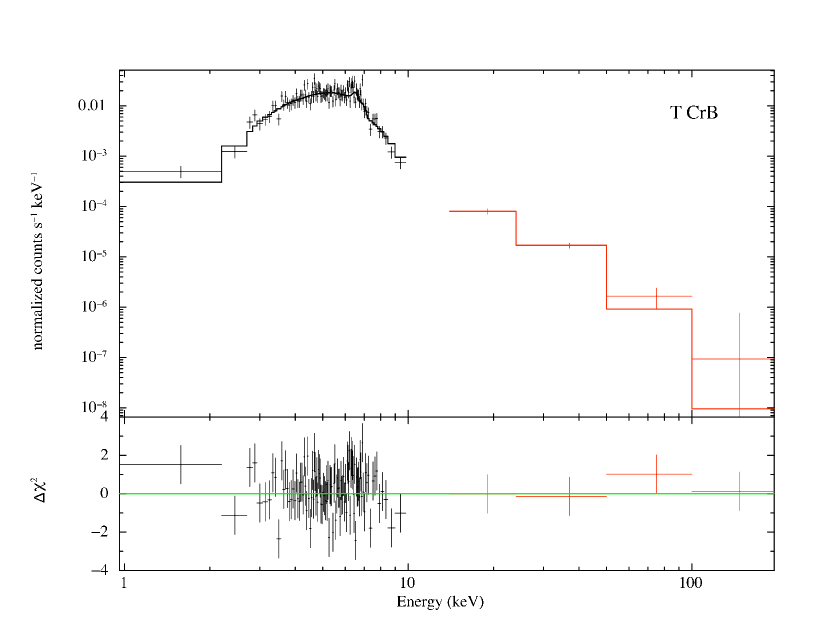
We also fit the spectrum with a model that included partial-covering absorption, with the column density of the absorber that fully covered the sourced fixed to the Galactic value of (we note however, that the actual line of sight absorption is most likely lower than this). The resulting fit was an improvement over the absorbed bremsstrahlung model ( for ) with a fitted partial covering absorption is (PC). An F-test comparing this model with the full-covering absorber model gave a 4% probability of this improvement being seen in a random data set. Thus, although the fitted covering fraction was close to 100%, the partial-covering absorber model was still the better one for T CrB. We present the results of this fit in Figure 3 and Table 3.
5.2.3 CD 57 3057
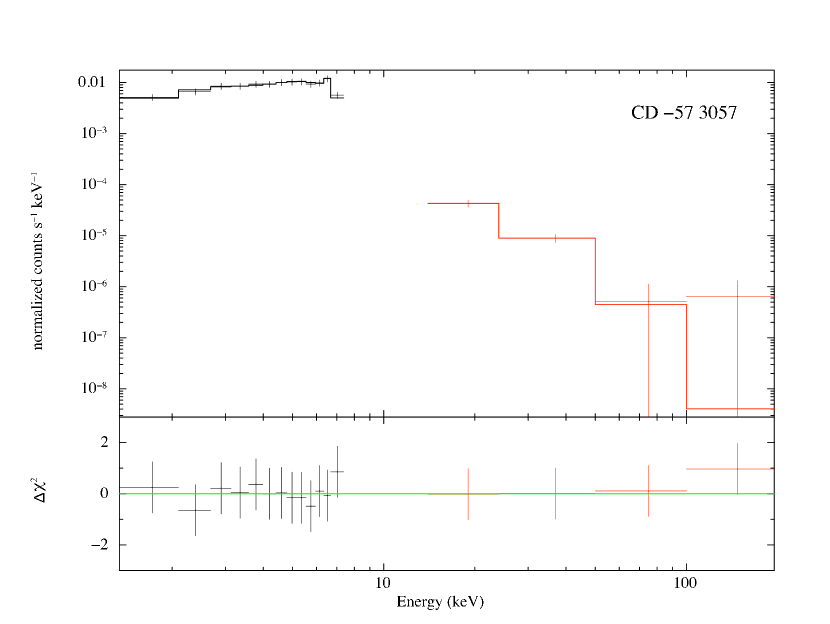
Fitting the combined XRT and BAT spectra of CD 57 3057 with a model that consisted of a single-temperature thermal bremsstrahlung plus a Gaussian line, with partial-covering absorption, gave an acceptable fit ( for ). Figure 4 shows the data, model spectrum, and residuals, and Table 3 lists the parameters of the fit. The column density of absorbing material that fully covered the source was high ((FC)), but consistent with the total Galactic absorption of (Dickey & Lockman, 1990). The column density of absorbing material that only partially covered the source, (PC), was similar to the value for T CrB. Smith et al. (2008) reported detections of Fe K, Fe xxv and Fe xxvi lines in the Suzaku spectrum of CD 57 3057; the emission-line energy and width that we measured in the Swift, XRT spectrum were therefore most likely the result of the blending of these lines.
5.2.4 CH Cyg
As there was only one pointed observation of CH Cyg during 2005, the signal-to-noise ratio for the resulting Swift XRT spectrum was low. Moreover, due to the optical brightness of this object, a large portion of the observation was performed in WT mode, further reducing the effective exposure time. Nonetheless, the XRT spectrum appeared consistent with that found by Suzaku in 2006 (Mukai et al., 2007), in which the spectrum was dominated by a soft ( keV), relatively unabsorbed component, but also contained an additional hard ( keV), highly absorbed component ( cm-2).
5.3. Time dependent spectral variability
To investigate the spectral variability of the sources with multiple observations (i.e., RT Cru, T CrB, and CD 57 3057), we used the XRT data to calculate hardness ratios as a function of time. For these hardness ratios, we selected the bands 0.3–4 keV and 4–10 keV. Division of the XRT spectra at 4 keV gave an approximately equal number of photons in each band for RT Cru. For consistency, we used the same energy bands for T CrB and CD 57 3057.
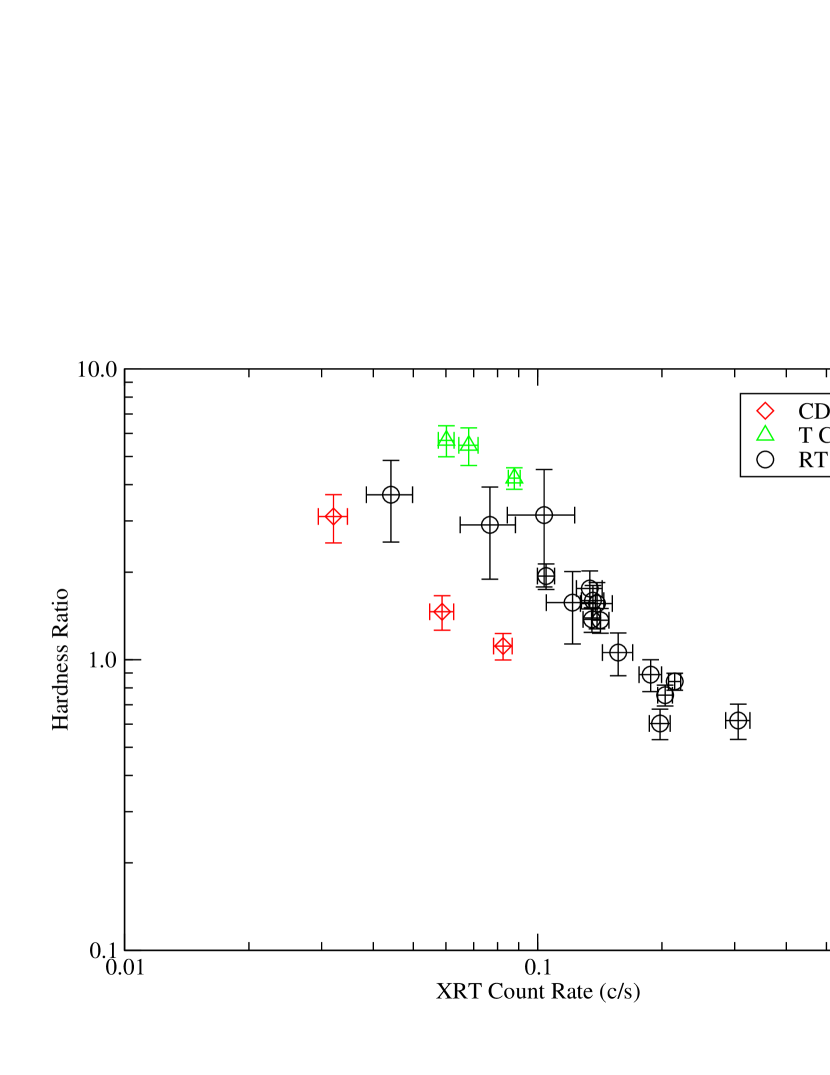
RT Cru varied significantly on a timescale of days, in one case showing a variation of a factor of 3 in observations over a 5-day period. Moreover, the hardness ratio and X-ray brightness appear to have an inverse relationship. Figure 5 shows the hardness ratio as a function of brightness for RT Cru, T CrB, and CD 57 3057. For RT Cru and CD 57 3057, there is a clear inverse relationship between hardness ratio and brightness. For RT Cru, the linear correlation coefficient is (for 15 data bins). The relationship between hardness and XRT count rate for RT Cru is, however, actually best described by a power-law with an index of , so the correlation is most likely better than the linear coefficient suggests. Although T CrB also shows a suggestion of this same inverse relation, the relatively low dynamic range of X-ray brightness measured for this object leads to a correlation that is not statistically significant.
The nature of the variations from RT Cru and CD 57 3057 suggests that they could have been due to changes in the spectral shape of the soft portion of the X-ray spectrum, rather than changes in the overall normalization. To determine the nature of the observed hardness-brightness correlation, we divided the XRT data for RT Cru into three brightness ranges and extracted spectra for each brightness. Since the RT Cru light curve at 8–10 keV was essentially constant, the most obvious way to generate changes in the spectra shape was variable absorption. We thus fit the spectra for the different brightness states simultaneously using the partial-covering model, with all the parameters fixed to the values from Table 3 except for the partial-covering fraction, which we left as a free parameter. This procedure produced good fits for the spectra from each brightness state, with the fitted partial covering fractions values of , , and a 90% confidence lower limit of for the high, intermediate, and low brightness states respectively. Figure 6 shows the spectra corresponding to the intermediate and high states.
The simplest way to explain the variations in RT Cru is with a variable partial-covering fraction, perhaps due to clumpy absorbing material moving in and out of our line of sight. We suggest that such a process causes the brightness variations in RT Cru, CD 57 3057, and possibly also in T CrB, although the significance of the spectral variability in the latter two sources makes it less clear, especially for T CrB. However, their spectral similarities, and the nature of their variability, strongly suggests that RT Cru, CD 57 3057, and T CrB belong to a subclass of highly absorbed, hard X-ray emitting symbiotic stars that do not show any evidence for a CH Cyg-like soft component.
6. Discussion
Previous X-ray observations of WD symbiotic stars revealed primarily soft X-ray emission. Utilizing the hard X-ray imaging capabilities of INTEGRAL and the Swift BAT, a new class of hard X-ray emitting WD symbiotics has been identified, of which RT Cru, CD 57 3057, T CrB and CH Cyg are members.
The hard X-ray component appears to be predominantly thermal in origin, judging by the bremsstrahlung continuum shape (BAT; this work) and the presence of Fe K lines. Moreover, deeper observations reported elsewhere (Ezuka et al., 1998; Mukai et al., 2007; Luna & Sokoloski, 2007) establish the presence of the K lines from H- and He-like Fe, and our XRT data are consistent with the presence of these lines. The hard X-ray component of all 4 objects is strongly absorbed, and an absorber that only partially covers the source is required in all but T CrB. We do not detect any periodic variations. We did, however, detected strong aperiodic variability in RT Cru, CD 57 3057, and perhaps T CrB, which spectral investigation showed to be caused predominantly by variability in the partial covering absorber.
We can estimate the 15–150 keV luminosities of these symbiotic stars from the BAT fit results (Table 1) if the distances are known. For CH Cyg, we use the Hipparcos-measured distance of 245 pc to infer a luminosity of ergs s-1. Note, however, that during the period of the BAT survey observation the source brightness decreased to a hard X-ray low state seen by Suzaku (Mukai et al., 2007). The distance to T CrB is estimated to be about 1 kpc based on its K magnitude, where interstellar extinction and the contribution from the accretion disk is less important than in the optical (Hric et al., 1998). Based on this distance, the 15–150 keV luminosity of T CrB is ergs s-1.
For the other two systems, the distances are highly uncertain. The inferred luminosities are ergs s-1 and ergs s-1, respectively, for CD 57 3057 and RT Cru. Given that CD 57 3057 and T CrB have similar V magnitudes, 1 kpc is a reasonable guess for the former (Smith et al., 2008, argue that the distance to CD 57 3057 is between 250pc and 1 kpc), although the accretion disk contributions and the interstellar extinctions may well be different for these two stars. Luna & Sokoloski (2007) suggest a distance of 1.5–2.0 kpc for RT Cru, which would mean that RT Cru has an intrinsic luminosity 4 to 8 times brighter than CD 57 3057, or greater if CD 57 3057 is closer than 1 kpc.
Considering these luminosity estimates, and the thermal nature of the X-ray spectra, we believe that the hard X-rays in these symbiotic stars are due to accretion onto WDs. The luminosity of such a component is proportional to the gravitational potential of the white dwarf (G, where G is the Newtonian constant of gravity, is the white dwarf mass, and its radius) times the mass accretion rate. The highest temperature in the accreting plasma is also primarily controlled by G, although it also depends on the details of the accretion geometry. Based on equation (5) of Livio & Warner (1984), these symbiotic stars could have large ( cm) disks. Although such large disks differ markedly from CV disks on AU scales, on small scales where accretion energy is expected to be radiated as X-rays, the astrophysics is similar to that of CVs, and the physics of accretion is governed by the same fundamental laws. We therefore proceed by applying the knowledge gained from CVs to symbiotic stars.
On scales of cm, the magnetic field of the white dwarf can play a crucial role in shaping the X-ray emission (Mukai, 2005). Accretion in magnetic CVs proceeds vertically, forming a strong shock. Accretion in non-magnetic CVs proceeds via a Keplerian disk. The interface between the disk and the WD (“the boundary layer”) is thought to be the origin of the X-rays in non-magnetic CVs. The X-ray luminosities of non-magnetic CVs are generally in the range – ergs s-1 typically with kT5–10 keV bremsstrahlung-like spectra (Baskill et al., 2005). Magnetic CVs are often harder and more X-ray luminous: Sazonov et al. (2006) derived luminosities in the range – ergs s-1 for magnetic CVs detected by the RXTE slew survey. The 4 WD symbiotics that we detected with BAT appear to have luminosities that are comparable to, or slightly greater than, those of magnetic or non-magnetic CVs.
The magnetic nature of a CV can be established by the detection of the spin period in the X-rays and/or the optical. That we did not find any coherent periodic variations in the Swift XRT data, and that none have been reported in other data sets, is a strong indication against the magnetic nature of the accreting WDs in these systems. That non-magnetic CVs are generally fainter and softer than magnetic CVs raises the question of why these symbiotic stars are luminous enough and hard enough to be detectable with INTEGRAL and Swift BAT. We note that only one non-magnetic CV has been detected by INTEGRAL: SS Cyg, which is the brightest non-magnetic CV in the 2–10 keV band (Barlow et al., 2006).
We argue that the high temperature and high luminosity of the 4 symbiotic stars are most readily explained by high values of G, i.e., high mass white dwarfs. In the following, we estimate the masses of the WDs in T CrB, CD 57 3057, and RT Cru by assuming that the plasma temperature in a boundary layer around a WD of a certain mass is related to the plasma temperature in a magnetic accretion column onto a WD of the same mass by one of two simple scale factors. We obtain empirical estimates of these scale factors by comparing the measured bremsstrahlung temperatures in SS Cyg, a non-magnetic CV with an independently determined mass estimate, to the theoretical shock temperature for a magnetic CV of that mass. The vertical accretion in magnetic CVs allows plasma to reach a shock temperature of , where is the shock temperature, the mass of a hydrogen atom, and the mean molecular weight (we adopt 0.615 appropriate for Solar abundance plasma). When one fits a single-temperature bremsstrahlung model, the resulting temperature is lower than because the emission is actually from a multi-temperature plasma cooling from to 0 keV. Nevertheless, single-temperature bremsstrahlung fits returns values in the 10–50 keV range for magnetic CVs (see, e.g., Ishida 1991 for a compilation of Ginga results).
The shock temperatures in non-magnetic CVs are lower than in magnetic CVs for two reasons. First, half of the gravitational potential energy has been radiated away by the accretion disk. Second, the shocks in the boundary layer are oblique, and not as strong as those in magnetic CVs. Unfortunately, the details of the accretion disk boundary layers are complex and theories are not yet sufficiently advanced to provide an unambiguous guidance. Empirically, SS Cyg has a bremsstrahlung temperature of 17 keV in quiescence and 7 keV in outburst (Wheatley et al., 2003) associated with the transition of the boundary layer from optically thin to predominantly optically thick (Patterson & Raymond, 1985). Its WD mass is thought to be M⊙ (Mauche & Robinson 2001 and references therein), and therefore its radius is 4900+/-700 km using the standard mass-radius relationship (we have made use of the analytical formula of Pringle & Webbink 1975), and therefore keV. Let us proceed, for now, by assuming that there is one scaling factor for the temperature obtained through a bremsstrahlung fit for low accretion rate (quiescence) boundary layer, and another for high accretion rate (outburst) boundary layer. These factors therefore are 17/71=0.24 for quiescence and 7/71=0.10 for outburst.
T CrB and CD 57 3057 have a bremsstrahlung temperature near 17 keV. Using the scaling factors above, the inferred is 17/0.24=71 keV or 17/0.10=170 keV, depending on whether the boundary layer in these symbiotics resemble that of SS Cyg in quiescence or in outburst. These values imply the WD mass of 1.1 M⊙ or 1.35 M⊙ for these two cases, respectively. Similarly, the 30 keV bremsstrahlung temperature of RT Cru requires a 1.3 M⊙ or a 1.42 M⊙ WD. The WD in CH Cyg, with its much lower temperature, is presumably less massive.
Our estimate of the mass of the WD in T CrB in the high accretion rate case (1.35 M⊙) is consistent with those based on the recurrence time scale of this recurrent nova (see, e.g., Hachisu & Kato 1999). Since the UV luminosity of T CrB is estimated by Selvelli et al. (1992) to be 40 L⊙ or ergs s-1, with an inferred mass accretion rate of M⊙ year-1, it indeed must be in the high state. As in SS Cyg in outburst and in the old nova V603 Aql (Mukai & Orio, 2005), the UV luminosity of T CrB far exceeds its hard X-ray luminosity, probably because the bulk of the boundary layer is optically thick and predominantly emits in the UV and soft X-rays (Patterson & Raymond, 1985). Given the intrinsic as well as interstellar absorption, the lack of detection of the soft X-ray component in T CrB is not surprising. Thus, scaling using SS Cyg in outburst leads to a solution that is consistent with previous studies of this recurrent nova system.
All 4 systems show strong intrinsic absorption. In addition to the spectral results present here, Ezuka et al. (1998) report that a partial covering absorber model is required to describe the strong intrinsic absorption seen by ASCA in CH Cyg. The variability of the intrinsic absorption seen in RT Cru and CD 57 3057 over relatively short time scales (days) would suggest that the absorbing material is associated with accretion onto the WD, and cannot be explained by the mere presence of the M giant wind. Assuming Keplerian motion, a time scale of days corresponds to a distance from the WD on the order of 1011 cm. These quantities are much smaller than the orbital time scale of years, and the expected binary separation, respectively. On the other hand, 1011 cm is a reasonable distance for a feature associated with the accretion disk. If the accretion disk is geometrically thin, we expect significant intrinsic absorption only in high inclination systems. For a thin disk, there is nothing obvious that would prevent us from observing hard X-rays from low inclination symbiotic stars, with little intrinsic absorption (absorption in the wind of the M giant is much less than is observed in our 4 targets; van den Berg et al. 2006). If the accretion disks in these high mass, high accretion rate, symbiotic stars are geometrically thick, it may be possible for the majority of the sight lines to pass through local absorbers.
We note that in the models of stellar wind disruption by a compact object reported by Blondin et al. (1990), localized instabilities in the accretion flow can lead to absorption variability with timescales on the order of hours, consistent with timescales seen in our observations. However these models also predict a strong variability in absorption at the orbital period not seen in our data. As the orbital parameters of these systems are not well understood, comparison with such models is considered speculative.
7. Conclusions
Swift BAT survey and pointed XRT observations have established CH Cyg, T CrB, RT Cru, and CD 57 3057 as bright hard X-ray symbiotic stars. We have put forth an interpretation in which the hard X-rays are produced by accretion onto a massive, non-magnetic WD. Using a scaling factor from SS Cyg in outburst, we infer a WD mass of 1.35 M⊙ for T CrB. The same conclusion has already been reached by other, independent means. A 1.35 M⊙ white dwarf (=2700 km) has a gravitational potential well that is 7 times deeper than that of a 0.6 M⊙ (=8800 km) white dwarf. Other things being equal, the X-ray luminosity and temperature of such a massive white dwarf are therefore higher than those of a typical (0.6 M⊙) accreting white dwarf. The high mass of the WD in T CrB is thus the main reason that it is detected by Swift BAT. If we then take the hard X-ray emission from T CrB, which is known to contain a high-mass WD, as validation of our method, we can also infer near Chandrasekhar masses for the WDs in CD 57 3057 and in RT Cru. If these mass and accretion rate estimates are confirmed, these symbiotic stars are also likely to be recurrent novae. Moreover, given their near Chandrasekhar masses, they may be valid candidate progenitors of Type Ia supernovae.
Higher sensitivity surveys are necessary to discover the full population of hard X-ray emitting WD symbiotics. If high absorption is universal, but the high temperature is not (as suggested by CH Cyg), then a wide-area survey in the 2–10 keV band may be necessary. At the same time, T CrB-like sources may stand out easily in deeper surveys of the 10 keV sky, including the future versions of the Swift BAT all-sky survey.
References
- Arnaud (1996) Arnaud, K. A. 1996, in “Astronomical Data Analysis Software and Systems V,”, eds. Jacoby, G. & Barnes, J., APS Conf. Ser. 101, 17
- Barlow et al. (2006) Barlow, E. J., Knigge, C., Bird, A. J., Dean, A., Clark, D. J., Hill, A. B., Molina, M. & Sguera, V. 2006, MNRAS, 372, 224
- Barthelmy et al. (2005) Barthelmy, S. D., et al. 2005, Space Science Reviews, 120, 143
- Baskill et al. (2005) Baskill, D. S., Wheatley, P. J. & Osborne, J. P. 2005, MNRAS, 357, 626
- Bird et al. (2007) Bird, A. J., et al. 2007, ApJS, 170, 175
- Blondin et al. (1990) Blondin, J. M., Kallman, T. R., Fryxell, B. A., & Taam, R. E. 1990, ApJ, 356, 591
- Buccheri et al. (1983) Buccheri, R., et al. 1983, A&A, 128, 245
- Burrows et al. (2005) Burrows, D. N., et al. 2005, Space Science Reviews, 120, 165
- Chernyakova et al. (2005) Chernyakova, M, Courvoisier, T. J.-L., Rodriguez, J. & Lutovinov, A. 2005, The Astronomer’s Telegram, 519
- Cieslinski et al. (1994) Cieslinski, D., Elizalde, F. & Steiner, J.E. 1994, A&AS, 106, 243
- Dickey & Lockman (1990) Dickey, J. M., & Lockman, F. J. 1990, ARA&A, 28, 215
- Ezuka et al. (1998) Ezuka, H., Ishida, M., & Makino, F. 1998, ApJ, 499, 388
- Galloway & Sokoloski (2004) Galloway, D. K. & Sokoloski, J. L. 2004, ApJ, 613, L61
- Gehrels et al. (2004) Gehrels, N., et al. 2004, ApJ, 611, 1005
- Hachisu & Kato (1999) Hachisu, I. & Kato, M. 1999, ApJ, 517, L47.
- Hill et al. (2005) Hill, J. E., Angelini, L., Morris, D. C., Burrows, D. N., Abbey, A. F., Campana, S., Cusumano, G., Kennea, J. A., Klar, R., Mangels, C., Moretti, A., Perri, M., Racusin, J., Tagliaferri, G., Tamburelli, F., Wood, P., Nousek, J. A. & Wells, A. 2005, Proc. SPIE 5898, 313
- Hric et al. (1998) Hric, L., Petrík, K., Urban, Z., Niarchos, P. & Annupama, G. C. 1998, A&A, 339, 449
- Ishida (1991) Ishida, M. 1991, Ph.D. Thesis, Univ. Tokyo
- Kahabka & van den Heuvel (1997) Kahabka, P., van den Heuverl, E.P.J. 1997, ARAA 35, 69
- Karovska et al. (2007) Karovska, M., Carilli, C. L., Raymond, J. C., & Mattei, J. A. 2007, ApJ, 661, 1048
- Kellogg et al. (2001) Kellogg, E., Pedelty, J. A., Lyon, R. G. 2001, ApJ, 563, L151
- Kellogg et al. (2007) Kellogg, E., et al. 2007, ApJ, 664, 1079
- Kraft (1958) Kraft, R.P. 1958, ApJ, 127, 625
- Livio & Warner (1984) Livio, M., & Warner, B. 1984, The Observatory, 104, 152
- Luna & Sokoloski (2007) Luna, G. J. M., & Sokoloski, J. L. 2007, ApJ, 671, 741
- Markwardt et al. (2005) Markwardt, C.B., Tueller, J., Skinner, G.K., Gehrels, N., Barthelmy, S.D. & Mushotzky, R.F. 2005, ApJ, 633, L77
- Masetti et al. (2005) Masetti, N., Bassani, L., Bird, A.J. & Bazzano, A. 2005, The Astronomer’s Telegram, 528
- Masetti et al. (2006) Masetti, N., Bassani, L., Dean, A.J., Ubertini, P. & Walter, R. 2006, The Astronomer’s Telegram, 715
- Mauche & Robinson (2001) Mauche, C.W. & Robinson, R.L. 2001, ApJ, 562, 508
- Mukai (2005) Mukai, K., in “The Astrophysics of Cataclysmic Variables and Related Objects,” ASP Conference Vol. 330, eds. J.-M. Hameury & J.-P. Lasota, San Francisco: Astronomical Society of the Pacific, 2005, 147
- Mukai & Orio (2005) Mukai, K. & Orio, M. 2005, ApJ, 622, 602
- Mukai et al. (2007) Mukai, K., Ishida, M., Kilbourne, C., Mori, H., Terada, Y., Chan, K.-W., & Soong, Y. 2007, PASJ, 59, S177
- Mürset et al. (1997) Mürset, U., Wolff, B., Jordan, S. 1997, A&A, 319, 201
- Norton & Watson (1989) Norton, A. J., & Watson, M. G. 1989, MNRAS, 237, 853
- Patterson & Raymond (1985) Patterson, J. & Raymond, J. C. 1985, ApJ, 292, 550
- Pereira et al. (2003) Pereira, C.B., Franco, C.S. & de Araújo, F., X. 2003, A&A, 397, 927
- Perryman et al. (1997) Perryman, M.A.C. et al. 1997, A&A, 176, 262
- Pringle & Webbink (1975) Pringle, J. E. & Webbink, R. F. 1975, MNRAS, 172, 493
- Revnivtsev et al. (2006) Revnivtsev, M.G., Sazonov, S. Yu, Molkov, S.V., Lutovninov, A.A., Xhurazov, E.M. & Sunyaev, R.A. 2006, Astron. Lett., 32, 145
- Roming et al. (2005) Roming, P. W. A., et al. 2005, Space Science Reviews, 120, 95
- Sanduleak & Stephenson (1973) Sanduleak, N. & Stephenson, C.B. 1973, ApJ, 185, 899
- Sazonov et al. (2006) Sazonov, S., Revnivtsev, M., Gilfanov, M., Churazov, E. & Sunyaev, R. 2006, A&A, 450, 1175
- Schmidt et al. (2006) Schmidt, M.R., Zacs, L., Mikolajewska, J. & Hinkle, K.H. 2006, A&A, 446, 603
- Selvelli et al. (1992) Selvelli, P. L., Cassatella, A. & Gilmozzi, R. 1992, ApJ, 393, 289
- Skinner et al. (1987) Skinner, G. K., Ponman, T. J., Hammersley, A. P., & Eyles, C. J. 1987, Ap&SS, 136, 337
- Smith et al. (2008) Smith, R. K., Mushotzky, R., Mukai, K., Kallman, T., Markwardt, C. B., & Tueller, J. 2008, PASJ, 60, 43
- Sokoloski et al. (2001) Sokoloski, J. L., Bildsten, L., & Ho, W. C. G. 2001, MNRAS, 326, 553
- Tueller et al. (2005a) Tueller, J., Barthelmy, S., Burrows, D. N., Falcone, A., Gehrels, N., Grupe, D., Kennea, J. A., Markwardt, C. B., Mushotzky, R. F., Skinner, G.K., The Astronomer’s Telegram, 668
- Tueller et al. (2005b) Tueller, J., Barthelmy, S., Burrows, D. N., Falcone, A., Gehrels, N., Grupe, D., Kennea, J. A., Markwardt, C. B., Mushotzky, R. F., Skinner, G.K., The Astronomer’s Telegram, 669
- Tueller et al. (2005c) Tueller, J., Gehrels, N., Mushotzky, R. F., Markwardt, C. B., Kennea, J. A., Burrows, D. N., Mukai, K., & Sokoloski, J. 2005, The Astronomer’s Telegram, 591
- van den Berg et al. (2006) van den Berg, M., Grindlay, J., Laycock, S., Hong, J., Zhao, P., Koenig, X., Schlegel, E. M., Cohn, H., Lugger, P., Rich, R. M., Dupree, A. K., Smith, G. H. & Strader, J. 2006, ApJ, 647, L135
- Wheatley et al. (2003) Wheatley, P. J., Mauche, C. W., & Mattei, J. 2003, MNRAS, 345, 49
- Zamanov et al. (2004) Zamanov, R., Bode, M. F., Stanishev, V. & Martí, J. 2004, MNRAS, 350, 1477