Simultaneous multi-frequency observations of PG 1553+113
Abstract
We report simultaneous multi-frequency observations of the blazar PG 1553+113, that were carried out in March-April 2008. Optical, X-ray, high-energy (HE: MeV) -ray, and very-high-energy (VHE: GeV) -ray data were obtained with the KVA, REM, RossiXTE/ASM, AGILE and MAGIC telescopes. This is the first simultaneous broad-band (i.e., HE+VHE) -ray observation of a blazar. The source spectral energy distribution derived combining these data shows the usual double-peak shape, and is interpreted in the framework of a synchrotron-self-Compton model.
Blazars, PG 1553+113, MWL Observation
1 Introduction
The transformation of gravitational energy from an accreation disk around a supermassive black hole into radiation is commonly believed to be the underlying cause of emission in Active Galactic Nuclei (AGNs). Furthermore, much of the emission is relativistically beamed perpendicular to the disk by a mechanism that, although not completely understood yet, is most likely related to the focusing properties of the rotating, fully-ionized accretion disk [8]. It is believed that the viewing angle of the observer determines the observed phenomenology of AGNs [33]. The AGNs whose relativistic plasma jets point towards the observer are called blazars. The blazar class includes Flat-Spectrum Radio Quasars (FSRQs) and BL Lac objects, the main difference between the two classes being their optical emission lines, which are strong and quasar-like for FSRQs and weak or absent in BL Lacs.
The overall (radio through -rays) spectral energy distribution (SED) of blazars usually shows two broad non-thermal continuum peaks. For high-energy-peaked BL Lac objects (HBLs), the first peak is in the UV/soft-X-ray bands [as opposed to IR/optical for low-energy-peaked BL Lac objects (LBLs)] whereas the second peak is in multi-GeV band (multi-MeV for LBLs). The low-energy peak is most commonly believed to be synchrotron radiation from a non-thermal population of electrons moving in a tangled magnetic field threading the emitting plasma region – the latter is modeled as a sperical blob that moves relativistically along the jet. The second peak forms by Compton upscattering of lower-energy photons by the same population of electrons that is responsible for the synchrotron emission. The lower-energy photons can originate either from the synchrotron radiation constituting the low-energy bump (Synchrotron Self Compton: SSC), or from outside the relativistic plasma blob (External Compton: an external source of ’seed’ photons could be the accretion disk [11] and/or broadline region [32]).
Blazars often show violent flux variability, that may or may not appear correlated in the various energy bands. Simultaneous observations are then crucial to understand any patterns of temporal variability as well as the emission processes.
The high-energy-peaked BL Lac source PG 1553+113 was firmly detected at GeV
by MAGIC at an 8.8 significance level, based on the data from 2005 and 2006 [4].
The source had also been tentatively detected at VHEs by H.E.S.S.,
at a 4 significance level (5.3 using low-energy threshold analysis:
[2]), which was confirmed later using 2005 and 2006 data [3].
The lack of detection of spectral lines (neither in emission nor in absorption) in the optical
spectrum of PG 1553+113 makes it impossible to measure its redshift directly [15].
However, an ESO-VLT spectroscopic survey of unknown-redshift BL Lac objects suggests
[30]. On the other hand, the absence of a break in the intrinsic VHE -ray
spectrum may sugges [27].
2 VHE -rays : MAGIC observations
The MAGIC Telescope [7], [9] is a latest generation Imaging Atmospheric Cherenkov Telescope (IACT) at La Palma, Canary Islands, Spain (28.3∘N, 17.8∘W, 2240 m a.s.l.). Thanks to its low threshold of 50 GeV [5], MAGIC is well suited for multi-frequency observations, together with the instruments operating in the GeV range. The parabolic shaped reflector, resulting in a total mirror area of 236 m2, allows MAGIC to collect Cherenkov light from particle showers initiated by gammas or other particles in the atmosphere and focus it onto a multi-pixel camera, composed of 577 photomultipliers. The total field of view of the camera is 3.5∘. The incident light pulses are converted into optical signals and transmitted via optical fiber to a 3-level trigger system. The selected events are digitized by 2 Gsamples/second Flash ADCs [21]. With a statistical analysis of the recorded light distribution and the orientation of the shower image in the camera, the energy of the primary particle and its incoming direction are reconstructed.
The MAGIC observations used in this paper were performed on 16-18 March and 13, 28-30 April 2008. The zenith angle of the data set ranges from 18 to 36 degrees. Observations were performed in wobble mode [17], where the object was observed at 0.4 degree offset from the camera center in opposite directions every 20 minutes. After the quality selection of the data the total effective observation time is 7.18 hours.
An automatic analysis pipeline (see [13]) was used to process the data. After an absolute calibration with muons [20], and an absolute mispointing correction, noise subtraction and background reduction is achieved using the charge distribution and the arrival time information of the pulses of the pixels [6]. Three OFF regions, defined in the same data set symmetrically to the ON region with respect to the camera center, were used to determine the remaining background. To select the gamma-like events, a dynamical cut in Area (Area=WIDTHLENGTH) versus SIZE and a cut in were applied 111Width, Length and Size are the image parameters in [22].. More details of the cuts can be found in [29].
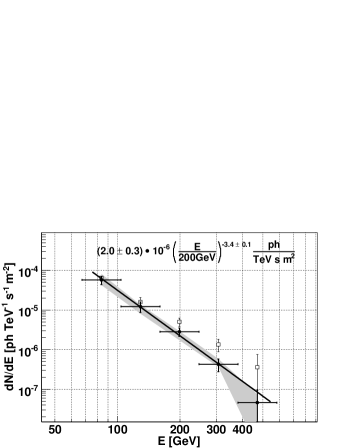
For the calculation of the differential energy spectrum, a loose cut in Area was selected to ensure that more than 90% of the MC gammas after the image cleaning survive the cut. To study the dependence of the spectral shape on the cut efficiency, a different cut in Area with cut efficiencies of between 50% and 95% for the entire energy range was applied. The gray area in Fig.1 is the result of this study. For data affected by calima (i.e. windblown sand dust from Sahara in an air layer between 1.5 km and 5.5 km a.s.l. causing absorption of the Cherenkov light), a correction has been applied. The method is described in detail in [14].
3 HE -rays: AGILE observations
The Gamma-Ray Imaging Detector (GRID: 30 MeV–30 GeV) on board the spaceborne HE--ray telescope AGILE 222 Astro-rivelatore Gamma a Immagini LEggero; [34], [35]. observed PG 1553+113 in three different time periods: 16-21 March, 25-30 March and 10-30 April 2008. The GRID data were analyzed using the AGILE standard pipeline (see [37] for a detailed description of the AGILE data reduction), with a bin size of for E 100 MeV. Only events flagged as confirmed -rays and not recorded while the satellite crossed the South Atlantic Anomaly were accepted. We also rejected all the events with reconstructed direction within from the Earth limb, thus reducing contamination from Earth’s -ray albedo.The total effective observation time, after the selection is 268 hours. PG 1553+113, observed at about 50 degrees off-axis with respect to the boresight, was not detected by the GRID at a significance level 3 and therefore an upper limit at 95 confidence level was calculated. Considering that AGILE has a higher particle background at very high off-axis angles, we calculated also the upper limit selecting only photons with E 200 MeV in order to minimize the possible contamination at low energies. The summary of the AGILE observations and the results of the analysis are reported in Table 1. During March-April 2008, PG 1553+113 was outside the field of view of SuperAGILE, the hard X-ray (20-60 keV) imager on board AGILE [16], thus no SuperAGILE data on this source are available from this period.
4 X-rays: RXTE/ASM Observations
The All Sky Monitor (ASM) on board the Rossi X-ray Timing Explorer (XTE) satellite consists of three wide angle scanning shadow cameras. The cameras, mounted on a rotating drive assemble can cover almost of the sky in every 1.5 hours [25]. For this campaign, we used ASM data taken from 1 March through 31 May, 2008. The mean measured flux of PG 1553+113 is showed in Table 2.
5 Optical data
5.1 KVA observations
The KVA (Kungliga Vetenskaps Akademien) telescope is located at the Roque de los Muchachos Observatory on La Palma island, Spain and is operated by Tuorla Observatory. The telescope is composed of a 0.6 m f/15 Cassegrain devoted to polarimetry, and a 0.35 m f/11 SCT auxiliary telescope for multicolour photometry. This telescope has been successfully operated remotely since autumn 2003. The KVA is used for optical support observations for MAGIC by making -band photometric observations typically one measurement per night per source. Photometric measurements of PG 1553+113 were made in differential mode, i.e. by obtaining CCD images of the target and calibrated comparison stars in the same field of view ([18]; [19]; [38]).
5.2 REM observations
REM (Rapid Eye Mount: a fast slewing robotized infrared telescope, [10]) acquired photometry of PG 1553+113 on April 18 and 25, and May 2, 2008 with all the available filters (). The data reduction followed standard procedures [12]. The resulting flux of the three observations is reported in Table 2. The optical magnitudes have been calibrated against the standard Landolt field [24] of PG 1323, while the near infrared magnitudes were calibrated against the 2MASS catalog. The optical data taken during the night of 18 April are affected by moonlight and have not been used. For the purpose of SED construction, all magnitudes have been dereddened using the dust IR maps [31].
6 Results
Analysing the VHE data, an excess of 415 gamma-like events, over 1835 normalized background events was found, corresponds to a significance of 8 . The differential VHE photon spectrum of PG 1553+113, resulting from MAGIC data averaged over all observation nights, is plotted in Fig.1 (filled circles). It can be well described by a power law:
| (1) |
in units of cm-2s-1TeV-1 with /DOF1.36/3.
During the nights of MAGIC observations no significant flux variability was found. The differential energy spectrum for the March data alone can be well described by:
| (2) |
whereas the energy spectrum for the April data can be well described by:
| (3) |
(same units as above). Because of the interaction of VHE -rays with the extragalactic background light (EBL: the integrated light from all stars that ever formed; it spans the IR-UV frequency range), which leads to pair production and ensuing attenuation of the VHE -ray flux, we computed the deabsorbed (i.e., intrinsic) fluxes using a specific ’low star formation model’ of the EBL [23], assuming a source redshift of . The resulting deabsorbed points are represented as empty squares in Fig.1.
The HE data reduction results from AGILE are summarized in Table 1. The upper limits obtained by AGILE are consistent with the average flux observed by Fermi-LAT for this source in its first three months of operation [1]. The upper limit obtained in the second period (25-30 March) is of the same order of that obtained in the first period.
| Time period | Energy | U.L. Flux [photons cm-2s-1] |
|---|---|---|
| 16-21 March | 100MeV | |
| 200 MeV | ||
| 10-30 April | 100MeV | |
| 200 MeV |
The fluxes, and their corresponding effective photon frequencies, from the other telescopes used in this paper are reported in Table 2.
| Instrument | log( [Hz]) | log(F() [erg cm-2 s-1]) |
|---|---|---|
| KVA | 14.63 | -10.2 |
| REM | 14.38 | -10.33 |
| 14.27 | -10.34 | |
| 14.13 | -10.38 | |
| RXTE/ASM | 18.03 | -10.3 |
7 Discussion
The SED of PG 1553+113 is shown in Fig.2. The VHE and HE -ray points are from MAGIC and AGILE, repectively. The X-ray point, provided by RXTE/ASM, represents the average flux between March 1 and May 31, 2008. The optical -band point, provided by the KVA telescope, is from March 18,19.
In addition to these data, we also used an optical flux on April 18 from REM. To assess the soundness of the addition of this quasi-simultaneous data with other simultaneous data, we checked the optical variability of the source from April 13 to April 18 using KVA data, and found that the source was essentially stable, with a variability of less than 2 in flux. In order to see the variability in HE range from the upper limits of AGILE, we used flux points from the Fermi Gamma-ray Space Telescope (formerly GLAST; Abdo et al. 2009).

We fit the resulting SED with a homogeneous one-zone SSC model [36]. In the frame of this model, the source is a spheric blob of plasma of radius , moving with a Doppler factor [28] towards the observer at an angle with respect to the line of sight and threaded with a tangled uniform magnetic field, . The injected relativistic particle population is described as a broken power-law spectrum with normalization , extending from to and with indices and below and above the break Lorentz factor . In the framework of this model, the SED can be described with the following set of parameters: = 1, , , cm3, , , G, cm, and .
The Fermi and lowest-energy MAGIC data points do suggest some variability at HE -rays. Comparing the current SED with that based on earlier MAGIC observations [4], some variability is clearly visible. This is due to a small flux variation in the X-ray range and a large flux variation in the VHE range. The optical flux does not show any significant variability.
Our results suggest that the variablility of PG 1553+113 at different frequencies is highly time depended: hence, only a simultaneous multi- monitoring over a large time span will give more information on the source. Relative to this fact, it is worth mentioning that the AGILE and MAGIC data presented here constitute the first simultaneous broad-band -ray observation (and ensuing SED) of any blazar.
Acknowledgements. The MAGIC collaboration would like to thank the Instituto de Astrofísica de Canarias for the excellent working condition at the Observetorio del Roque de los Muchachos at La Palma. Major support from Germany’s Bundesministerium für Bildung, Wissenschaft, Forschung und Technologie and Max-Planck-Gesellschaft, Italy’s Istituto Nazionale di Fisica Nucleare (INFN) and Istituto Nazionale di Astrofisica (INAF), and Spain’s Ministerio de Ciencia e Innovaci’on is gratefully acknowledged. The work was also supported by Switzerland’s ETH Research grant TH34/043, Poland’s Ministertwo Nauki i Szkolnictwa Wyszego grant N N203 390834, and Germany’s Young Investigator Program of the Helmholtz Gemeinschaft.
References
- [1] A.A. Abdo et al. 2009 To be submitted [arxiv:0902.1559]
- [2] F.A. Aharonian, et al. 2006, A&A, 448, 19
- [3] F.A. Aharonian, et al. 2009, A&A, 477, 481
- [4] J.Albert et al. 2007, A&A, 654, 119
- [5] J.Albert et al. 2008a, ApJ, 674, 1037
- [6] E.Aliu et al. 2009, Astropart. Phys., 30, 293
- [7] C.Baixeras et al. 2004, Nuclear Instruments and methods in Physics Research A, 518, 188
- [8] R.D.Blandford & R.L.Znajek 1997, MNRAS, 179, 433
- [9] J.Cortina, et al. 2005, Proc. 29th ICRC, 5, 359
- [10] S.Covino, et al, 2001, ASP Conference Series, Vol. TBD, 2001
- [11] C.D.Dermer & A.Schlickeiser 1993, ApJ , 416, 458
- [12] A.Dolcini et al. 2005, A&A, 443, L33
- [13] D.Dorner et al, 2005, Proc. 29th ICRC, 5, 175
- [14] D.Dorner et al. 2009, A&A arxiv:0808.0279
- [15] R.Falamo & Treves, A. 1990, PASP , 102, 1120
- [16] M.Feroci et al. 2007, Nucl. Instrum. Methods Phys. Res. A, 581, 728
- [17] V.P. Fomin, et al. 1994, Astropart. Physics, 2, 137
- [18] M.Fiorucci & G.Tosti 1996, A&AS , 116, 403
- [19] M.Fiorucci, et al. 1998, PASP, 110, 105
- [20] F.Goebel et al. 2005, Proc. 29th ICRC, 5, 179
- [21] F.Goebel, et al. 2007, Proc. 30th ICRC, 3, 1481
- [22] A.M.Hillas, 1985, Proc. 19th ICRC, 3, 445
- [23] T.M.Kneiske, et al., 2004, A&A, 413, 807
- [24] A.U.Landolt, 1992, The Astronomical Journal, 104,1
- [25] A.M.Levine et al. 1996, ApJ, 469, L33
- [26] L.Maraschi, G.Ghisellini, & A.Celotti 1992, ApJ , 397, 5
- [27] D.Mazin, & F.Goebel 2007, ApJ Letters, 655, 13
- [28] M Moriconi 2006, Eur. J. Phys., 27, 1409
- [29] B.Riegel. & T.Bretz, 2005, Proc. 29th ICRC, 5, 215
- [30] Sbarufatti et al. 2006, ApJ, 132, 1
- [31] D.J. Schlegel ,1998, ApJ, 500, 525
- [32] M.Sikora et al. ,1994, ApJ, 421, 153
- [33] C.Urry, & Padovani, P. 1995, PASP, 107, 803
- [34] M.Tavani, et al. 2008a, Nucl. Instrum. Methods Phys. Res. A, 588, 52
- [35] M.Tavani, et al. 2008b, A&A in press, [arXiv:0807.4254v1]
- [36] F.Tavecchio et al 2001, ApJ, 554, 725
- [37] S.Vercellone, et al. 2008, ApJL, 676, 13
- [38] M.Villata, et al. 1998, A&AS , 130, 305