Constraints on the multi-TeV particle population in the Coma Galaxy Cluster with H.E.S.S. observations
Abstract
Aims. Galaxy clusters are key targets in the search for ultra high energy particle accelerators. The Coma cluster represents one of the best candidates for such a search owing to its high mass, proximity, and the established non-thermal radio emission centred on the cluster core.
Methods. The H.E.S.S. (High Energy Stereoscopic System) telescopes observed Coma for 8 hr in a search for -ray emission at energies TeV. The large 3.5∘ FWHM field of view of H.E.S.S. is ideal for viewing a range of targets at various sizes including the Coma cluster core, the radio-relic (1253+275) and merger/infall (NGC 4839) regions to the southwest, and features greater than away.
Results. No evidence for point-like nor extended TeV -ray emission was found and upper limits to the TeV flux for , , and TeV were set for the Coma core and other regions. Converting these limits to an energy flux the lowest or most constraining is the TeV upper limit for the Coma core (0.2∘ radius) at 8% Crab flux units or ph cm-2 s-1.
Conclusions. The upper limits for the Coma core were compared with a prediction for the -ray emission from proton–proton interactions, the level of which ultimately scales with the mass of the Coma cluster. A direct constraint using our most stringent limit for 5 TeV, on the total energy content in non-thermal protons with injection energy spectrum and spatial distribution following the thermal gas in the cluster, is found to be 0.2 times the thermal energy, or erg. The 5 TeV -ray threshold in this case corresponds to cosmic-ray proton energies 50 TeV. Our upper limits rule out the most optimistic theoretical models for gamma ray emission from clusters and complement radio observations which constrain the cosmic ray content in clusters at significantly lower proton energies, subject to assumptions on the magnetic field strength.
Key Words.:
gamma rays: observations - galaxies: clusters: individual: Coma (ACO 1656)1 Introduction
Clusters of galaxies represent the largest gravitationally bound objects in the Universe and are thought to be ideal sites for the acceleration of particles. The very long confinement time (of order the Hubble time) of the accelerated particles (see e.g. Völk et al. Voelk:1 (1996), Berezinsky et al. Berezinsky:1 (1997)) would allow interactions of the particles with ambient matter and radiation fields to produce non-thermal emission from radio to TeV -ray energies. Particles are thought to be accelerated at large-scale shocks associated with accretion and merger processes (see e.g. Colafrancesco et al. Cola:1 (1998), Ryu et al. Ryu:1 (2003)), in supernova remnants and galactic-scale winds (Völk et al. Voelk:1 (1996)), turbulent re-acceleration (Brunetti & Blasi Brunetti:2 (2005)) and dark matter annihilation (e.g. Colafrancesco et al. Cola:2 (2006)). In addition, particles may be re-distributed/injected throughout the cluster volume via AGN cluster members (Enßlin et al. Ensslin:1 (1997), Aharonian Ahar:1 (2002), Hinton et al. Hinton:2 (2007)), The non-thermal radio emission observed in recent years from several galaxy clusters (Giovannini et al. Giovannini:1 (1993), Feretti et al. Feretti:1 (2004)) represents clear evidence for relativistic particle populations in such objects. Further evidence is provided by possible non-thermal X-rays observed from a few clusters (Rephaeli & Gruber Rephaeli:1 (2002), Fusco-Femiano et al. Fusco:1 (2004), Eckert et al. Eckert:1 (2007)).
Gamma-ray emission in galaxy clusters may come from several processes (see review by Blasi et al. Blasi:2 (2007)). The collision of relativistic cosmic-ray (CR) protons with thermal nuclei comprising the intra-cluster medium (ICM) may lead to -ray emission via the decay of neutral pions (Dennison Dennison:1 (1980)). In this context the fraction of thermal energy in the cluster volume in the form of relativistic non-thermal particles is an important parameter that can determine the level of -ray emission expected. Since the thermal energy content is a function of the cluster mass, the most massive and nearby clusters present the best opportunity to probe for such -ray emission. Ultra-relativistic electrons can also up-scatter target photons such as the cosmic microwave background (CMB), infrared, starlight, and other soft photon fields) to TeV -ray energies (Atoyan & Völk Atoyan:1 (2000), Gabici et al. Gabici:1 (2003, 2004)). Given that galaxy clusters may accelerate particles to ultra high energies (UHE) eV (e.g. Hillas Hillas:1 (1984), Kang et al. Kang:1 (1996)), -ray production from inverse-Compton scattering by secondary electrons generated when a UHE proton interacts with a CMB photon in the Bethe-Heitler process () may also result (Inoue et al. Inoue:1 (2005), Kelner & Aharonian Kelner:2 (2008)). Dark matter annihilation has also been considered as a -ray production channel (e.g. neutralino annihilation by Colafrancesco et al. Cola:2 (2006)).
Earlier observations in the MeV to GeV -ray band with EGRET only found upper limits only for several clusters (Reimer et al. Reimer:0 (2003)) including the Coma cluster. At TeV energies, upper limits (Perkins et al. Perkins:0 (2006)) have been reported for the Perseus and Abell 2029 clusters using the single-dish Whipple telescope. The most recent TeV observations with stereoscopic instruments such as H.E.S.S. (Abell 496 and Abell 85 — Aharonian et al. HESS-Abells (2008)), and with VERITAS (Coma — Perkins et al. Perkins:1 (2008)), revealed also upper limits. This work focuses on H.E.S.S. observations of the Coma cluster.
Coma (ACO 1656) is one of the nearest (z=0.023) and best-studied galaxy clusters. Extended (several arcminutes in scale) hard X-ray emission (with so far weak evidence for a non-thermal component) has been observed (Rephaeli & Gruber Rephaeli:1 (2002), Fusco-Feminano et al. Fusco:1 (2004), Rossetti et al. Rossetti:1 (2004), Lutovinov et al. Lutovinov:1 (2008), Ajello et al. Ajello:1 (2009)), as well as a prominent non-thermal radio halo (Giovannini et al. Giovannini:1 (1993), Thierbach et al. Thierbach:1 (2003)). The latter is clear evidence for particle acceleration. Being one of the most massive () and nearby clusters, with detailed multiwavelength observations ranging from low frequency radio wavelength to -rays, the Coma cluster has always been considered as the prototypical cluster also for very high energy -ray studies. The Coma cluster is located in the northern hemisphere and is visible by H.E.S.S. at moderately high zenith angles (average value ), which leads to a relatively high energy threshold (defined as the peak detection rate for an power-law spectrum of -rays) of TeV. Since the -ray spectrum from clusters is expected to be hard and extend beyond 10 TeV (basically limited only by the absorption of -ray photons in the cosmic infrared background. At the Coma cluster distance, an optical depth of unity is reached for energies 10 to 20 TeV.), the energy threshold does not constitute a serious problem for our investigation.
2 H.E.S.S. observations and analysis
Operating in the Southern Hemisphere, H.E.S.S. consists of four identical 13 m diameter Cherenkov telescopes (Bernlöhr et al. Bernlohr:1 (2003)). H.E.S.S. employs the stereoscopic imaging atmospheric Cherenkov technique, and is sensitive to -rays above an energy threshold of 0.1 TeV (Hinton et al. Hinton:1 (2004)) for observations at zenith. An angular resolution of 5 to 6′ on an event-by-event basis is achieved, and the large field of view (FoV) with (Aharonian et al. 2006b ) permits survey coverage in a single pointing. A point source sensitivity of 1% Crab flux ( erg cm-2s-1 at 1 TeV) is achieved for a 5 detection after 25 hr observation. Further details concerning H.E.S.S. can be found in Hinton (Hinton:1 (2004)) and references therein.
H.E.S.S. observed Coma during the 2006 season for a total of 8.2 hr (corrected for the detector deadtime) comprising 19 runs of duration 28 min each. Those runs were accepted for data analysis if they met the quality control criteria described in Aharonian et al. HESS_Calibration (2004). Data were analysed using the moment-based Hillas analysis procedure described in Aharonian et al. (2006b ). Minimum cuts on the Cherenkov image size111Total photoelectron signal in the Cherenkov image. of 80 and 200 photoelectrons corresponding to standard and hard cuts were employed. The average zenith angle of the dataset was 53∘ yielding energy thresholds (peak detection rate for a power law source spectrum with an exponent of ) of 1.1 TeV and 2.3 TeV for standard and hard cuts analyses. This analysis follows on from preliminary H.E.S.S. results (Domainko et al. Domainko:1 (2007)).
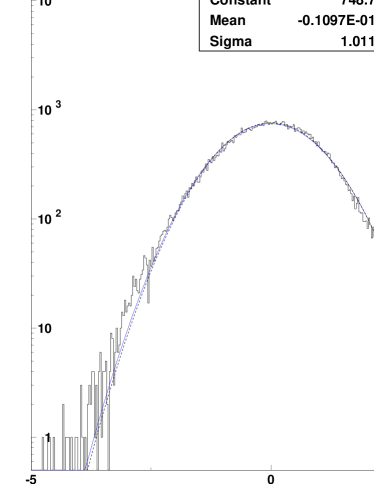
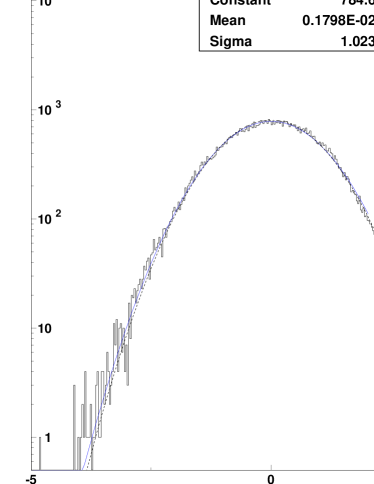
The large FoV of H.E.S.S. is well-suited to Coma as TeV emission could be expected from a variety of sites — the central radio halo or core; the radio-relic and adjacent galaxy merger/infall region; the degree-scale accretion shock suspected to surround the cluster (e.g. Voit Voit:1 (2005)), and individual member galaxies. TeV -ray significance skymaps covering a 7 FoV (from a mosaic of pointings) are presented in Fig. 1), employing oversampling radii of 0.2∘, appropriate for moderately extended sources in the Coma field. Skymaps employing a 0.1∘ oversampling radius (Fig. 2) for pointlike sources are available in the appendix. The CR background estimate in skymaps shown here is based on the template-model (Rowell Rowell:1 (2003)), employing a region spatially overlapping the source region but not containing any -ray-like events. Also available in the appendix are the distributions of skymap significances (Fig. 3) which are well-explained by Gaussians with standard deviation within a few percent of unity and means very close to zero, indicating that the background estimate performs well over the FoV. Similar results were also obtained when employing alternative CR background estimates such as the ring/ring-segment and reflected region models (Berge et al. Berge:1 (2007)) which were used for upper limit calculations (in Table 1). Results were also cross-checked using an alternative analysis chain.

Table 1 summarises results for various locations in the Coma field guided by results from the ROSAT all sky survey (Briel et al. Briel:1 (1992), Voges et al. Voges:1 (1999)), XMM-Newton observations (Feretti & Neumann Feretti:2 (2007)) and Arecibo-DRAO radio observations (Kronberg et al. Kronberg:1 (2007)). The H.E.S.S. TeV excess significance and flux upper limits (for an spectrum and using the method of Feldman & Cousins (Feldman:1 (1998))) for , , and TeV were taken from standard, hard, and hard cuts analyses respectively. CR background estimates were taken from the reflected model (Berge et al. (Berge:1 (2007))).
In X-rays, extended emission from the Coma cluster and emission further to the southwest are evident. The southwest thermal X-ray emission is not entirely spatially coincident with the radio-relic (discussed below), but is centred on the galaxy sub-group NGC 4839 (labeled NGC 4839 in Table 1), closer to the Coma cluster core compared to the radio-relic. This sub-group is thought to represent a merger or infall of galaxies associated with Coma. Hard X-ray (18–30 keV) observations with INTEGRAL (Eckert et al. Eckert:1 (2007)) suggest excess emission in the direction of this infalling sub-group close to the cluster centre. In radio, the Coma core is visible as well as a radio extension to the southwest known as the radio relic region (labeled 1253+275-Relic in Table 1). Two additional regions were also chosen to overlap the diffuse radio features labeled ’A’ and ’B’ from Kronberg et al. (Kronberg:1 (2007)) (at 0.4 GHz) for which circular regions of radii 0.9∘ and 0.5∘ respectively were used. Radio ’A’ appears to well encompass the radio core of Coma which is discussed at length in Thierbach et al. (Thierbach:1 (2003)) from their GHz observations, whilst radio ’B’ is a new feature from Kronberg et al. (Kronberg:1 (2007)). In all cases no evidence for TeV emission was seen and 99% confidence level flux upper limits (assuming an spectrum) at several energy thresholds (, and TeV) were set. We note the highest excess significance feature at towards RA=12h55m Dec=27∘15′ is expected by chance given the number of independent trials () in the image.
| Name | 1RXS | R.A. | Dec | 1RoI [deg] | [h] | 3 [] | Flux U.L. | ||||
| [J2000.0] | [J2000.0] | (1,5,10 TeV) | (1,5,10 TeV) | ||||||||
| Coma Core | J125947.9+275636 | 12h59m47.9s | 27∘56′36′′ | 0.0 | 7.3 | -0.5 | -1.2 | -1.4 | 6.1 | 0.3 | 0.1 |
| 0.2 | 7.3 | +0.4 | -0.4 | -0.6 | 10.8 | 0.9 | 0.5 | ||||
| 0.4 | 7.3 | +1.1 | -0.5 | -1.5 | 25.5 | 1.7 | 0.6 | ||||
| 1253+275-Relic§ | 12h55m15.0s | 27∘15′00′′ | 5.7 | +1.3 | +2.0 | +1.0 | 15.9 | 2.6 | 1.2 | ||
| Radio-A | 12h55m00.0s | 28∘00′00′′ | 0.9 | 4.6 | +2.0 | -2.2 | -2.0 | 78.7 | 2.3 | 1.4 | |
| Radio-B | 13h00m00.0s | 30∘15′00′′ | 0.5 | 1.6 | +2.5 | +0.7 | +0.0 | 77.8 | 7.0 | 3.4 | |
| NGC 4839 | J125710.8+272426 | 12h57m24.3s | 27∘29′52′′ | 0.2 | 6.8 | +0.4 | +1.7 | +1.2 | 9.0 | 1.9 | 1.0 |
| 0.4 | 6.8 | -1.8 | +0.3 | +0.1 | 6.7 | 2.0 | 1.3 | ||||
| Source Region of Interest (RoI) intrinsic radius. Actual radii used are convolved with the analysis PSF. A zero value here refers to a point-source analysis. | |||||||||||
| Observation time (hr) corrected to a 0.7∘ off-axis angle using a standard cuts TeV response curve. | |||||||||||
| Statistical significance using Li & Ma (Li:1 (1983)) | |||||||||||
| 99% C.L. flux upper limit ph cm-2 s-1 | |||||||||||
| Elliptical region ( with position angle 45∘) as defined in Feretti & Neumann (Feretti:2 (2007)) | |||||||||||
3 Discussion
One of the most important properties of clusters of galaxies is the fact that CR protons remain diffusively confined in the magnetised intracluster medium for cosmological time scales. The maximum energy that can be confined depends on the (unknown) diffusion coefficient but an often made assumption is that the maximum energy is well above that relevant for TeV -ray emission (Völk et al. Voelk:1 (1996)). CR protons lose their energy mainly via proton–proton interactions in the intergalactic medium. Due to the low density of this medium, the energy loss time is longer than the Hubble time. This implies that the hadronic CR content of a cluster is simply the superposition of the contributions from all the CR sources which have been active during the cluster lifetime, with little attenuation due to energy losses. Under reasonable assumptions on the CR acceleration efficiency, the total non-thermal energy stored in the intracluster medium might be of the same order of magnitude of the thermal energy. For example Ryu et al. (Ryu:1 (2003)) have estimated a non-thermal energy fraction reaching 50% of the thermal energy. Such an amount of CR protons would result in copious emission of -rays from the decay of neutral pions produced in proton–proton interactions. Since the most optimistic theoretical predictions are well within the capabilities of current-generation Cherenkov telescopes, the upper limits obtained by H.E.S.S. can be used effectively to constrain the non-thermal energy content of the Coma cluster.
A remarkable feature of the -ray emission from neutral pion decay is that its spatial profile is expected to follow the density profile of the gas which constitutes the target for proton–proton interactions. In the case of the Coma cluster, this gas is concentrated within a core of radius kpc which, at the distance of the Coma cluster, corresponds to (see discussion below). This is the basis for the angular regions from which upper limits have been extracted.
Table 2 demonstrates how the upper limits on the -ray emission convert into upper limits on the ratio of the cluster thermal energy to that of CR protons (non-thermal energy). This non-thermal to thermal energy ratio is denoted . The Coma cluster thermal energy has been evaluated using the gas density profile and the intracluster medium temperature derived from X-ray data (e.g. Neumann et al. Neumann:1 (2003)) and resulted in and erg for regions within 0.2 and 0.4 degrees from the cluster centre respectively. The expected -ray emission has been computed following Kelner et al. (Kelner:1 (2006)) and assuming that the energy spectrum for CR protons is a single power law with spectral index and 2.3 starting at an energy of 1 GeV. The assumption of such hard spectra is justified by the fact that, due to CR confinement within the intracluster medium, the equilibrium spectrum must be equal to the CR injection spectrum at the sources. Note that much steeper spectra ( up to 6) are indicated for CRs accelerated at weak merger shocks (Gabici & Blasi Gabici:1b (2003), Berrington & Dermer Berrington:1 (2003)). The cluster non-thermal energy has been obtained by integrating the spectrum above 1 GeV and the resulting -ray emission corrected for absorption in the cosmic infrared background (CIB) using the Salpeter initial mass function opacity given in Primack (Primack:1 (2001)). More recent constraints on the CIB from the TeV blazar 1ES 0229+200 (Aharonian et al. HESS-0229 (2007)) provide only a negligible change in absorption from 1 to 10 TeV given Coma’s proximity. Our upper limits can then be used to constrain this overall CR spectrum and hence non-thermal energy.
The only missing piece of information is the spatial distribution of CRs. This quantity is not unambiguously known and it depends on the spatial distribution of CR sources in clusters. Here, two distinct situations were considered as two extreme cases. In the first one, referred to as Model-A, the radial profile of the CR energy density was assumed to follow the thermal energy profile. In Model-B, a spatially homogeneous distribution for the CRs was assumed.
| Radius | Model | [erg] | ||
| 0.2∘ (0.33 Mpc) | 2.1 | A | 0.19 | 7.4 |
| 0.4∘ (0.67 Mpc) | 2.1 | A | 0.18 | 2.5 |
| 0.4∘ (0.67 Mpc) | 2.1 | B | 0.25 | 3.5 |
| 0.4∘ (0.67 Mpc) | 2.3 | A | 0.55 | 7.7 |
| The upper limit for TeV has been used here. | ||||
In all cases considered, the most constraining data points in terms of energy flux are the upper limits for photon energies above 5 TeV. Our 10 TeV limits are marginally higher (20%) whilst the 1 TeV limits are factor 2 to 3 higher. For a CR spectrum with and assuming that the CR energy density follows the thermal energy density (Model-A) values for for both the considered regions ( and ) were obtained. In order to check how the upper limits depend on the assumptions made on the CR spectrum and spatial distribution, the size of the region was fixed to and two more cases were considered: a homogeneous distribution of CRs (Model-B) and a softer CR spectrum with . The upper limits on are in these cases less stringent and are reported in the third and fourth rows of Table 2, resulting in and respectively. In combination with our limits for TeV and 10 TeV, model-independent constraints on the , , TeV CR proton population in Coma were set.
Our upper limits can be compared with those obtained from observations at other wavelengths and also other models. Firstly, our limits are slightly more constraining compared to those obtained from EGRET MeV/GeV data (=0.45 and 0.25 assuming =2.1, 2.3; Pfrommer & Enßlin Pfrommer:1 (2004)). Our limits also rule out some of the models for CR acceleration in clusters of galaxies that predict high values, even up to 50% (Ryu et al. Ryu:1 (2003)). The high frequency non-thermal radio emission of the Coma cluster (Thierbach et al. Thierbach:1 (2003)) has been used by Reimer et al. (Reimer:1 (2004)) to constrain by noticing that the radio emission from secondary electrons produced by CRs in proton–proton interactions cannot exceed the measured value. Recent observations (Brunetti et al. Brunetti:1 (2008)) of a steep radio spectrum from the cluster Abell 521 have also been considered in a similar way as in the Reimer et al. work on Coma. Their rather stringent limits obtained using radio data (=10-4 to 0.3) depend quadratically on the value of the intracluster -field which has a large uncertainty of a factor 10 (0.1 to 2G). Additionally the GHz radio measurement constrains formally the TeV CR population within the range of -fields used. ULs from H.E.S.S. and other VHE gamma-ray instruments make direct constraints on the TeV CR population, energies well above that implied by Reimer et al. (Reimer:1 (2004)), and are essentially independent of the -field. Note that an additional preliminary TeV upper limit from 19 hr of VERITAS (Perkins et al. Perkins:1 (2008)) observations for the Coma core (0.3∘ radius) has been reported at 3% Crab (or ph cm-2 s-1). This VERITAS limit, when converted to an energy flux, provides a constraint on very similar to ours, albeit for CRs of slightly lower energies few TeV. Finally, our constraints for Coma are within a factor of two to three larger than those obtained from somewhat deeper H.E.S.S. observations (33 hr) on the Abell 85 cluster ( M⊙; 0.055) (Aharonian et al. HESS-Abells (2008)). In this work, the constraints to for Abell 85 were reported for a range of mass profiles and a CR spectral index of 2.1.
4 Conclusions
H.E.S.S. observed the Coma galaxy cluster for 8 hr, obtaining upper limits to the , , and TeV -ray flux from the cluster core (0.2∘ and 0.4∘ radii). Additional regions for which upper limits are given include the radio-relic (1253+275); the merger/infall region associated with NGC 4839; and two large-scale radio features ’radio-A’ (0.9∘ radius) and ’radio-B’ (0.5∘ radius).
Our results were compared to a model for the proton-proton -ray emission assuming a proton spatial profile matching the centrally peaked thermal gas and injection spectral index of 2.1. In this case our TeV H.E.S.S. upper limit for the Coma core region within a 0.2∘ radius region (amounting to 8% Crab flux units or ph cm-2 s-1) constrains the fraction of energy in CRs to 0.2 times the thermal intracluster medium energy, or 1062 erg. This can be compared with the generally more stringent constraints on so far from radio observations (Reimer et al. Reimer:1 (2004)) in the range =10-4 to 0.3 times the thermal energy for -fields 0.1 to 2G in the intracluster medium and proton injection spectral index =2.1 to 2.5. It should be noted that the H.E.S.S. TeV upper limit assuming formally constrains TeV CRs whilst the radio limits pertain to TeV CRs, highlighting the complementarity of the two approaches. The H.E.S.S. constraints for the amount of CRs stored in the intracluster medium also rule out the most optimistic theoretical models for CR acceleration in clusters of galaxies.
Our upper limit for the NGC 4839 merger/infall group may also be useful, in conjunction with the hard X-ray emission, in constraining models for the additional shock acceleration of particles potentially associated with this region.
Our focus here has been on the expected centrally peaked proton-proton -ray emission, but emission expected from the inverse-Compton scattering of electrons, and UHE proton/ interactions may follow the spatial profile of the degree-scale cluster accretion shock as an annulus of radius . Inhomogeneities in the shock structure leading to TeV hotspots of up to degree in size (Keshet et al. Keshet:1 (2003)), and uncertainties in the shock size prevented a specific attempt to search for such emission. TeV -ray observations can in principle provide direct constraints on the ability of such shocks to accelerate particles to multi-TeV energies and beyond. The significance skymap presented in Fig. 1 for 0.2∘ radii sources would suggest however that no such evidence for moderate-scale emission in the Coma field is present. Indeed, similar skymaps are obtained for a 0.4∘ radius.
Overall our results indicate that deeper observations (towards hr) of the Coma cluster, or other similarly massive and nearby galaxy cluster in TeV -rays, are warranted to probe the Universe’s largest-scale shocks. Such a detection appears possible unless the total energy in the form of multi-TeV CRs is significantly less than % of the cluster thermal energy.
Finally, the recently launched LAT instrument onboard the Fermi GST will provide critical constraints in the MeV/GeV band (likely within its first year or so of observation) and these results are eagerly awaited.
Acknowledgements.
The support of the Namibian authorities and of the University of Namibia in facilitating the construction and operation of H.E.S.S. is gratefully acknowledged, as is the support by the German Ministry for Education and Research (BMBF), the Max Planck Society, the French Ministry for Research, the CNRS-IN2P3 and the Astroparticle Interdisciplinary Programme of the CNRS, the U.K. Particle Physics and Astronomy Research Council (PPARC), the IPNP of the Charles University, the Polish Ministry of Science and Higher Education, the South African Department of Science and Technology and National Research Foundation, and by the University of Namibia. We appreciate the excellent work of the technical support staff in Berlin, Durham, Hamburg, Heidelberg, Palaiseau, Paris, Saclay, and in Namibia in the construction and operation of the equipment. We thank Philipp Kronberg for the 408 MHz radio image.References
- (1) Aharonian F. 2002, MNRAS, 332, 215
- (2) Aharonian F. et al. (H.E.S.S. Collab.) 2004 Astropart. Phys. 22, 109
- (3) Aharonian F. et al. (H.E.S.S. Collab.) 2006b A&A 457, 899
- (4) Aharonian F. et al. (H.E.S.S. Collab.) 2007 475, L9
- (5) Aharonian F. et al. (H.E.S.S. Collab.) 2008 A&A in press arXiv:0812.1638
- (6) Ajello M., Rebusco P, Cappelluti N. et al. 2009 ApJ 690, 367
- (7) Atoyan A.M., Völk H.J. ApJ 2000 535, 45
- (8) Berezinsky V.S., Blasi P., Ptuskin V.S. 1997 Ap.J. 487, 529
- (9) Berge D., Funk S., Hinton J. 2007 A&A 466, 1219
- (10) Bernlöhr K., et al. APh 2003 20, 111
- (11) Berrington R., Dermer C.D. 2003 ApJ 594, 709
- (12) Blasi P. 1999 ApJ 525, 603
- (13) Blasi P., Gabici S., Brunetti G. 2007 Int.J.Mod.Phys. A22, 681
- (14) Briel U.G., Henry J.P., Böhringer H. 1992 A&A 259, L31
- (15) Brunetti G., Blasi P. 2005 MNRAS 363, 117
- (16) Brunetti G., Giacintucci S., Cassano R. et al. 2008 Nature 455, 944
- (17) Colafrancesco S., Blasi P. 1998 APh 9, 227
- (18) Colafrancesco S., Profumo S., Ullio P. 2006 A&A 455, 21
- (19) Dennison B. 1980 ApJ 239, L93
- (20) Domainko W. et al. 2007 in Proc. 30th ICRC (Mexico) arXiv:0708:1384
- (21) Eckert D., Neronov A., Courvoiier T.L.-J., Produit N. 2007 A&A 470, 835
- (22) Enßlin T. A., Biermann, P. L., Kronberg, P.P., Wu, X.P. 1997, ApJ, 477, 560
- (23) Feldman G.J., Cousins R.D. 1998, Phys. Rev. D 57, 3873
- (24) Feretti L., Brunetti G., Giovannini G. et al. 2004 JKAS 37, 315
- (25) Feretti L., Neumann D.M. 2006 A&A 450, L21
- (26) Fusco-Femiano R., Orlandini M., Brunetti G. 2004 et al. ApJ 602, 73
- (27) Gabici S., Blasi P. 2003 APh 19, 679
- (28) Gabici S., Blasi P. 2003 ApJ 583, 695
- (29) Gabici S., Blasi P. 2004 APh 20, 579
- (30) Giovannini G., Feretti L., Venturi T., et al. 1993, ApJ 406, 399
- (31) Hillas A.M. 1984 Ann. Rev. Astron. Astrophys. 22, 425
- (32) Hinton J.A. 2004 New Astron. Rev. 48, 331
- (33) Hinton J.A., Domainko W., Pope E.C. 2007 MNRAS 382, 466
- (34) Inoue S., Aharonian, F., Sugiyama N. 2005 ApJ 628, L9
- (35) Kang H., Ryu D. & Jones T.W. 1996 ApJ 456, 422
- (36) Kelner S.R., Aharonian F.A., & Bugayov V.V. 2006 Phys. Rev. D 74, 034018
- (37) Kelner S.R., Aharonian F.A. 2008 Phys. Rev. D 78, 034013
- (38) Keshet U., Waxman E., Loeb V. et al. 2003 ApJ 585, 128
- (39) Kronberg P.P., Kothes R., Salter C.J., Perillat P. 2007 ApJ 659, 267
- (40) Loeb A., Waxman E. 2000 Nature 405, 156
- (41) Li T., Ma Y. 1983, ApJ 272, 317
- (42) Lutovinov A.A. et al. 2008 arXiv:0802.3742
- (43) Neumann, D.A. et al. 2003 A&A 400 , 811
- (44) Perkins J., Badran H., Blaylock G. et al. 2006 ApJ 644, 148
- (45) Perkins J. et al. (VERITAS Coll.) in Proc. Heidelberg Gamma-Ray Symp. 2008 arXiv:0810.0302
- (46) Pfrommer C, Enßlin T.A. 2004 MNRAS 352, 76
- (47) Primack J. 2001 AIP Conf. 558, 463
- (48) Reimer O., Pohl M., Sreekumar P., Mattox J.R. 2003 ApJ 588, 155
- (49) Reimer A., Reimer O., Schlickeiser R., Iyudin A., 2004 A&A 424, 773
- (50) Rephaeli M., Gruber D. 2002 ApJ 597, 587
- (51) Rossetti Y., Molendi S. 2004 A&A 414, L41
- (52) Rowell G.P. 2003 A&A 410, 389
- (53) Ryu D., Kang H., Hallman E., Jones T.W. 2003 ApJ 593, 599
- (54) Thierbach M., Klein U., Wielebinski R. 2003 A&A 397, 53
- (55) Völk H., Aharonian F.A., Breitschwerdt D. 1996 SSRv 75, 279
- (56) Voges W., Aschenbach B., Boller Th. et al. 1999 A&A 349, 389
- (57) Voit G.M. 2005 Rev. Mod. Phys. 77, 207
Appendix A Additional Figures
H.E.S.S. images as for Fig.1 but using a 0.1∘ integration radius are presented here as well as distributions of significances for both integration radii.