Specific Heat Studies of Pure Nb3Sn Single Crystals at Low Temperature
Abstract
Specific heat measurements performed on high purity vapor-grown Nb3Sn crystals show clear features related to both the martensitic and superconducting transitions. Our measurements indicate that the martensitic anomaly does not display hysteresis, meaning that the martensitic transition could be a weak first or a second order thermodynamic transition. Careful measurements of the two transition temperatures display an inverse correlation between both temperatures. At low temperature specific heat measurements show the existence of a single superconducting energy gap feature.
pacs:
I Introduction
Nb3Sn is a well known intermetallic compound with the cubic A15 structure at room temperature. It displays two interesting features at low temperature, a cubic-to-tetragonal martensitic transformation in the range = 40-50 K, and a superconducting transition at about = 18 K mail67 ; mail67a ; Weger71 . The martensitic transition has generated a great deal of interest but it is still not completely understood. Theoretical and experimental results are not conclusive about the order of the martensitic anomaly. Early specific heat studies did not give clear evidence about the thermodynamic order of the transition, nor if there is a correlation between the martensitic and superconducting transitions temperatures. In addition, recently specific heat measurements in the superconducting state of Nb3Sn samples prepared by solid state diffusion reaction, have been interpreted as showing the presence of an intrinsic second superconducting gap, affecting the electronic density of states guri04 .
One reason for this lack of understanding of the cubic-tetragonal transformation is that this thermodynamic anomaly was not clearly observed in early heat-pulse calorimetry studies. This may be due to noise in the data vieland69 , anomaly too small in the total specific heat in ac calorimetry chu74 , or the absence of the anomaly guri04 . It has been inferred, however, that the cubic to tetragonal transformation must be a first order thermodynamic transition, with a proposed Jahn-Teller mechanism vieland71 ; labbe66 which should be observable as hysteresis in specific heat measurements through the transition, and in entropy measurements. It is very important to mention at this point that a martensitic transition must be necessarily a first order thermodynamic transition, showing a hysteretic behavior in the specific heat and in resistivity-temperature measurements Tsumura88 ; Makita . In fact in materials displaying this kind of transformations, as the Al-Cu-Zn alloy, which can be considered as the prototype martensitic alloy Lovey , where a phase transformation is observed from an ordered b.c.c () parent phase to an ordered 18R phase, at different temperatures depending on composition Tsumura88 ; Lovey . In specific heat measurements one can observe the typical hysteresis of the thermodynamic transition at two different temperatures, as well in transport measurements. For the Nb3Sn case this hysteresis has not been observed with enough precision. Among the reasons for the lack of observation of this anomaly, could be non-optimal characteristics of the samples, internal stress, samples with incorrect stoichiometry, compositional inhomogeneity, or inclusive technical deficiencies of the experimental equipment when performing the specific heat measurements testardi75 . It is important to mention that frequently this A15 alloy, presents impurities due to formation of other compositions and inclusive Sn excess has been often observed. There are two important characteristics about this alloy that must be understood. The first one is related to the debate about the order of the high temperature transition; the so called martensitic anomaly. The other is about the influence of the martensitic transition on the electronic density of states, and therefore on the superconducting transition temperature weber82 . Respect to the first point, Labbe and Friedel labbe66 in their studies related to the cubic to tetragonal transition proposed that it may involve a Jahn-Teller distortion, occurring in the crystalline structure by the effect of the one-dimensional Nb chains. These chains are one of the crystallographic features of the A15 compounds. From this point of view calculations based on electron sub-bands models have predicted that the cubic to tetragonal transition is first order. However, experimentally Vieland and co-workers vieland71 presented only indirect evidence that the structural transition is first order (indirect in the sense that the thermodynamic order was inferred from non-thermodynamic measurements), as predicted by theories invoking a band Jahn-Teller distortion. Nevertheless, other experimental results have shown an absence of latent heat and hysteresis at the transition temperature, which has been interpreted as evidence for a thermodynamic transition of the second order vieland69 . Lastly, we must mention that another physical possibility of the martensitic transformation in this compound could be related to a Peierls distortion, particularly in this case, of the formation of a Charge Density Wave (CDW) promoted by the infinitum Nb chains, as was theoretically formulated by Gorkov, Bhatt and McMillan.
The aim of this work is two fold; clarify the role of the so called martensitic transition on the superconducting temperature, and to prove the possible existence of two superconducting energy gaps, as recently claimed. The results of this investigation can be resumed in the following: Thermodynamics characteristics of seven Nb3Sn single crystals were determined by mean of specific heat measurements. The results show the clear martensitic anomaly around 50 K, and this does not display hysteretic behavior, as expected for a first order thermodynamic transition. Thus, suggesting a weak first order or a second order transition.
We observe a clear correlation between the superconducting and the so called martensitic transition temperatures. In addition we observed in the specific heat measurements at low temperatures the existance of only a feature related with the presence of only a single energy gap.
In addition, in order to corroborate that our results are obtained in good specimens, we performed X-ray diffraction analysis which show that the samples are single crystals.
II Experimental Details
The Nb3Sn samples were grown over a period of four months by closed-tube vapor transport with iodine vapor as the transport agent. From the batch of samples were selected seven single crystalline specimens for our measurements, they consist of just one to several crystals with mm-size. Crystallographic characteristics where examined at room temperature by X-ray diffraction, using a Siemens P4 diffractometer equipped with Mo-K radiation (=0.71073 Å).
Electrical resistivity was determined by the four probe method. These samples were found to have resistivity ratio (300 K)/ = 18 and an extrapolated residual resistivity ratio of (300 K)/(0 K) = 50, indicating the high degree of purity and crystalline perfection arko78 . Early studies with these crystals were performed up to 18 Tesla as reported by Stewart, Cort and Webb stewart81 . As an antecedent of the quality of the crystals, some of the oriented single crystals from this same batch were used for dHvA oscillation studies of the Fermi surface arko78 . The crystals were measured and characterized by magnetization versus temperature, resistance versus temperature, and specific heat versus temperature in order to study the characteristics of the so-called martensitic transformation and the superconducting transition temperature.
| Compound | NS1 (5.31 mg) | NS4 (9.5 mg) |
|---|---|---|
| Empirical formula | Nb3Sn | Nb3Sn |
| Formula weight | 397.42 | 397.42 |
| Color, habit | Metallic, irregular | Metallic, prism |
| Crystal size [mm] | 0.3 0.2 0.2 | 0.4 0.4 0.4 |
| Space group | P m-3n | P m-3n |
| a [Å] | 5.2700(9) | 5.2531(13) |
| V [Å3] | 146.36(4) | 144.96(6) |
| Z | 2 | 2 |
| [g cm-3] | 9.018 | 9.105 |
| [mm-1] | 19.54 | 19.73 |
| 2 Range [∘] | 11 - 70 | 11 - 70 |
| Reflections collected | 2147 | 1958 |
| 53 | 109 | |
| Independent reflections (Rint) | 72 (0.1978) | 69 (0.1953) |
| Completeness [%] | 97.2 | 95.8 |
| Transmission factors [min., max.] | 0.015, 0.348 | 0.014, 0.347 |
| Final indices (all data) , | 0.054, 0.105 | 0.062, 0.167 |
| Goodness-of-fit on | 1.399 | 1.309 |
| Extinction coefficient | 0.82(18) | 0.8(2) |
| Data / restraints / parameters | 72 / 0 / 5 | 69 / 0 / 5 |
| Largest difference peak / hole [e. Å-3] | 4.369, -1.789 | 4.238, -2.807 |
| Final Geometric Parameters | ||
| Distance | ||
| Nb-Sn (Å) | 2.9460 (5) | 2.9366 (7) |
| Nb-Nb (Å) | 2.6350 (5) | 2.6266 (6) |
| Nb…Nb (Å) | 3.2272 (5) | 3.2169 (8) |
Specific heat measurements were performed between room temperature and 2 K under magnetic field below 0.1 Oe, using a thermal relaxation technique with a Quantum Design PPMS calorimeter. Calibrated addenda corrections for the sample holder were subtracted, thus the specific heat measurements show the corrected values for all samples. In the range from 2-60 K measurements were taken in multiple cooling and warming cycles.
III Results and Discussion
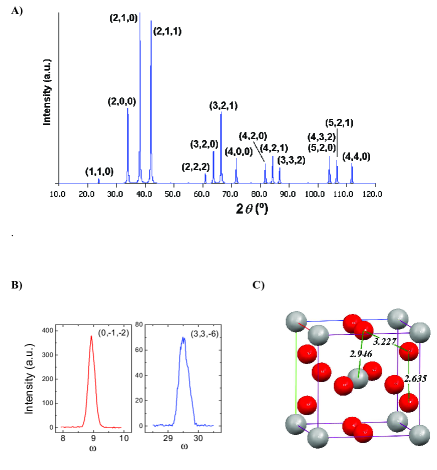
For the crystalographic characterization we studied two typical samples by X-ray diffraction, hereafter called NS1 and NS4, with mass about 5.31 and 9.5 mg, respectively. X-ray characteristics were taken at a temperature of 298(1) K using a Siemens P4 diffractometer equipped with Mo-K radiation( =0.71073 Å). Although samples are large and display somewhat irregular shapes, they revealed to be single crystals, as reflected by well defined, symmetric Bragg diffraction peaks, see panel A of Fig. 1. This Fig. shows the refined data obtained by computing generated spectrum of the diffraction pattern of the single crystal NS1, whereas the panel B shows two reflections at two particular positions in the the reciprocal space. In this lower panel corresponds to the Bragg angle which according to the diffractometer geometry corresponds to /2. The two reflections, one at low angle , the another at high angle at . are representative features for a good single crystal. The reflection peaks at low angles necessarily needs to have four characteristics: a single well defined maximum, the peak must be highly symmetric, a ratio signal to noise high, and the same amount of noise at the left and right of the peak. The reflection at (0,-1,-2) presents those characteristics. Whereas the peaks at high angle must have preferentially, the higher ratio signal to noise, they can be non-symmetric because the monochromaticity of the diffraction apparatus need to be taken into account due to the two contribution of the X-ray diffraction beam (KαI + KαII). Thus, accordingly the ratio signal to noise is necessarily low due to the fact that the atoms scattering factor decreases as the Bragg angle increases. This is intrinsic to any crystal, good or with low quality. In the NS1 crystal, the reflection at (3,3,-6) show clearly the peak well defined, the noise is constant at the two ends of the peak, this meaning that the crystal presents an ideal crystallinity. In addition, we remark that no secondary diffraction patterns were observed for possible impurities, neither diffuse scattering. For each sample, a complete diffraction sphere was collected siemens at the highest available resolution (0.62 Å, 2 = 70∘). As expected, crystals belong to space group Pm-3n and the structure of Nb3Sn is an A15-type arrangement, as previously described testardi75 . Atomic positions were refined sheldrick on the basis of absorption-corrected data walker . A characteristic parameter in a crystal is the high value of the extinction coefficient, which converges to identical values for both samples: so in those crystals we found 0.82(18) for NS1 and 0.8(2) for NS4 sheldrick . Assuming that applied correction covers mixed primary and secondary extinctions, this result suggests that samples should have similar block sizes and similar concentrations of randomly distributed dislocations masimov .
In Table 1 we present many of the characteristics of two specimens measured. Both samples are characterized by rather short unit cell parameters, a = 5.2700(9) and a = 5.2531(13) Å, for NS1 and NS4, respectively, while the accepted value found in the literature for crystalline Nb3Sn is a = 5.29 Å pdf . Interestingly, NS1 and NS4 have significantly different cell parameters, and, as a consequence, cell volume is reduced by ca. 1% in NS4, compared to NS1. Calculated densities present the same 1% drop. However, using diffraction data, a confident interpretation of such a cell contraction in terms of intrinsic vacancies in the alloy cannot be carried out, at least if departures from Nb3Sn stoichiometry remain small. In contrast, the high resolution of diffraction data allows to accurately determine distances in the solid (Table 1). The shortest Nb…Nb separation is reduced from 2.6350(5) Å in NS1 to 2.6266(6) Å in NS4. In the same way, Nb…Sn separations in NS1 and NS4 are 2.9460(5) and 2.9366(7) Å, respectively.
The two samples examined by X-ray included in this work, NS1 and NS4, have two different characteristics in the high temperature anomaly, see Fig 2. Whereas NS1 has a very well defined sharp peak at the specific heat characteristic, which is starting at about 50 K, NS4 presents only a small feature starting at about 46 K. A possible interpretation about the sharpness of these two anomalies may be related to the crystalline structure; if Nb vacancies are present in the structure, then the cell parameters and volume will be reduced, as observed in samples NS1 and NS4. We may speculate that the implication of this behavior might be related to a Peierls distortion in the Nb chains gorkov73 ; bhatt76 . Thus, the charge density wave (CDW) created due to the distortion will open an energy gap in the direction of the chains, and possible better formed if the chains are without Nb vacancies, that if there exist deficiencies or vacancies. Therefore, this will reduce the size and sharpness of the anomaly.
We also can not discard another possibility; this may be due to the crystal inhomogeneities. As crystals start to grow, it is not surprising to observe sample to sample variations in the A15 structure, albeit differences comparing NS1 and NS4 samples which are considered small. As NS4 is a crystal with a bulk volume about two times that NS1, inhomogeneities may be seen as a natural consequence. However in our set of samples the slow growing process performed over a period of four months, the inhomogeneities may be very small and our first speculation related to CDW nesting can not be discarded. A last important evidence of the perfection of these crystals, is supported by studies in the same batch of samples by Arko et al., arko78 related to the Fermi surface with experiments of the de Haas-van Alphen effect, which agree considerable well with theoretical studies. In the de Haas-van Alphen experiments an important and necessary aspect is related to the inhomogeneities on the crystal structure under study. Those inhomogeneities must be as small as possible in order to observe features of the Fermi surface.
III.1 Specific Heat Measurements
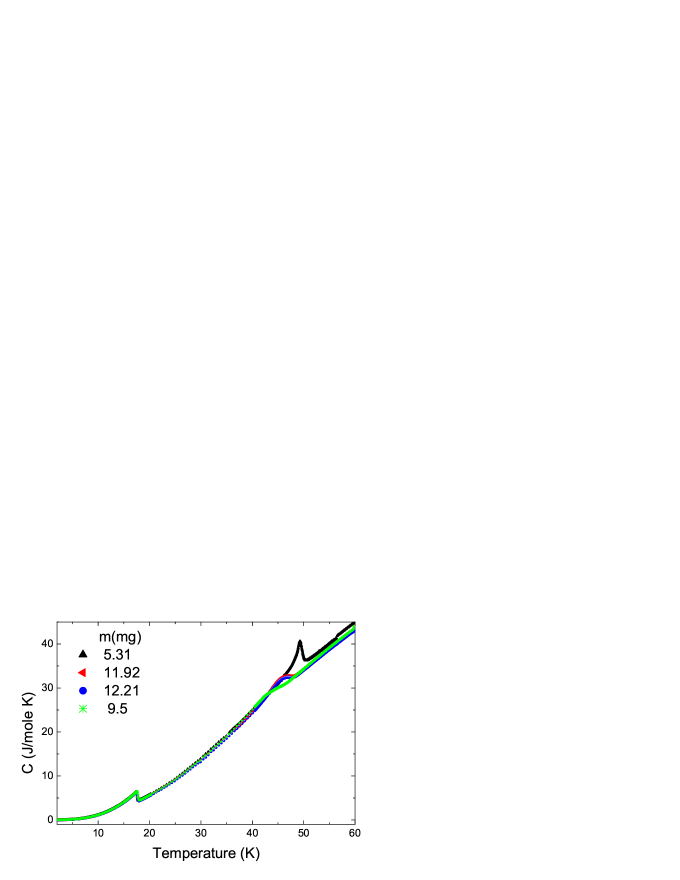
The specific heat measurements were performed as before was explained. In Fig. 2 we show data of four Nb3Sn samples measured in the interval from 2 to 60 K. An interesting characteristic in those measurements is the notable different shapes and temperatures of the high temperature anomaly in the specimens. Whereas the superconducting transition temperature at about 18 K almost presents only a small variation in size and temperature.
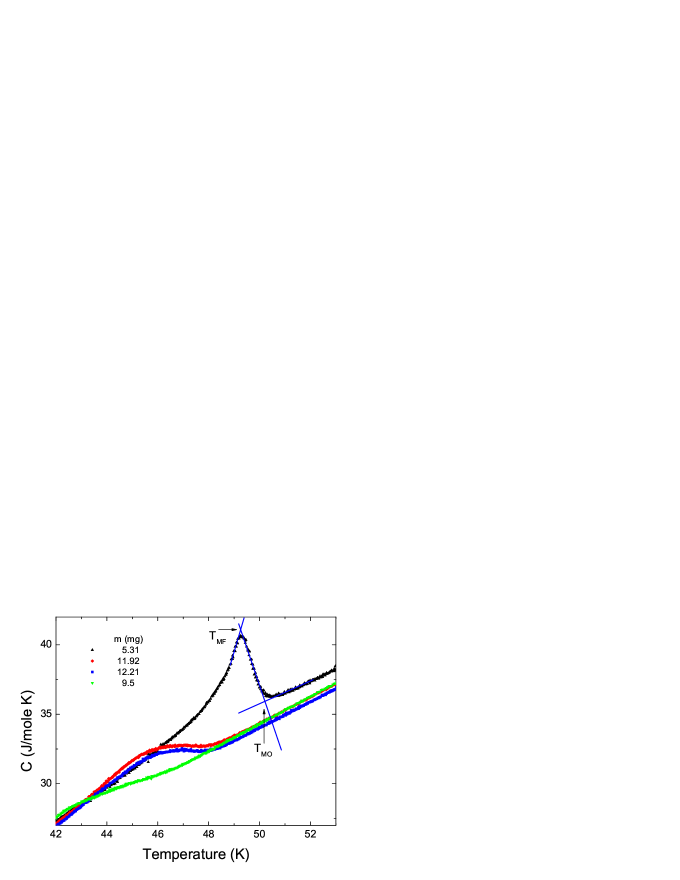
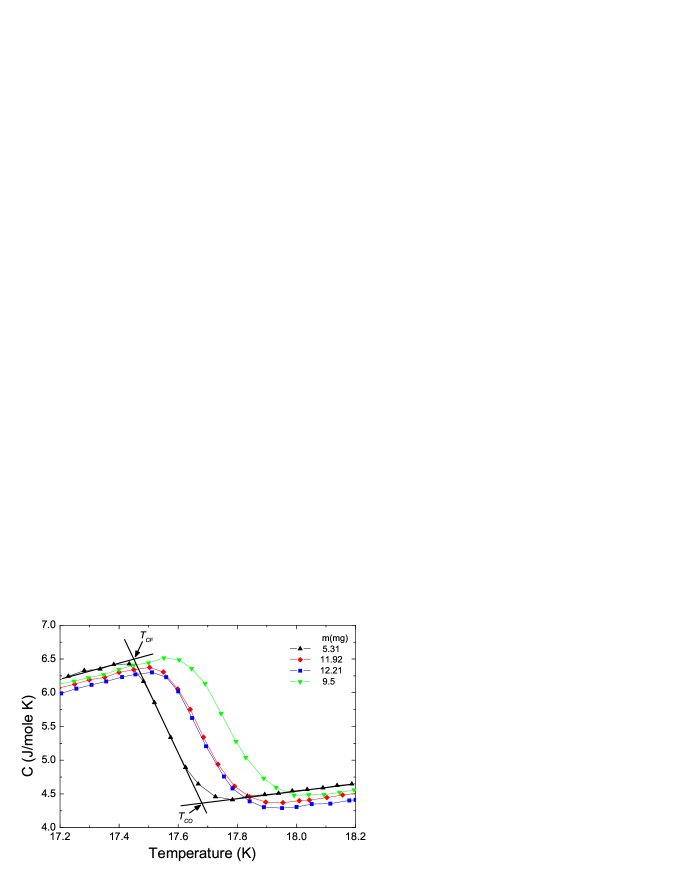
Fig. 3 depicts the specific heat of the four samples of Nb3Sn crystals, the martensitic anomaly () occurs in the interval from 42 to 53 K, the martensitic anomaly presents different sizes. In this plot the curves were measured in cooling and warming cycles, there are no hysteresis at all; thus suggesting a weak first or second order thermodynamic transition. Some of these curves display a much clearer anomaly at than has been observed before vieland69 ; chu74 . In Fig. 4 the superconducting transitions of the same samples of Fig. 3 are displayed. The superconducting transition temperature onsets have a small but discernible differences between the four samples, with the high onset for the mg sample and the minimum for the mg sample. The manner that we used for the determination of the transition temperatures; onsets and finals, is also show in Fig. 4. There the straight lines intersections indicate the transition temperatures.
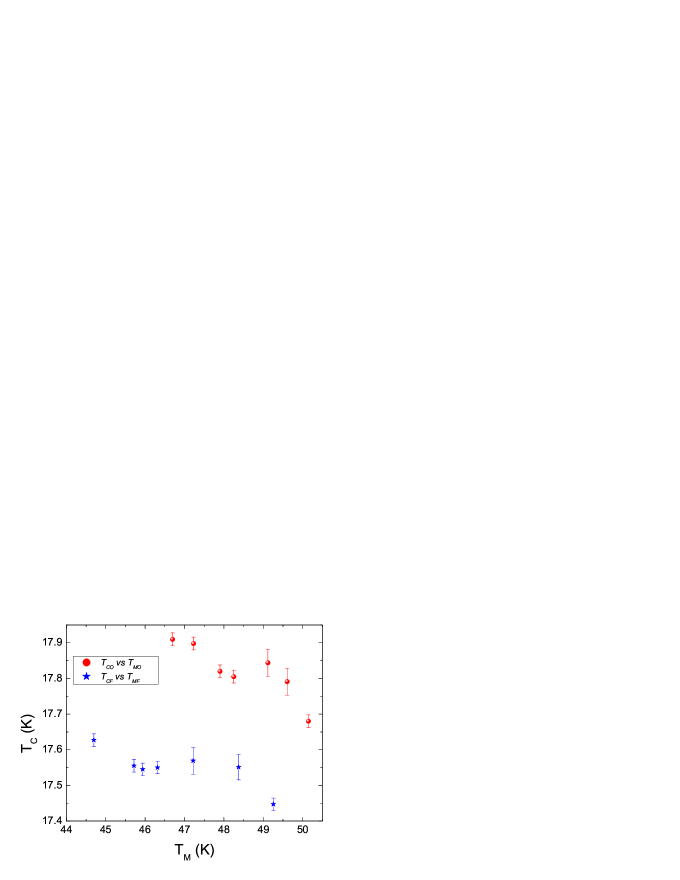
In Fig. 3, and 4 can be observed slight but discernible differences in the onsets of the superconducting transition temperatures, and on the sizes and widths of the martensitic transitions. Note that there is a trend, outside of experimental error, between the two transitions; the superconducting temperature onset decreases as the martensitic temperature onset increases. The differences between samples could arise, independently from different amounts of strain or slight differences in composition, or from an intrinsic physical property between the two transitions, as mentioned before. The total variation of is small, but quite measurable, however the total variation of is large. It is perhaps not surprising that among the seven crystals displays such a small variation since they were taken from the same batch and experienced very similar growth conditions. For the same reason, however, it is surprising that displays such a large variation, namely ten times that of the change. In Fig. 5 we show the superconducting transition temperature as a function of the martensitic transition temperature from the seven measured samples. There, we include data of the onset temperatures, superconducting and martensitic , and the superconducting and martensitic temperatures at the end of the transition. A very clear correlation is observed between TC and TM. It is important to note in this figure the size of the errors bars. In some measurements with some samples, it was quite difficult to distinguish the onsets and finals points of the transition temperature on the experimental curves. So in that case the bars are large.
The physical property that could link and is the density of electronic states at the Fermi level. Thus, if the martensitic transition temperature and the size of the peak anomaly decreases, the changes will increase the density of electronic states available for the superconducting transition. This behavior is at least consistent with the idea of a charge density wave (CDW) associated to the martensitic transformation as proposed initially by Gor’kov gorkov73 and continued by Bhatt and McMillan bhatt76 using the Landau theory. This theory presents the possibility of a competition for the Fermi surface by the CDW and superconductivity in order to lower the total energy of the system by opening a CDW energy gap, and therefore using some electron population.
In order to confirm the absence of hysteresis in the specific heat around the martensitic transition in Nb3Sn, we performed two additional tests: the first one consisted in to measure the specific heat of a single crystal of Cu-Zn-Al, considered by experts in the field as a martensitic prototype alloy that shows a first order thermodynamic transition. This was previously characterized Tsumura88 . The results show hysteresis between the cooling and warming cycles, in agreement with the reported austenite and martensitic temperature values Tsumura88 . However, we have to mention that the martensitic anomaly in this compound does not show a lambda-type transition, as measured with our PPMS. The reason is due to the algorithm used for the calculation of the specific heat, which is not adequate for a first-order transitions measurement Lashley . The second test was to calculate the specific heat from the raw temperature-time data using the Bachmann‘s approach, as suggested by Lashley et al. Lashley . The results obtained with the Cu-Zn-Al sample shows an hysteresis and the transition anomaly four times higher than the observed with the PPMS. The same approach was applied to the Nb3Sn crystal samples, the results show practically the same curves obtained by the PPMS algorithm and with the Bachmann’s approach, the difference consists in that the specific heat determined with the Bachmann’s approach is noisy.

.
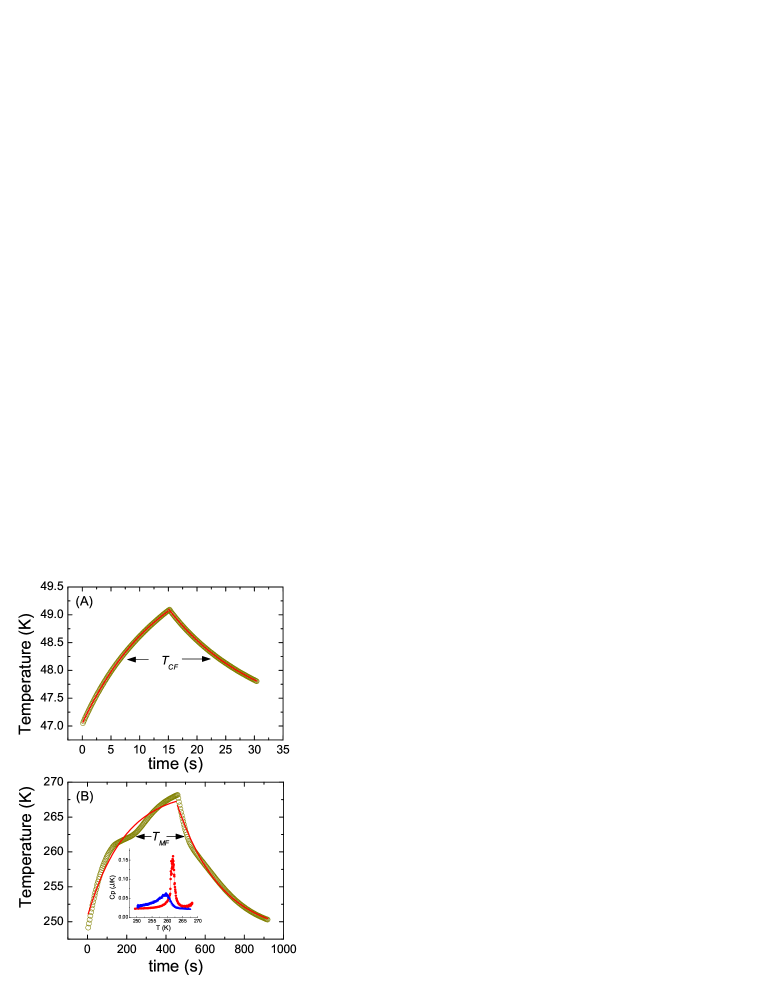
In Fig. 6 we show the thermal relaxation data for the Nb3Sn crystal sample (A) with mass equal to 6.5 mg, and for the Cu-Zn-Al martensitic single crystal sample (B). This figure illustrates the difference between a first and second order transition. There we indicate with arrows the temperature of the end of the transition, , were the change in the specific heat is most notorious. The continuous line is a fit based on the sum of two exponential decay functions, that involve two relaxation time constants. Note that the fitting reproduces adequately the Nb3Sn relaxation experimental data. In Fig. 6(B) we note that the fitting to the experimental relaxation curves does not reproduce the Cu-Zn-Al relaxation experimental data. In the inset of figure 6(B) we present the specific heat curves of the Al-Cu-Al alloy measured in the two cycles; lowering and rising the temperature. A hysteresis is clearly noted. The features are similar to early specific heat studies and measurements performed by Tsumura et al. Tsumura88 .
Fig. 7 shows an interesting comparison of the normalized specific heat of four of our specimens and Guritanu et al., early measurements in their polycrystalline sample. This plot is displayed in term of C/T versus temperature. At the temperature below 6 K it seems that our samples do not present any anomaly as Guritanu, et al. do, and that they mention as the feature of a second energy gap. In this figure we included the superconducting transition temperatures of impurities that frequently are found in Nb3Sn polycrystalline samples (indicated by arrows) of possible contaminants. These common impurities are NbSn2 (TC=2.1 K), Nb6Sn5 (TC=2.6 K) and Sn (TC= 3.7 K). Note that these impurities have transition temperatures in the temperature range where the Cp reported in Ref. 4 presents the anomaly, and which is absent in our measurements.
IV Conclusions
In conclusion, in this work we present new specific heat measurements performed in high quality Nb3Sn single crystals. Due to the excellent quality of the samples, we have observed a clear specific heat feature at the martensitic transition. In multiple cooling and heating cycles, we did not observe hysteretic behavior in the specific heat measurements as function of temperature. Our measurements imply that the so-called martensitic transition is a second order or weakly first order transition, perhaps related to a charge density wave or Peierls distortion. The samples SN1 and SN4 examined by X-ray diffraction present the specific heat anomaly in very different form: whereas SN1 has a very well defined sharp peak, with onset at about 50 K, SN4 presents only a small feature with onset at about 46 K. We speculated that this effect is a consequence of vacancies in the Nb chains, and consequently the martensitic anomaly could be related to a Peierls distortion.
This study shows the existence of a correlation between the superconducting transition temperature and the anomaly at high temperature.
At lowest temperatures, from around 2 - 20 K, we observed only one superconducting energy gap feature. Our data of the specific heat measurements in this temperature interval, do not show any feature or anomaly at low temperature that could be related to a second energy gap.
Acknowledgements.
We thank R. Black from Quantum Design for help with the new software and helpful discussions. To G. W Webb from University of California, for kindly provide the samples used for this study. R. Escudero. thanks support of DGAPA-UNAM. We also thank to F. Silvar for Helium provisions.References
- (1) R. Mailfert, B. W. Batterman, and J. J. Hanak, Physics Lett. 24A, 315 (1967).
- (2) R. Mailfert, B. W. Batterman, and J. J. Hanak, Phys. Status Solidi 32, K67 (1967).
- (3) M. Weger, and I. B. Goldberg, in Solid State Physics, edited by F. Seitz and Turbull (Academic Press, New York), 28, 1, 1971.
- (4) V. Guritanu, W. Goldacker, F. Bouquet, Y. Wang, R. Lortz, G. Goll, and A. Junod, Phys. Rev. B 70, 184526 (2004).
- (5) L. J. Vieland, and A. W. Wicklund, Solid State Comm. 7, 37 (1969).
- (6) C. W. Chu and L. J. Vieland, J. Low Temp. Phys. 17, 25 (1974).
- (7) L. J. Vieland, R. W. Cohen, and W. Rehwald, Phys. Rev. Lett. 26 (7), 373 (1971).
- (8) J. Labbe, and J. Friedel, J. Physique (Paris) 27, 153 (1966); J. Labbe, and J. Friedel, J. de Physique (Paris) 27, 708 (1966).
- (9) R. Tsumura, D. Rios, M. Chaves, L. Rodr guez, T. Akachi, and R. Escudero, Phys. Stat. Sol. (a) 105, 411 (1988).
- (10) T. Makita, M. Kobukata, and A. Nagasawa, J. Material Science. 21 (6), 2212 (1986).
- (11) F. C. Lovey, and V. Torra, Progress in Materials Science 44, 189 (1999).
- (12) L. R. Testardi, Rev. Mod. Phys. 47 (3), 637 (1975).
- (13) W. Weber and L. F. Mattheiss, Phys. Rev. B 25, 2270 (1982).
- (14) A. J. Arko, D. H. Lowndes, F. A. Muller, L. W. Roeland, J. Wolfrat, A. T. van Kessel, H. W. Myron, F. M. Mueller, G. W. Webb, Phys. Rev. Lett. 40, 1590 (1978).
- (15) G. R. Stewart, B. Cort, and G. W. Webb, Phys. Rev B 24, 3841 (1981).
- (16) Siemens XSCANS. Version 2.31. Siemens Analytical X-ray Instruments Inc., Madison, Wisconsin, USA (1999).
- (17) G. M. Sheldrick, Acta Cryst. A64, 112 (2008).
- (18) N. Walker, D. Stuart, Acta Cryst. A39, 158 (1983).
- (19) M. Masimov, Cryst. Res. Technol. 42, 562 (2007).
- (20) PDF-19-0875. See also: R. G. Maier, Z. Naturforsch. A Phys. Sci. 24, 1033 (1969).
- (21) L. P. Gorkov, Zh. Eksp. Teor. Fiz. Pis‘ma Red. 17, 525 (1973) [Sov. Phys.-JETP 38, 830 (1974)]; L. P. Gorkov and O. N. Dorokhov, J. Low Temp. Phys. 22, 1 (1976); Zh. Eksp. Teor. Fiz. Pis‘ma Red. 21, 656 (1975)[JETP Lett. 21, 310 (1975)].
- (22) R. N. Bhatt and W. L. McMillan, Phys. Rev. B 14, 1007 (1976).
- (23) J. C. Lashley, M. F. Hundley, A. Migliori, et al. Cryogenics 43, 369 (2003).