X-Ray Searches for Emission from the WHIM in the Galactic Halo and the Intergalactic Medium
Abstract
At least 50% of the baryons in the local universe are undetected and predicted to be in a hot dilute phase (105-107 K) in low and moderate overdensity environments. We searched for the predicted diffuse faint emission through shadowing observations whereby cool foreground gas absorbs more distant diffuse emission. Observations were obtained with Chandra and XMM-Newton. Using the cold gas in two galaxies, NGC 891 and NGC 5907, shadows were not detected and a newer observation of NGC 891 fails to confirm a previously reported X-ray shadow. Our upper limits lie above model predictions. For Local Group studies, we used a cloud in the Magellanic Stream and a compact high velocity cloud to search for a shadow. Instead of a shadow, the X-ray emission was brighter towards the Magellanic Stream cloud and there is a less significant brightness enhancement toward the other cloud also. The brightness enhancement toward the Magellanic Stream cloud is probably due to an interaction with a hot ambient medium that surrounds the Milky Way. We suggest that this interaction drives a shock into the cloud, heating the gas to X-ray emitting temperatures.
1 Introduction
An inventory of the baryons at the present epoch shows that the visible galaxies and the hot gas in clusters and rich groups comprise only a fraction of the baryons inferred from cosmic microwave background observations (Spergel et al., 2007) or from the D/H ratio, combined with Big Bang nucleosynthesis calculations (Kirkman et al., 2003); these two values are in good agreement. Most of the baryons must be in a form that is difficult to detect, and cosmological simulations suggest that it is still in the gaseous phase in regions of low and moderate overdensities (; Fukugita et al. 1998; Cen & Ostriker 1999; Davé et al. 2001; Croft et al. 2001; Cen & Ostriker 2006). In the simulations, gravitational collapse leads to compressional and shock heating of the gas, producing temperatures of 105 - 107 K, where hydrogen is almost completely ionized. The metallicity of this gas increases with cosmic time due to enrichment by galactic winds, leading to present day metallicities of about 1/10 of the solar value (Danforth & Shull, 2005).
At X-ray energies, one can try to detect this gas in emission or in absorption and each approach poses substantial challenges. For absorption line studies, the intergalactic medium (IGM) is predicted to produce only small equivalent width lines that are at the limit of detectability (reviews by Bregman 2007; Nicastro et al. 2008). Another approach is to search for emission from the IGM, since the presence of metals, and especially of Fe and O, produces X-ray line emission, which when summed over many filaments and large volumes, should be detectable as a diffuse X-ray background (Cen & Ostriker, 1999; Croft et al., 2001). This diffuse background is near the present limit of detectability and is predicted to be less than the typical instrumental backgrounds or than the point source background, even in the 0.4–1 keV range where IGM emission is expected to be most prominent. It is not possible to subtract the unresolved point source background and the instrumental background to sufficient accuracy, as they can vary from field to field and are not known with sufficient accuracy a priori.
A detection method that avoids this problem is that of X-ray shadowing, whereby an excess of cold gas (e.g., a gas cloud) lies in front of the emitting source and falls within the field of view of the detector. The cloud absorbs some of the background X-ray emission, producing a local minimum on the image. To apply this method, it is crucial that the distance to the absorbing cloud is known and that it’s absorption column has been measured independently, such as from H I measurements. This shadowing technique has been applied within the Milky Way to show that there is a hot halo above the disk of the Galaxy (Snowden et al., 1997) and that there is X-ray emission from the Galactic bulge (Park et al., 1997).
Here we determine whether shadows are cast in two situations that address the missing baryon problem. The first set of observations uses the H I in external galaxies to shadow the background emission from the ensemble of hot cosmic filaments. This was utilized in the work of Bregman & Irwin (2002), where the dense atomic and molecular gas in the disk of NGC 891 appeared to produce a shadow at the 98% confidence level. That is, in the 0.4–1.0 keV band, there were 39.5 photons in the extinction region compared to 57.6 photons in the non-extinction region, a deficit of 18 photons. Since this is less than a 3 effect, it is important to confirm or refute the result, and as the initial observation was 51 ksec, there is room for improvement. A significantly longer observation (120 ksec) was obtained for another program, which permits us to examine the quality of the shadow seen with the shorter observation. A second shadowing test is also presented, whereby we use the very extended H I from the edge-on galaxy NGC 5907 to search for a shadow against the diffuse IGM emission.
The other location that one might hope to find the missing baryons is in the Local Group, where the X-ray absorption lines from O VII and O VIII have been detected (Nicastro et al., 2003; Rasmussen et al., 2003) as has OVI (Sembach et al., 2003). These absorption lines are at zero redshift, so the gas could either be a Galactic halo or a Local Group medium. If it is a Galactic halo (typically 50 kpc or smaller), the mass involved is less than the known mass of cold gas in galaxies, and this is argued for by Wang et al. (2005) and Bregman & Lloyd-Davies (2007). However, if the gas fills the Local Group, then the hot gas mass can dominate the total baryon content (Nicastro et al., 2002, 2003; Rasmussen et al., 2003), as expected from the missing baryons. Since there is also diffuse X-ray emission that is associated with this gas (McCammon et al., 2002), one can hope to use the shadowing technique, provided that there are absorbing clouds at distances of at least tens of kpc from the Milky Way. There are such clouds, as the Magellanic Stream has some dense knots of H I and it lies at about 50–60 kpc. Another class of potential targets are the compact high velocity clouds, which Blitz et al. (1999) suggested to be orbiting through the Local Group at distances of kpc. However, new evidence suggests that these are associated with the Galactic halo and lie within 50 kpc (Maloney & Putman, 2003; Putman et al., 2003; Westmeier et al., 2007). We have obtained observations toward these clouds suitable for shadowing studies and report on them below.
2 Observations
There are five different observations discussed below of two edge-on galaxies and two H I clouds in the Local Group. As some observations were obtained with Chandra while others obtained with XMM, we will discuss the results as a function of the instrument used.
2.1 Chandra Data and Data Reduction
The Chandra observations that we analyze in this work were obtained with the ACIS instrument with the objects centered either near the aimpoint of the S3 chip or near the center of the S3 chip. Basic observational information on the individual pointings are given in Table 1.
For the data reduction, which has become fairly standard, we used CIAO 3.2.2 along with CalDB 3.1.0. In each set of data, we identified the bad pixels and pixels affected by cosmic ray afterglows and excluded them from the data set; only grades 0, 2, 4, and 6 were used. Periods of high background were excluded, with the threshold being 40% above the modal value of the background. Exposure maps were produced for the S3 chip, on which our analysis was focused, and the images were either flattened or the exposure map was used separately to correct the extracted counts. For the identification of point sources, we used both wavdetect and direct identification by eye, which led to nearly identical results. The observations of the Magellanic Stream Cloud were obtained in FAINT mode while the observation of NGC 891 and the Compact High Velocity Cloud were obtained in VFAINT mode.
2.1.1 Magellanic Stream Cloud MS30.7-81.4-118
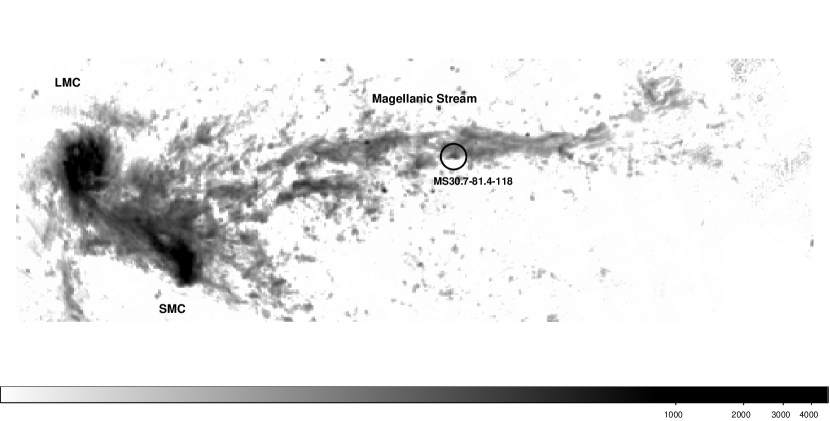
One of the best targets is a neutral gas cloud at a distance near the edge of what might be considered the Galactic Halo, about 50–70 kpc. At this distance is a set of clouds, the Magellanic Stream (Gardiner & Noguchi, 1996), which passes over the South Galactic Pole. Recently, a deep survey was obtained with the Parkes 21 cm multibeam system (Putman et al., 2003), revealing a great deal of structure in the Stream at 15 resolution (Figure 1). Higher resolution (1) radio synthesis observations were obtained by Brüns (1998) of the highest column density regions and one region shows structure with H I columns exceeding 41020 cm-2 (Figure 2), significantly greater than the Galactic H I column of 1.51020 cm-2.
Two partly-overlapping images were obtained, on the H I maximum, and away from the H I maximum. The exposure on the H I maximum was one of the rare times when there were no flares and the background was relatively low, so nearly the entire exposure was used and this was the most useful of the two exposures. Potential shadowing by the Magellanic Stream cloud should have the most pronounced effect at energies below 1 keV, so we produced a flattened 0.4–1.0 keV image with point sources removed (they accounted for 20% of the total counts in the image). In this image, there is an apparent extended symmetrical brightening at 00:13:32.6, -27:11:07 (RA, Dec, J2000), which may be a background group or cluster; it appears in both the soft and hard (1–6 keV) bands.
To search for shadows, four regions were chosen, from the highest to the lowest H I regions. Using the flattened hard image, all four regions were consistent with a constant value for the surface brightness, being within 1.3 of the mean. In the 0.4–1.0 keV image, there is some modest variation, with the high H I column regions being brighter than the low H I regions, the opposite of the shadowing signature. When we compare the two highest H I regions to the two lowest H I regions, the surface brightness values are 1.29 0.04 cts ksec-1 arcmin-2 and 1.20 0.04 cts ksec-1 arcmin-2, a difference of 0.093 0.058 cts ksec-1 arcmin-2. This difference corresponds to a modest brightening of 1.6, rather than the dimming that a shadow would produce.
There will be fluctuations in the X-ray sky due to variation in the Galactic X-ray background, which we can assess in this part of the sky by using our off-cloud data. Even with a longer observation, it may not be possible to improve the limit on the shadow due to the fluctuations in the soft Galactic X-ray background (this region has a fairly smooth background, as seen from the ROSAT data (Snowden et al., 1997). We analyzed the off-cloud images, which after screening high background regions (more than 50% higher than the modal value), led to a useful observing time of 33.49 ksec. After flattening the image, we divided it into nine regions about 300 pixel square, about 15% smaller than most of the regions used for the on-cloud study. The errors per bin were about 6% and the 0.4–1.0 keV background in the field is consistent with a constant value, as the variation is .
Next, we need to separate the amount of flux from the instrument and from the X-ray background. The instrumental background for the ACIS S3 chip was fairly stable over the past five years (since 2000.5) and lower than at launch. The total chip background for the observations is expected to be fairly modest (and similar) for the observation dates of our targets (7.5–9 cts s-1 chip-1; see Figure 6.24 in MPOG v8). Using the standard grades, avoiding flares, and for the 0.4–1.0 keV band, the instrumental count rate is expected to be about 4.210-8 cts pixel-1 for 0.5 pixels, or 0.61 cts ksec-1 arcmin-2. This corresponds to about half of the counts registered in the above measurements.
Another component that needs to be subtracted is the unresolved point source contribution from AGNs. For a 50 ksec Chandra ACIS-S observation, where the limiting point source is defined by five photons, the unresolved point source contribution to the diffuse emission is about 15% of the point source component of the background in the 0.5–2.0 keV band (Moretti et al., 2003). When converted to the 0.4–1.0 keV band, the unresolved point source contribution is 0.037 cts ksec-1 arcmin-2. This unresolved point source contribution is less than 10% of the diffuse background for all Chandra observations and closer to 5% for most of the Chandra observations. We remove this small component, correctly scaled to the observing time, in our analysis.
We remove these various components to obtain the diffuse emission from gas in the shadow and non-shadow region. With minor differences, this procedure is followed for the other observations. There is one final consideration, which is the removal of the emission from the Local Hot Bubble (LHB). Once this is removed (discussed below), we have measurements of true diffuse emission from above the disk.
2.1.2 CHVC 125+41207
Most of the high velocity clouds are resolved easily with single dish radio telescopes, but there are a number that have significant columns yet have small angular sizes. These are the compact high velocity clouds (CHVC). Braun & Burton (1999, 2000) mapped several CHVCs and a few of them have column densities of up to 4x1020 cm-2, with sizes of 10–50 arcmin2. These clouds are ideal targets for X-ray shadowing since they are mapped at good S/N in H I and have high density regions that fill a significant fraction of a single ACIS chip.
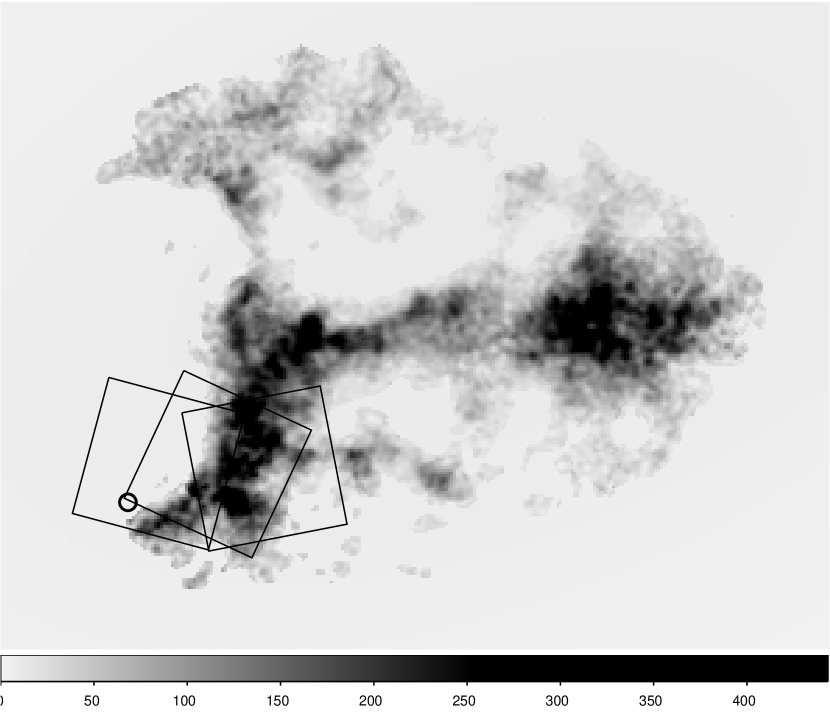
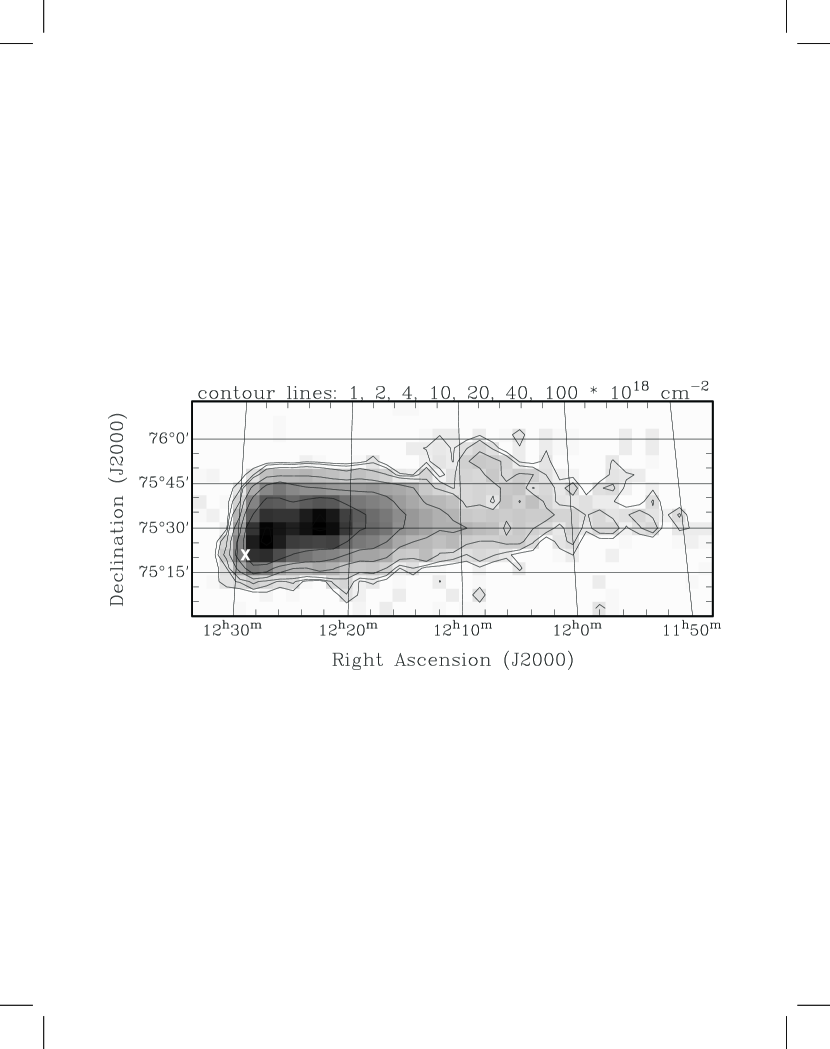
In selecting a CHVC as a target, we needed a cloud whose column density is comparable to that of adjacent regions in the Galaxy and whose solid angle covers a significant fraction of the ACIS S3 chip, which is the most advantageous for this program. Of the clouds that have been mapped with radio synthesis arrays in the 21 cm H I line (Braun & Burton, 2000), the cloud CHVC 125+41-207 is the most suitable (see Figure 3). It is at l, b = 125°, 41° (and velocity -207 km s-1), with the highest column density part confined to an elongated structure of dimensions . At lower column density levels, single-dish data show that it has a head-tail configuration (Figure 4) and is about 0.8° by 2.5° (Brüns et al., 2001). The synthesis H I map, which has 28 resolution, shows that the highest column density part of the cloud is about 51020 cm-2, which is larger than that of smooth regions adjacent to the cloud (31020 cm-2), which are due to the Galactic disk. Aside from the usual point sources, there is a previously unknown diffuse feature that occurs just to the east of the H I cloud with an RA and DEC (J2000) of about 12:29:38.7, 75:21:00, and with a radius of about 30″. This falls in the background subtraction region of the image and was excluded when quantifying the shadow. There is no obvious optical counterpart on the Digital Sky Survey images, so it is most likely either a distant cluster or it is caused by the interaction of the CHVC with its surroundings.
This cloud was observed three times at different positions and roll angles. In all cases, we identified and excluded point sources from the analysis and defined on-cloud and off-cloud region. In the first observation (Obsid 2484), there were several long periods of high background, so the final useful data was 10.1 ksec. In the second observation (2486), the instrumental background was well-behaved and we were able to use most of the data, 21.2 ksec. Conditions were most favorable in the last observation (2253), which is twice as long as the preceding observation and the orientation of the chip is ideal so that about half contains high-column H I and half has the lowest H I column of any chip position; the useful time was 45.3 ksec. The three observations yield a useful integration time of 76.5 ksec, so we differenced the regions of higher H I column (51020 cm-2) and lower H I column (31020 cm-2). The mean surface brightness in the higher H I regions is 1.20 cts ksec-1 arcmin-2, which was 4.9% brighter than the surface brightness of the lower column density region. As the uncertainty in the difference is 3.8%, the brightening is only a 1.3 effect, although in the opposite sense of the shadow that we were searching for.
2.1.3 NGC 891
The more recent and longer observation of NGC 891 had only a few periods of high background so that 108.5 ksec were used out of the total exposure time of 120.4 ksec. Not only is this useful time a factor of three greater than the 36 ksec used in the earlier exposure, but the instrumental background appears to be lower. In addition, two strong sources in NGC 891 are seen in both exposures (one source is SN 1986J), so a very high relative accuracy is achieved and we can be certain that the regions used to analyze the earlier observation are sampling the same J2000 coordinate regions.
The shadow region was defined in Bregman & Irwin (2002) by the dark extinction region that obscures nearly all of the optical light from parts of the disk. All point sources were excluded, an important consideration because there are several point sources detected from the disk, most of which are probably X-ray binaries. The extinction region, with the point sources masked out, constitutes 1378 arcsec2 (see Fig. 5). For the background region, we needed to obtain a surface brightness that would not be contaminated significantly by the extended emission from NGC 891, so these regions are in the outer part of the S3 chip, perpendicular to the disk of the galaxy. The exposure corrected background on the SE side is 1.22 0.04 cts ksec-1 arcmin-2 and on the NW side it is 1.39 0.04 cts ksec-1 arcmin-2, so there may be a slight gradient in the Galactic background; the average of the two backgrounds is 1.31 0.08 cts ksec-1 arcmin-2. In comparison, the surface brightness in the extinction region is 1.80 0.24 cts ksec-1 arcmin-2, a difference of 0.49 0.25 cts ksec-1 arcmin-2, which is 2 above the background level, whereas the earlier observation had found it to be about 2 below the background level. This slight excess is also present when we subdivide the energy bands into 0.4–0.7 keV and 0.7–1.1 keV (about a 1.4 excess in both bands). Thus, the shadow previously seen in NGC 891 is not confirmed and we conclude that the earlier observation was a statistical fluke.
2.2 XMM Data and Data Reduction
2.2.1 NGC 5907
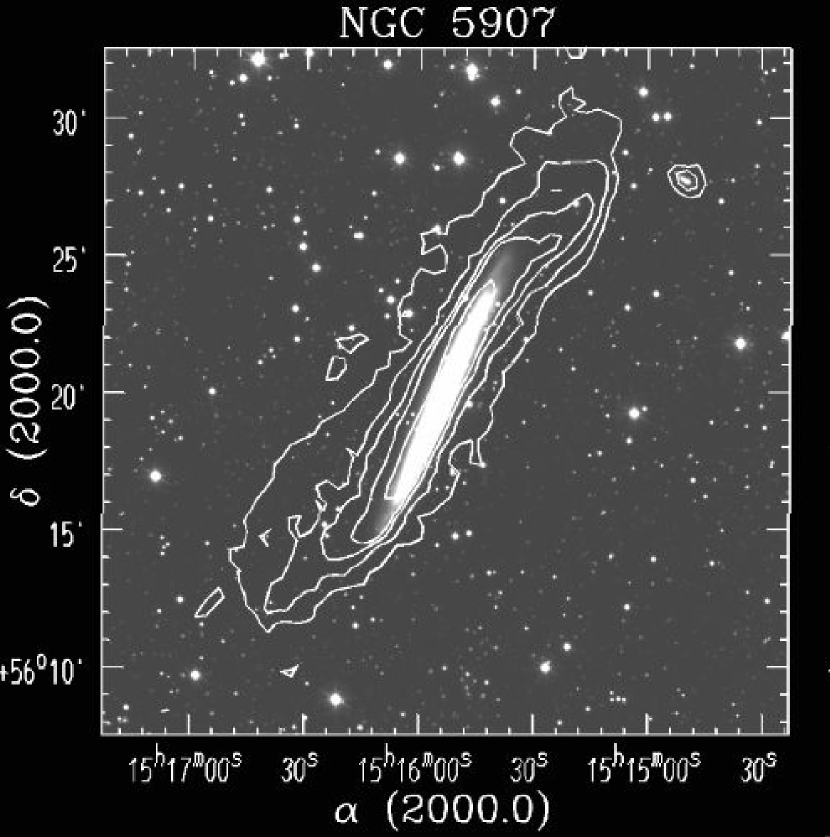
We have examined the H I maps for all edge-on galaxies as well as the gas torn away in interacting galaxies and we found that the best combination of optical depth and solid angle is given by the H I in NGC 5907. The gaseous disk of NGC 5907 not only extends beyond the stellar disk, it has a modest warp where the gas turns away from the smaller stellar disk (Figure 6). The column density of this extended gas rises above cm-2, which causes significant absorption in the 0.4–1.0 keV region.
The observations of NGC 5907 were taken February 20 and 28, 2003 (observations 2 and 1, respectively, with total exposure times of 52.74 ksec and 52.19 ksec). The data were extracted using the Science Analysis Software (SAS) version 7.0.0 of the XMM-Newton group. Unfortunately, the observations were contaminated by strong flaring. We excluded the time intervals of the flares and in addition applied the standard three–sigma clipping to the data based on the 12–14 keV light curves. We checked the resulting good time intervals in the lower energy band (0.4–7 keV). No additional time intervals had to be excluded. Due to the strong flaring, only 12.5 ksec of exposure time were usable for NGC 5907 (about 12% of the total exposure time). For our analysis, we used only the PN data because of the higher sensitivity of that CCD.
The data were binned by 50 pixels during SAS processing. The lowest energy range (0.2–0.4 keV) is dominated by an instrumental background, whereas the background in the highest energy range (1.0–10.0 keV) is expected to consist mostly of unresolved AGNs. We therefore extracted a 0.4–1.0 keV energy band image for our shadowing experiment. In addition, a 0.5–2.0 keV and a large energy band image (0.2–10.0 keV) were also created to aid in our analysis.
In order to identify point sources we created two smoothed images for either observation by applying Gaussian filters of 5 and 25 binned pixels, respectively, to the 0.2–10.0 keV images. The difference images between these two smoothed images revealed point sources and small scale structures from which we created a bad pixel mask for either observation. Remaining possible point sources were marked by hand and included in the bad pixel mask. Dead columns were also identified and masked. CCD boundaries and hot pixels were derived from the exposure maps and included in the bad pixel masks as well, which were then applied to the filtered images.
In this shadowing experiment, a flat background is crucial to obtain reliable measurements. While part of the X-ray background is caused by scattered high energy particles creating a smooth background , high energy particles entering the aperture and following the optical path are subject to the vignetting effects of the mirrors creating a focused background . We attempted to disentangle these two components in each energy band by measuring the background counts (i = 1–15) in 15 circular aperture (each about 100″ in diameter) spread across the NGC 5907 observation away from a possible galaxy X-ray halo. We also obtained the exposure times for these regions using the exposure map. The flat background then could be derived for each set using the least method on
We subtracted the component, divided by the exposure map and normalized the image by multiplying it with the actual exposure time of 12.5 ksec. The resulting flattened image displays an apparent inverse vignetting pattern (e.g., positive pixels values increase towards the outer parts of the field of view as shown in Fig. 7). To understand this pattern, one has to consider the fact that most pixels of the X-ray background in our data did not receive any photon events even after the binning. The vignetting pattern in the data is therefore not represented by an increase in pixel values toward the optical axis, but by an increase in photon event density over a larger area. In the flattened image, the former non-zero pixel values therefore increase toward the edges of the CCD, whereas the former zero-value pixels are decreasing to more negative values at the edge of the field of view. The larger density of negative pixels thus compensates the increase in positive pixel values toward the edges of the flattened image.
For extended sources filling the field of view (i.e., MS30.7), this method of deriving the flat background component is not possible. The basic vignetting pattern cannot be removed from observations of extended sources (this is a more significant problem than in the Chandra observations that used only a single chip with a smaller field of view). We therefore tried a second method using the closed filter wheel (CFW) data of Marty et al. (2003) to derive the flat background component. For this CFW method, we chose measurement regions along contours of constant effective exposure time to exclude the vignetting effects from our measurements. The instrumental background shows spatial inhomogeneities at certain energies due to the electronics board behind the CCD (e.g., Freyberg et al., 2004). Most of these fluorescence lines, however, are at higher energies and thus should not affect the 0.4–1.0 keV band. We measured the instrumental background in the same regions of the CCD as for NGC 5907 and subtracted those count rates from our galaxy measurements accordingly. For better comparison, we chose the same measurement regions for both methods.
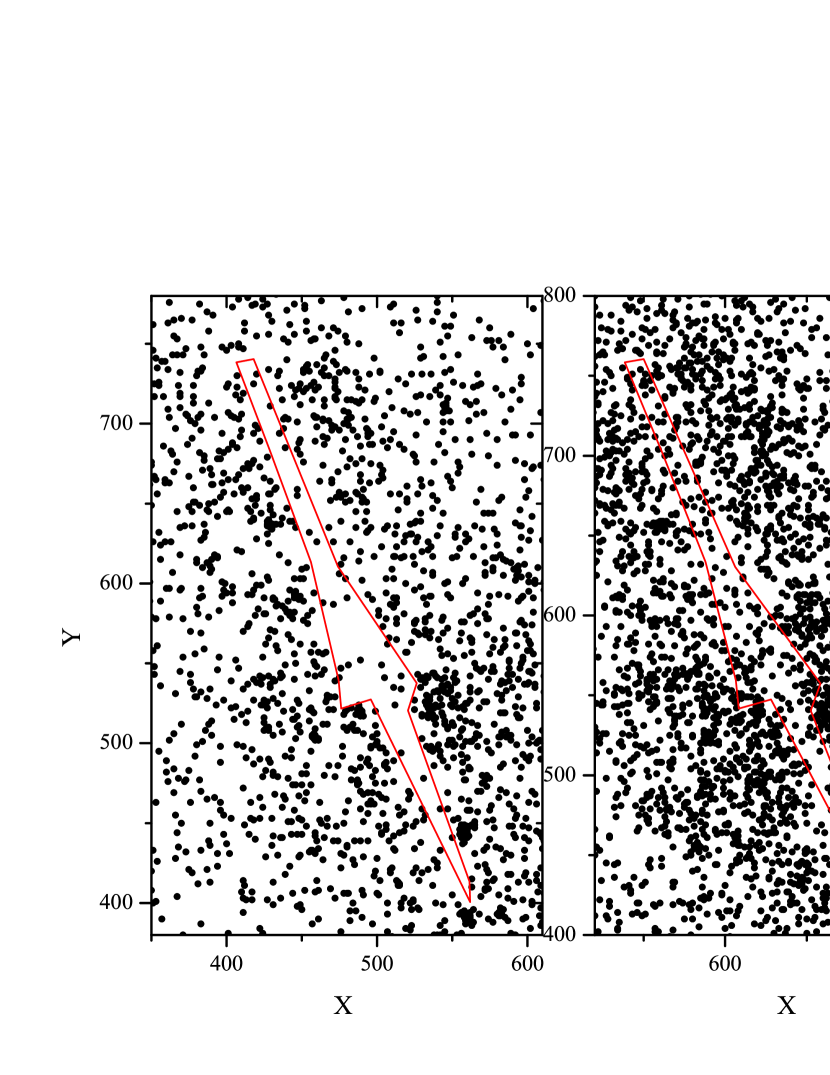
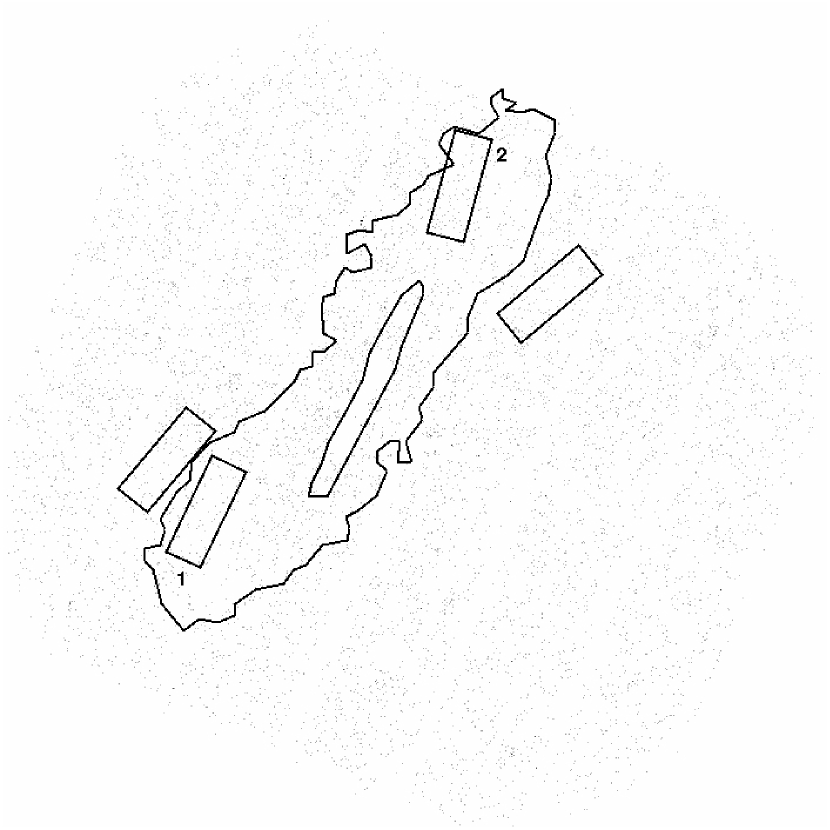
We used the H I contours of Shang et al. (1998, our Fig. 6) to determine the area that could absorb X-ray background photons. The area of the galactic disk has the highest absorbing column, but it is also more likely to be contaminated by unresolved X-ray point sources. We therefore chose regions in the H I halo as areas of possible shadowing and regions outside the halo as X-ray background. We tried to make the measurement regions as large as possible while minimizing the number of masked pixels in each region (as those may have different effects on the count rate due to the vignetting). Figure 8 shows the two region pairs, one in the northern and one in the southern part of the field of view. The number of actual pixels in each region was obtained from the bad pixel mask to correct the measured photon counts. The measurements of both regions are listed in Table 2 for both methods.
Regions 1 and 2 yielded on-minus-off-galaxy measurements of and cts ksec-1 arcmin-2, respectively, for the method and and cts ksec-1 arcmin-2 for the CFW method. This indicates a deficit in the sense of a shadow at the 2 level in the southeastern part of the galaxy halo, whereas the northwestern halo shows no shadow. Assuming a smooth X-ray background in the northwestern halo (and thus averaging the on- and off-measurements), we derive a 3 upper limit of 21–26% for a shadow in this region depending on the method used for the flattening.
The detection limit for point sources in our combined observations of NGC 5907 in the 0.5–2.0 keV band is ergs s-1 cm-2. Based on the source distribution of Moretti et al. (2003) in the 0.5–2.0 keV band and our detection limit, we derive a contribution of unresolved AGNs and galaxies of about 33% in our observations. This corresponds to a background flux111Conversion between count rates and fluxes was performed in WebPIMMS at http://heasarc.gsfc.nasa.gov/Tools/w3pimms.html using a power law index of 1.4. for unresolved sources of about cts ksec-1 arcmin-2 in the 0.4–1.0 keV band. When this is removed from the potential shadow, it becomes a statistically insignificant 1 fluctuation.
2.2.2 MS30.7-81.4-118
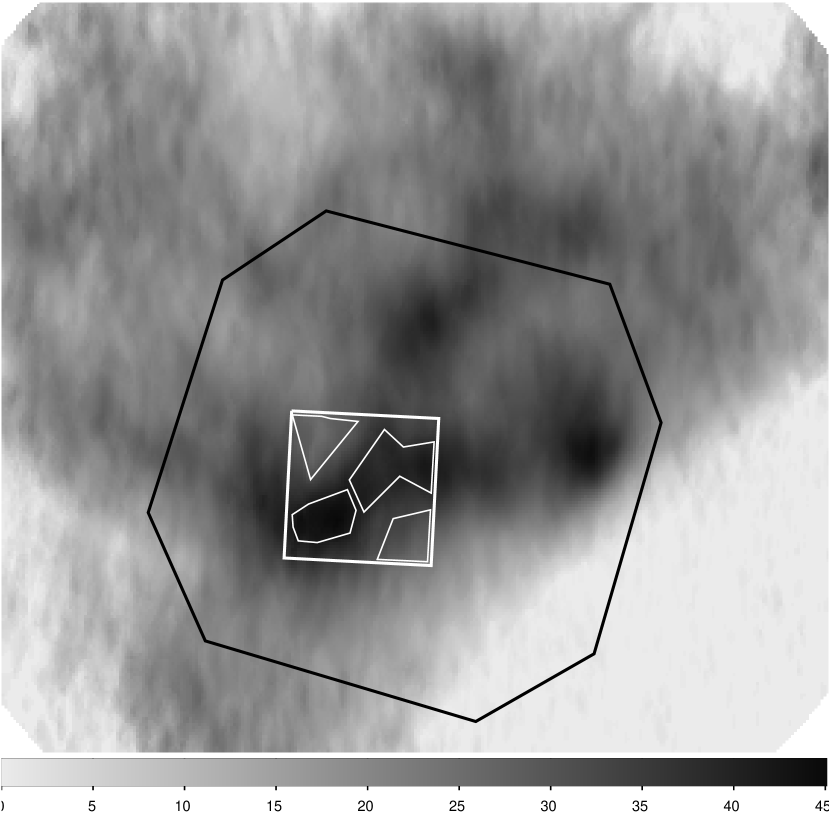
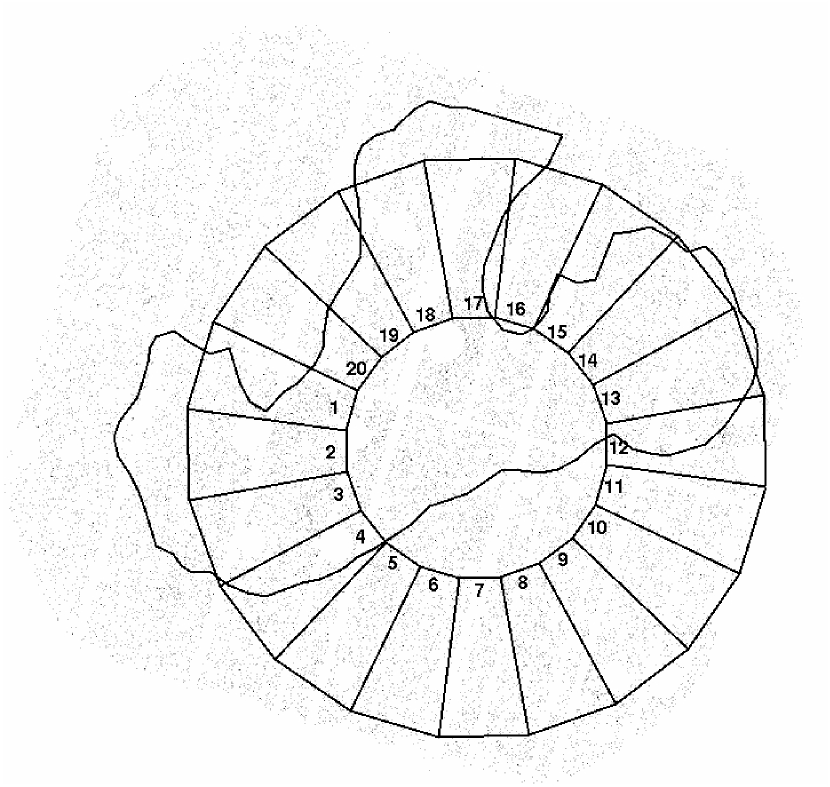
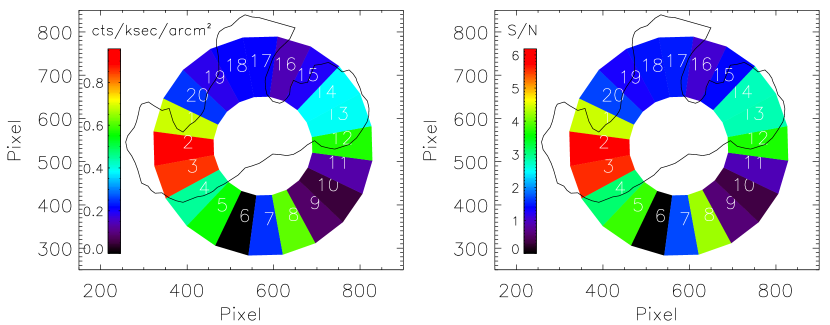
The observation of the Magellanic Stream cloud MS30.7 was taken January 3, 2004. The data extraction and calibration was the same as for NGC 5907 described above. The light curves of MS30.7 showed little flaring, resulting in 37.0 ksec of good time intervals (71% of the total exposure time). Due to the extent of the H I cloud on the XMM field of view, we did not try to derive the smooth background component using the least method described above. We again chose measurement regions that followed constant exposure time contours of the exposure map to exclude vignetting effects and applied the CFW method to measure the background. Our first measurements yielded an X-ray excess on part of the cloud. We therefore mapped the X-ray emission along the segments of a circle centered on the exposure map peak (Fig. 9). Table 3 lists the individual fluxes of all 20 regions and the flux differences relative to region 6, which has the lowest flux of all the regions. Fig. 10 displays these flux differences to emphasize the X-ray excess on the eastern part of the cloud. The area where the brightening occurs is consistent with that found in the Chandra data. Using regions 1–3 for the X-ray bright area and 6–11 as off-cloud, low H I area, we derive average fluxes of and cts ksec-1 arcmin-2 or a difference of cts ksec-1 arcmin-2. This corresponds to a 6.4 brightening, which is larger than the 1.6 increase measured in the Chandra data. The main reason for the difference between the two data sets is the field of view with the XMM-PN data (especially regions 6–11) reaching the edge of the cloud, whereas the Chandra field of view is situated fully on MS30.7.
The detection limit for point sources in the 0.5–2.0 keV band of our observation is ergs s-1 cm-2. Using the distribution of sources by Moretti et al. (2003), we derive a fraction of unresolved sources for the background of 28%, corresponding to cts ksec-1 arcmin-2 in the 0.4–1.0 keV band. The X-ray brightening of the Magellanic Stream cloud could therefore be as high as cts ksec-1 arcmin-2. The 3 upper limit for a shadow based on regions 6–11 corresponds to 8% of the off-cloud background, which is consistent with the range derived from the Chandra data.
3 Interpretation of the Results
3.1 The Absence of X-Ray Shadows
Our observations failed to show a shadow cast by the higher column density regions, although the observation for NGC 5907 produced an order of magnitude less data than expected, so this observation does not provide strong constraints. For our two best cases, MS30.7 and CHVC 125, the pointings toward the higher H I column regions showed a slight brightening rather than a shadow (Table 4). For CHVC 125, this brightening is only at the 1.6 level, and the uncertainty in the ratio of the two pointings (on-cloud and off-cloud) is 8.5%, or a 3 upper limit to the shadow of 25%. For MS30.7, the observations with Chandra and XMM-Newton are consistent in that the flux differences are the values expected from the difference in instrumental sensitivities. The difference in the ratios of the on-cloud and off-cloud fluxes is about at the 2 level, and if not merely due to statistical fluctuations, this may be caused by the slightly different regions used by the two instruments. The field of view is larger for the EPIC camera on XMM-Newton than for the ACIS S3 chip on Chandra, so it was possible to take off-cloud regions further from on-cloud regions, which may have led to the greater contrast. In these observations, the flux is brighter for the on-cloud pointings, with a S/N of 1.7 for the Chandra measurements and 7 for the XMM-Newton data. When combined by weighting, the brightening is about a 7 feature. This could occur if there is an interaction between this Magellanic Stream cloud and a hot diffuse medium. Ignoring the brightening, the 3 detection limit is 14% of the diffuse background.
In forming these ratios and upper limits from the on and off-cloud pointings, we have not removed the contribution from the Local Hot Bubble, which is certainly not being shadowed by the objects that we pointed at. We will assume that the contribution from the Local Hot Bubble is the same in the on and off-cloud locations, in which case, that contribution must be estimated.
To estimate this contribution from the Local Hot Bubble in the 0.1–0.28 keV region (ROSAT bands 1+2) we assume it is equal to that of the contribution above the disk, which is similar to values discussed in the literature (Snowden et al., 2000). There is significant variation in this ratio around the sky and there are regions where the halo contribution dominates that from the LHB and regions where the reverse is true. The field for the CHVC (l, b = 125°, 41°) is in a fairly typical region for the northern Galactic hemisphere, where the 1/4 keV background is intermediate in intensity between the bright regions near the poles (the ROSAT measurements of the background at this location are R12 = 638 and R45 = 137 in units of 10-6 cts s-1 arcmin-2). Separation between the Local Hot Bubble and emission above the disk can be made only on statistical grounds in general and Snowden et al. (2000) show that in the Northern Hemisphere, the two components are comparable. For the field of MS30.7, which is very close to the South Galactic Pole (l, b = 30°, -82°), the background is very similar to the CHVC 125 (R12 = 605 and R45 = 128 in units of 10-6 cts s-1 arcmin-2), so we assume the same ratio of emission from the LHB to that above the plane.
The 1/4 keV emission from above the disk is absorbed by the disk gas, but this absorption decreases with energy so that in the 0.4–1.0 keV band, the emission from above the disk becomes relatively greater. Assuming that the temperature and abundances of the two components are the same (about 0.1 keV), 70–75% of the diffuse 0.4–1.0 keV background originates above the disk. If the component above the disk is hotter as well, the fraction is greater. When we assume that 25% of the diffuse emission in the 0.4–1.0 keV band is due to the Local Hot Bubble, there is an increased fractional error (by 33%) in the remaining flux, so the 3 limits for MS30.7 and CHVC 125 rise to 18% and 34% (Table 4).
For CHVC 125, the mean difference between the higher and lower H I column density regions is 51020 cm-2 versus 31020 cm-2. If most of the emission above the disk lay beyond the CHVC and its gas temperature is 0.1 keV, the shadow would produce a deficit of 17.1% (for a temperature of 0.2 keV, that reduces to 14.3%). This would have been about a 1.5-2 shadow rather than the observed 1.7 brightening. The failure to see a shadow for this object does not place strong constraints on the nature of the Galactic Halo or Local Group medium. Since this CHVC probably lies within 100 kpc of the Milky Way (Putman et al., 2003; Maloney & Putman, 2003; Pisano et al., 2004), it could interact with a hot Galactic Halo to produce X-ray emission that could exceed the deficit expected from a shadow. In addition to the marginal brightening of X-rays toward the cloud, there is an X-ray enhancement just east of the cloud edge that may signal an interaction of the neutral cloud with a hot ambient medium. This is not the first time that a modest X-ray brightening has been seen toward or near a HVC, as such associations have been reported upon by Herbstmeier et al. (1995), Kerp et al. (1996), and Kerp et al. (1999).
The shadowing constraints are a bit stronger for MS30.7, where the fractional uncertainty is 6%. The difference between the higher and lower column density H I regions is 41020 cm-2 compared to 2.51020 cm-2, and for emission from a 0.1 keV thermal plasma, the shadow depth would be 13.1%, or a predicted 2.2 shadow. In contrast, we find a brightening above the 7 level, so the emission from the cloud obscures the predicted shadow, should one exist. The most likely explanation for the brightening is that this cloud, at a distance of 50–70 kpc, is interacting with a hot ambient environment (see below).
The failure to detect a shadow of the diffuse cosmic X-ray background in the Chandra data does not place a very useful upper limit on this component. The limit is that less than 50% of the diffuse X-ray background comes from beyond MS30.7 and CHVC 125. However, if one could detect excess X-ray emission from several clouds with known distances around the Milky Way, it might be possible to probe the density of this hot Galactic halo.
The observation toward NGC 5907 was designed to determine the fraction of the X-ray background that could be due to a cosmological diffuse component arising from the warm-hot intergalactic medium (WHIM). The surface brightness of the WHIM is model-dependent, but it could be as large as 20% of the soft X-ray background in the 0.4–1.0 keV range (Cen & Ostriker, 1999; Croft et al., 2001). Unfortunately, the measurement through the H I of NGC 5907 only yielded a 1 rms of 17%, so this observation does not provide an important constraint. If the X-ray background from the WHIM is near 20%, then an observation that is an order of magnitude longer (the original observing request), the rms would drop to 6% and a shadow would be seen at the 3 level. However, if the emission from the WHIM is closer to 5% of the soft X-ray background, the time required to detect the shadow would exceed 1 Msec with current instruments.
3.2 The X-Ray Enhancement Around MS30.7-81.4-118
One of the positive outcomes of this work is the detection of an X-ray enhancement at the location of the Magellanic Stream cloud MS30.7-81.4-118. From the measurement with EPIC, the net excess flux toward the cloud is 9 erg cm-2 s-1, for an assumed thermal spectrum with kT = 0.3 keV and 20% solar metallicity (the flux is not strongly dependent on the metallicity). For a distance to the cloud of 60 kpc, the implied luminosity is 4 erg s-1. Also, the effective diameter of the cloud is about 70 pc, but it is not spherically symmetric.
This cloud presumably sits in the ambient medium that surrounds the Milky Way, but whose parameters are poorly known. The density of the ambient medium 60 kpc from the Milky Way is likely to be near 10-4 cm-3, and it cannot be larger than a few times this value or it would exceed some of the dispersion measures toward Large Magellanic Cloud (LMC) pulsars (Manchester et al., 2006). Also, significantly larger electron densities along 60 kpc path lengths are ruled out by both the OVII absorption line measurement and the diffuse soft X-ray emission (Bregman & Lloyd-Davies, 2007). A lower limit to the mean ambient density is given from an argument involving the ram-pressure stripping of material within dwarf spheroidals in the Local Group (Blitz & Robishaw, 2000; Grcevich et al., 2009). Blitz & Robishaw (2000) argue that within 250 kpc, the mean gas density must be at least 2.510-5 cm-3. The temperature of this gas is likely to be about 3 K, if it is near virial equilibrium with the potential well of the Milky Way and the Local Group. This would imply that the ambient pressure is P/k 10 K cm-3.
In contrast, if the emission enhancement detected by XMM comes from a uniform density region with the above properties, the electron density is about 410-3 cm-3, which would imply a pressure of P/k = 2104 K cm-3. This pressure is nearly two orders of magnitude larger than that of the ambient medium.
A likely mechanism for the production of this emission is the differential motion between the HI cloud and the hot ambient medium. This differential velocity is about 300 km s-1 (van der Marel et al., 2002), although recent observations show that it may be closer to 370 km s-1 (Kallivayalil et al., 2006; Besla et al., 2007). To be conservative, we will assume that the hot ambient medium is at rest with respect to the Milky Way and that the Magellanic Stream is moving through it at 300 km s-1. As a crude measure of the energy available, we estimate the ram pressure heating rate by the expression , where is the cloud radius, is the ambient gas density and is the relative velocity. Using this, we find the power available is 1 erg s-1. This is about a factor of twenty larger than the observed power, so there is an adequate power supply to account for the observed radiative emission, even if the density is 2.510-5 cm-3. We now consider how this energy might be transferred from relative motion to thermal energy.
This cloud motion might drive a weak shock into the ambient medium, since the differential velocity is comparable to the sound speed. Even if it were a strong shock, it could only raise the density by a factor of four, rather than the factor of about 40 that is observed. A more likely explanation is that the emission occurs from the shock that is driven into the neutral cloud, heating the gas and causing this overpressure medium to flow away from the HI cloud. Additional processes are likely to be important, such as mixing between the HI cloud and the hot medium (Bland-Hawthorn et al., 2007; Parriott & Bregman, 2008).
These energy budget and plausibility arguments are helpful in understanding the processes that lead to X-ray emission, but they are no substitute for a serious simulation. Such a numerical hydrodynamic simulation was carried out by Bland-Hawthorn et al. (2007) for the purpose of modeling the optical H from the Magellanic Stream clouds. In the future, it may be possible to extend these calculations to understand whether the interaction between a Magellanic Stream cloud and a hot ambient medium can cause the observed X-ray brightening.
References
- Besla et al. (2007) Besla, G., Kallivayalil, N., Hernquist, L., Robertson, B., Cox, T. J., van der Marel, R. P., & Alcock, C. 2007, ApJ, 668, 949
- Bland-Hawthorn et al. (2007) Bland-Hawthorn, J., Sutherland, R., Agertz, O., & Moore, B. 2007, ApJ, 670, L109
- Blitz & Robishaw (2000) Blitz, L., & Robishaw, T. 2000, ApJ, 541, 675
- Blitz et al. (1999) Blitz, L., Spergel, D. N., Teuben, P. J., Hartmann, D., & Burton, W. B. 1999, ApJ, 514, 818
- Braun & Burton (1999) Braun, R., & Burton, W. B. 1999, A&A, 341, 437
- Braun & Burton (2000) Braun, R., & Burton, W. B. 2000, A&A, 354, 853
- Bregman (2007) Bregman, J. N. 2007, ARA&A, 45, 221
- Bregman & Irwin (2002) Bregman, J. N., & Irwin, J. A. 2002, ApJ, 565, L13
- Bregman & Lloyd-Davies (2007) Bregman, J. N., & Lloyd-Davies, E. J. 2007, ApJ, 669, 990
- Brüns (1998) Brüns, C. 1998, Ph.D. Thesis,
- Brüns et al. (2001) Brüns, C., Kerp, J., & Pagels, A. 2001, A&A, 370, L26
- Brüns et al. (2005) Brüns, C., et al. 2005, A&A, 432, 45
- Cen & Ostriker (1999) Cen, R., & Ostriker, J. P. 1999, ApJ, 514, 1
- Cen & Ostriker (2006) Cen, R., & Ostriker, J. P. 2006, ApJ, 650, 560
- Croft et al. (2001) Croft, R. A. C., Di Matteo, T., Davé, R., Hernquist, L., Katz, N., Fardal, M. A., & Weinberg, D. H. 2001, ApJ, 557, 67
- Danforth & Shull (2005) Danforth, C. W., & Shull, J. M. 2005, ApJ, 624, 555
- Davé et al. (2001) Davé, R., et al. 2001, ApJ, 552, 473
- Freyberg et al. (2004) Freyberg, M. J., et al. 2004, Proc. SPIE, 5165, 112
- Fukugita et al. (1998) Fukugita, M., Hogan, C. J., & Peebles, P. J. E. 1998, ApJ, 503, 518
- Fukugita & Peebles (2004) Fukugita, M., & Peebles, P. J. E. 2004, ApJ, 616, 643
- Gardiner & Noguchi (1996) Gardiner, L. T., & Noguchi, M. 1996, MNRAS, 278, 191
- Grcevich et al. (2009) Grcevich, J., Putman, M. E., & Peek, J. E. G. 2009, ApJ,696, 385
- Herbstmeier et al. (1995) Herbstmeier, U., Mebold, U., Snowden, S. L., Hartmann, D., Butler Burton, W., Moritz, P., Kalberla, P. M. W., & Egger, R. 1995, A&A, 298, 606
- Kallivayalil et al. (2006) Kallivayalil, N., van der Marel, R. P., Alcock, C., Axelrod, T., Cook, K. H., Drake, A. J., & Geha, M. 2006, ApJ, 638, 772
- Kerp et al. (1996) Kerp, J., Mack, K.-H., Egger, R., Pietz, J., Zimmer, F., Mebold, U., Burton, W. B., & Hartmann, D. 1996, A&A, 312, 67
- Kerp et al. (1999) Kerp, J., Burton, W. B., Egger, R., Freyberg, M. J., Hartmann, D., Kalberla, P. M. W., Mebold, U., & Pietz, J. 1999, A&A, 342, 213
- Kirkman et al. (2003) Kirkman, D., Tytler, D., Suzuki, N., O’Meara, J. M., & Lubin, D. 2003, ApJS, 149, 1
- Maloney & Putman (2003) Maloney, P. R., & Putman, M. E. 2003, ApJ, 589, 270
- Manchester et al. (2006) Manchester, R. N., Fan, G., Lyne, A. G., Kaspi, V. M., & Crawford, F. 2006, ApJ, 649, 235
- Marty et al. (2003) Marty, P. B, Kneib, J.-P., Sadat, R., Ebeling, H., & Smail, I. 2003, SPIE, 4851, 208
- McCammon et al. (2002) McCammon, D., et al. 2002, ApJ, 576, 188
- Moretti et al. (2003) Moretti, A., Campana, S., Lazzati, D., & Tagliaferri, G. 2003, ApJ, 588, 696
- Nicastro et al. (2002) Nicastro, F., et al. 2002, ApJ, 573, 157
- Nicastro et al. (2003) Nicastro, F., et al. 2003, Nature, 421, 719
- Nicastro et al. (2008) Nicastro, F., Mathur, S., & Elvis, M. 2008, Science, 319, 55
- Park et al. (1997) Park, S., Finley, J. P., Snowden, S. L., & Dame, T. M. 1997, ApJ, 476, L77
- Parriott & Bregman (2008) Parriott, J. R., & Bregman, J. N. 2008, ApJ, 681, 1215
- Pisano et al. (2004) Pisano, D. J., Barnes, D. G., Gibson, B. K., Staveley-Smith, L., Freeman, K. C., & Kilborn, V. A. 2004, ApJ, 610, L17
- Putman et al. (2003) Putman, M. E., Bland-Hawthorn, J., Veilleux, S., Gibson, B. K., Freeman, K. C., & Maloney, P. R. 2003, ApJ, 597, 948
- Putman et al. (2003) Putman, M. E., Staveley-Smith, L., Freeman, K. C., Gibson, B. K., & Barnes, D. G. 2003, ApJ, 586, 170
- Rasmussen et al. (2003) Rasmussen, A., Kahn, S. M., & Paerels, F. 2003, ASSL Vol. 281: The IGM/Galaxy Connection. The Distribution of Baryons at z=0, 109
- Sancisi (1976) Sancisi, R. 1976, A&A, 53, 159
- Sembach et al. (2003) Sembach, K. R., et al. 2003, ApJS, 146, 165
- Shang et al. (1998) Shang, Z., et al. 1998, ApJ, 504, L23
- Snowden et al. (1997) Snowden, S. L., et al. 1997, ApJ, 485, 125
- Snowden et al. (2000) Snowden, S. L., Freyberg, M. J., Kuntz, K. D., & Sanders, W. T. 2000, ApJS, 128, 171
- Spergel et al. (2007) Spergel, D. N., et al. 2007, ApJS, 170, 377
- van der Marel et al. (2002) van der Marel, R. P., Alves, D. R., Hardy, E., & Suntzeff, N. B. 2002, AJ, 124, 2639
- Wang et al. (2005) Wang, Q. D., et al. 2005, ApJ, 635, 386
- Westmeier et al. (2007) Westmeier, T., Braun, R., Brüns, C., Kerp, J., & Thilker, D. A. 2007, New Astronomy Review, 51, 108
| Target | Instrument | ObsID | RA (J2000) | DEC (J2000) | texp (ksec) | tclean (ksec) |
|---|---|---|---|---|---|---|
| NGC 891 | Chandra | 794 | 02 22 33.4 | 42 20 57.0 | 51.56 | 36.15 |
| NGC 891 | Chandra | 4613 | 02 22 31.3 | 42 19 57.3 | 120.4 | 108.5 |
| CHVC125 | Chandra | 2253 | 12 29 10.0 | 75 23 45.0 | 48.01 | 45.27 |
| CHVC125 | Chandra | 2484 | 12 28 20.0 | 75 23 45.0 | 24.34 | 10.09 |
| CHVC125 | Chandra | 2486 | 12 27 30.0 | 75 23 45.0 | 22.96 | 21.2 |
| MS30.7 | Chandra | 5038 | 00 13 18.9 | 27 13 24.0 | 50.14 | 49.51 |
| MS30.7_off | Chandra | 5039 | 00 15 05.5 | 27 27 34.7 | 49.88 | 33.49 |
| MS30.7 | XMM | 204670101 | 00 12 56.3 | 27 12 06.7 | 50.03 | 37.0 |
| NGC 5907 | XMM | 145190101 | 15 15 59.0 | 56 20 34.4 | 52.19 | 5.9 |
| NGC 5907 | XMM | 145190201 | 15 15 58.9 | 56 20 33.7 | 52.74 | 6.6 |
| Method | Region | On-galaxy | Off-galaxy | On–Off |
|---|---|---|---|---|
| (cts ksec-1 arcmin-2) | (cts ksec-1 arcmin-2) | (cts ksec-1 arcmin-2) | ||
| 1 | ||||
| 2 | ||||
| CFW | 1 | |||
| CFW | 2 |
| Region | Flux | On–Off Flux |
|---|---|---|
| (cts ksec-1 arcmin-2) | (cts ksec-1 arcmin-2) | |
| 1 | ||
| 2 | ||
| 3 | ||
| 4 | ||
| 5 | ||
| 6 | ||
| 7 | ||
| 8 | ||
| 9 | ||
| 10 | ||
| 11 | ||
| 12 | ||
| 13 | ||
| 14 | ||
| 15 | ||
| 16 | ||
| 17 | ||
| 18 | ||
| 19 | ||
| 20 |
| Object | Observatory | On Cloud | Off Cloud | Instrumental | Unresolved | On | Off | Ratio1 | Local | Ratio2 |
|---|---|---|---|---|---|---|---|---|---|---|
| (raw) | (raw) | Background | Pt. Src. | (net) | (net) | Bubble | ||||
| MS30.7 | Chandra | 0.61 | 0.04 | 0.64 | 0.55 | 0.15 | ||||
| CHVC 125 | Chandra | 0.61 | 0.03 | 0.56 | 0.50 | 0.13 | ||||
| MS30.7 | XMM | 0.70 | 0.21 | 2.33 | 1.69 | 0.50 | ||||
| NGC 5907 | XMM | 0.45 | 0.25 | 1.20 | 1.28 | 0.31 | ||||
| MS30.7 | Sum |
Note. — The units of surface brightness are cts ksec-1 arcmin-2, which apply to columns 3–8, and 10. The surface brightness due to the instrumental background (column 5) and unresolved point sources (column 6) are removed from the raw surface brightness to produce the net counts (columns 7, 8). The quantity Ratio1 is the ratio of the net counts on divided by the net counts off the cloud (column 7 divided by column 8). The quantity Ratio2 (column 11) is the same ratio, after the removal of the surface brightness contribution from the Local Hot Bubble (column 10). The sum of the MS30.7 results is a weighted average.