Electronic structure of ferromagnetic semiconductor Ga1-xMnxAs probed by sub-gap magneto-optical spectroscopy
Abstract
We employ Faraday and Kerr effect spectroscopy in the infrared range to investigate the electronic structure of Ga1-xMnxAs near the Fermi energy. The band structure of this archetypical dilute-moment ferromagnetic semiconductor has been a matter of controversy, fueled partly by previous measurements of the unpolarized infrared absorption and their phenomenological impurity-band interpretation. The infrared magneto-optical effects we study arise directly from the spin-splitting of the carrier bands and their chiral asymmetry due to spin-orbit coupling. Unlike the unpolarized absorption, they are intimately related to ferromagnetism and their interpretation is much more microscopically constrained in terms of the orbital character of the relevant band states. We show that the conventional theory of the disordered valence band with dominant As -orbital character and coupled by kinetic-exchange to Mn local moments accounts semi-quantitatively for the overall characteristics of the measured infrared magneto-optical spectra.
pacs:
75.50.Pp, 78.20.Ls, 78.66.Fd, 71.The study of diluted magnetic semiconductors (DMSs) based on III-V compounds, in particular Ga1-xMnxAs, has been a very active area of research over the past two decades ever since the discovery of carrier mediated ferromangnetism in these materials Ohno et al. (1992). Ga1-xMnxAs can exhibit metallic as well as insulating behavior depending on the doping and growth procedures, with the onset of ferromagnetism occurring near the insulator-to-metal transition. The perception that this transition occurs in a disordered valence band as in conventional p-doped semiconductors Dietl et al. (1997); Ohno (1998); Jungwirth et al. (1999); Dietl et al. (2000) and that many of the key magnetic properties are reminiscent of common itinerant ferromagnets Jungwirth et al. (2006); Novák et al. (2008) makes Ga1-xMnxAs an archetypical ferromagnetic semiconductor system. The notion has inspired numerous studies that contributed to our understanding of basic magnetic and magneto-transport properties of DMSs and led to discoveries of new effects and device concepts, including various types of spintronic transistors eds. T. Dietl et al. (2008). Nevertheless, the character of states near the Fermi energy in ferromagnetic Ga1-xMnxAs is still a matter of controversy Burch et al. (2006); Jungwirth et al. (2007); Rokhinson et al. (2007); Garate et al. (2009); Stone et al. (2008); Tang and Flatté (2008); Ando et al. (2008) fueled in part by phenomenological interpretations of optical spectroscopy studies Burch et al. (2006); Tang and Flatté (2008); Ando et al. (2008) which are inconsistent with the conventional semiconductor valence-band picture of the material.
A broad peak around meV observed in unpolarized infrared absorption spectra has been interpreted by placing the Fermi energy in a narrow impurity band detached from the semiconductor valence band, which persists on the metallic side of the transition Burch et al. (2006). Competing with this phenomenological picture, a semi-quantitative agreement with the experimental peak-position and magnitude of the absorption has been obtained from microscopic calculations based on the disordered valence-band theory and considering transitions within the valence band Jungwirth et al. (2007). The merit of the infrared spectroscopy is that it probes electronic states near the Fermi energy. The unpolarized absorption spectra, however, do not distinguish between transitions originating from states corresponding to intrinsic Ga1-xMnxAs and from extrinsic impurities, and do not provide specific information on the magnetic and orbital character of states involved in the optical transitions. A quantitative microscopic modeling of these spectra is complicated by the relatively strong intentional and unintentional disorder in these heavily doped semiconductors and by the vicinity of the metal-insulator transition Jungwirth et al. (2007). Without microscopic modeling, the absence of a direct link between the measured spectra and the exchange-split and spin-orbit coupled electronic states leaves a relatively unconstrained space for inferring phenomenological pictures of the underlying band structure.
In this paper we present results of Faraday and Kerr measurements in the mid and near-infrared spectral range (115-1300 meV) for several ferromagnetic Ga1-xMnxAs samples grown by low temperature molecular beam epitaxy (LT-MBE) Holý et al. (2006) and a sample grown by a combination of ion implantation and laser pulsed melting (II-LPM) Scarpulla et al. (2003, 2008). Our work complements previously reported higher energy (starting from 600 meV) magneto-optical measurements in Ga1-xMnxAs Ando et al. (1998); Kuroiwa et al. (1998); Beschoten et al. (1999); Szczytko et al. (1999); Lang et al. (2005); Chakarvorty et al. (2007); Ando et al. (2008); Komori et al. (2003)(in the thin film limit the magnetic circular dichroism is approximatively twice the Faraday ellipticity). The interpretation of these higher energy spectra is complicated by the fact that they are sensitive to many desired as well as undesired transitions near the host semiconductor absorption edge. The infrared magneto-optical data studied here provide a unique probe into the nature of electronic states near the Fermi level. In contrast to the unpolarized absorption which is proportional to the longitudinal conductivity, the Faraday and Kerr effects arise from the transverse conductivity component. They represent a finite frequency analogue of the anomalous Hall effect with which they share the common exchange-splitting and spin-orbit coupling origin. The anomalous Hall effect has been described microscopically on a semi-quantitative level using the conventional semiconductor valence band theory Jungwirth et al. (2003). Here we show that by extending the same microscopic theory to finite frequencies we capture key characteristics of the measured infrared magneto-optical spectra, again on a semi-quantitative level, as predicted by early theory studies Sinova et al. (2003); Hankiewicz et al. (2004). We have not performed alternative calculations that would correspond to any of the phenomenological variants of the impurity-band model. For calculating the transverse conductivity one has to specify the microscopic spin and orbital character of the relevant states. As explained in detail elsewhere Mas , we have not found any perceivable microscopic representation of the impurity band models that yields a detached impurity band in ferromagnetic Ga1-xMnxAs materials.
The measurements were performed with a polarization modulation technique using various gas and semiconductor laser sources, as well as a custom-modified double pass prism monochromator with a Xe light source. For details of the experimental technique see Refs. Cerne et al. (2003); Kim et al. (2007); Kim:2009_a . The method was tested by studying semiconductor materials with known behavior in mid-infrared region Kim:2009_a . The magnetic field dependence of the complex Faraday and Kerr angles is measured at each wavelength and various temperatures from 6K to 300K. At temperatures below Tc the magnetic field dependence of the rotation Re and ellipticity Im exhibits a saturation behavior due to alignment of the magnetization with the external field perpendicular to the sample surface. The behavior is superimposed on a linear dependence at higher field due to the response of the wedged GaAs substrate, the Ga1-xMnxAs film, and the cryostat windows (see insert in Fig. 2 ). We subtract the linear component and record the rotation and ellipticity signals corresponding to saturation magnetization. In principle, this may not completely remove the paramagnetic contribution from the signal, but this signal is an order of magnitude weaker than the ferromagnetic contribution in this spectral range and is generally represented by a Brillouin function of the external magnetic field and temperature. For our measurements (at temperatures above 10 K and magnetic fields below 1.5 T), this dependence is linear in magnetic field. Since the Faraday (Kerr) signal Cerne et al. (2003); Kim et al. (2007) is normalized by the total intensity of the transmitted (reflected) light, strong spectral features in the transmittance (reflectance) of the paramagnetic regions could produce artifacts in the Faraday (Kerr) signal. We may expect the contribution to the total transmission (reflection) of light through (from) paramagnetic regions to slightly shift the absolute value of (). However, since the transmittance (reflectance) varies slowly in the mid and near-infrared range, as confirmed by measurements, these spectral artifacts in () are expected to play a negligible role.
We have studied four Ga1-xMnxAs films with different ferromagnetic properties. The sample M5_95K was grown by LT-MBE on a GaAs substrate. The Ga1-xMnxAs film is 50 nm thick with a uniform nominal Mn doping of 5%, a Curie temperature K, and a hole density cm-3 estimated from transport measurements. Sample M2_45K consists of a 50 nm thick Ga1-xMnxAs film with nominal Mn doping of 2%, K and cm-3, and the third LT-MBE sample M1.7_32K has a 100 nm thick Ga1-xMnxAs with nominal Mn doping of 1.7%, K, and cm-3. Sample I8_100K was grown by II-LPM and has K and a Gaussian-like distribution of Mn ions with an estimated mean concentration of Mn of % and hole density cm-3.
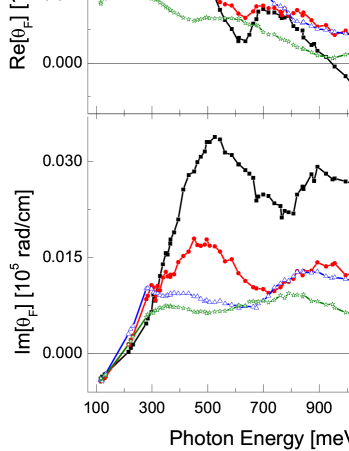
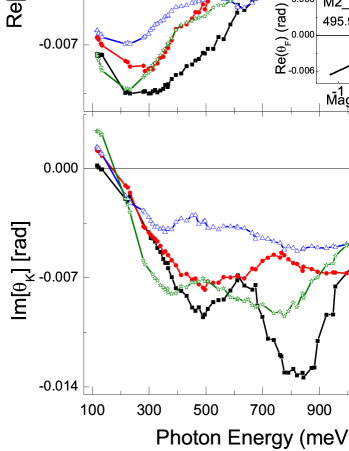
The spectral dependence of the Faraday and Kerr rotation [Re and Re] and ellipticity [Imand Im] taken at 10 K are shown in Figs. 1 and 2. All samples present a similar resonant behavior. Unlike the infrared absorption which is proportional to the longitudinal conductivity Burch et al. (2006), and follow the behavior of the off-diagonal component , thus exhibit relatively sharp (150 meV) spectral features and sign changes. The magnitude of the Faraday rotation and ellipticity grows with Mn concentration. The rotation spectra are characterized by two extrema separated by about 400 meV and a dip or sign change as the band gap energy is approached. The ellipticity changes sign in the 200 meV region and has two maxima at higher energy. We note that features in the rotation are correlated to features in the ellipticity due to the Kramers-Kronig relations.
In the following we compare the measurements with predictions of the theory in which holes reside in an As -orbital dominated valence band which is coupled to Mn -orbital local moments by an antiferromagnetic kinetic-exchange interaction Jungwirth et al. (2006). The coupling is treated within the mean-field theory and disorder is introduced through a finite life-time broadening of the valence-band states Sinova et al. (2003); Hankiewicz et al. (2004). We use the eight-band model which takes into account the complex band structure of the valence band in the presence of the kinetic-exchange field and spin-orbit coupling, as well as valence-conduction band transitions. The relatively large carrier doping also leads to band renormalization effects Berggren and Sernelius (1981); Sernelius (1986); Zhang and Das Sarma (2005) which can modify the band gap and inter-valence band splittings. Whereas electron-electron interactions contributions from the exchange and correlation effects tend to shift rigidly the valence and conduction bands towards each other, the impurity scattering from the randomly distributed Mn acceptors leads to a more strongly momentum dependent shift which renormalizes the inter-valence band splittings Sernelius (1986); Zhang and Das Sarma (2005). We have incorporated this in the calculations by shifting rigidly the majority bands only (largest ) by 10 (p[cm) meV Sernelius (1986); Zhang and Das Sarma (2005).
We use the calculated complex conductivities and in the transmission and reflection formulas for our geometry (thin film on a wedged substrate with multiple scattering effects taken into account) Kim et al. (2007) to determine the complex and . Due to the low values in these samples, and practically follow and , respectively.
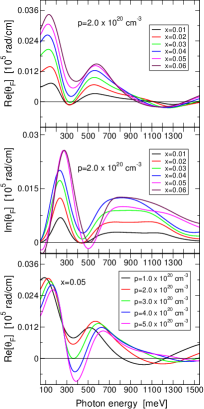
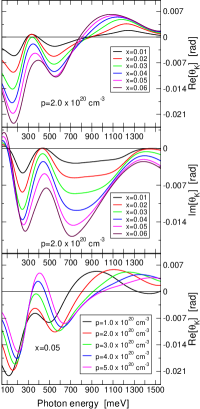
In Fig. 3 we plot the Kerr and Faraday rotation (top panels) and ellipticity (middle panels) as a function of the photon energy for a fixed density of carriers cm-3 and varying MnGa doping. For a fixed MnGa doping of 5% and varying hole concentration (bottom panel) we only show the Faraday and Kerr rotation. The strong disorder present in the experimental films is taken into account through a finite life-time of 100 meV Zhang and Das Sarma (2005); Jungwirth et al. (2006). The Faraday rotation has an extremum in the 150-200 meV while the ellipticity changes sign in this region. These spectral features are due to the transitions from the light-hole band to the heavy-hole band. Contributions from the split-off band to the light-hole band and the split-off band to the heavy-hole band dominate the Kerr and Faraday spectra at energies higher than 500-650 meV. Our calculations capture the measured order of magnitude of the Faraday rotation angle, the separation of the two maxima, and the increase of the angle with increasing MnGa concentration. Variations in the carrier concentration do not affect the magnitude of the Faraday angle as strongly (see lower left panel in Fig. 3). The Faraday angle calculations also capture the dip (and a possible change in sign) of the measured Re as the energy approaches the band-gap. Kerr angle calculations (right panels in Fig. 3) show a similar general agreement with the correct location of the sign change, correct order of magnitude and a separation of the two main peaks in the negative region.
Because of the complexity of the studied materials and approximations employed in the calculations, only a semi-quantitative comparison between theory and experiment is meaningful in case of DMSs. On this level, the overall agreement of our theoretical infrared magneto-optical spectra with experiment provides strong evidence that the conventional disordered valance band theory of ferromagnetic Ga1-xMnxAs captures correctly the magnetic and orbital nature and density of states near the Fermi energy. We emphasize that our microscopic calculations use no adjustable parameters. This applies to the basic spin-splitting and orbital characteristics of the bands which we have accounted for within the model antiferromangetically coupled to the localized Mn d-electrons and whose similar description can be obtained using -tight-binding model or LDA+U full potential density-functional calculations Jungwirth et al. (2006); Mas . It also applies to the additional effects of disorder and interactions on the imaginary and real parts of the hole Green’s function; the former has been estimated based on numerical Fermi’s golden rule calculations in Ga1-xMnxAs Jungwirth et al. (2006) and the latter from detailed band-renormalization studies in heavily p-doped semiconductors Sernelius (1986); Zhang and Das Sarma (2005).
In conclusion, we have presented results of Faraday and Kerr effect measurements in the sub-gap region in order to study the electronic structure of Ga1-xMnxAs. By measuring and , which arise from transitions between exchange-split and spin-orbit coupled states, and after subtracting the paramagnetic background we obtained spectral features corresponding to the ferromagnetically coupled electronic states near the Fermi energy. Microscopic calculations based on the conventional semiconductor valence band picture of Ga1-xMnxAs account for the position of the main spectral features and for the Mn-concentration dependent magnitude of the measured magneto-optical signals.
Acknowledgements.
This work was supported by Research Corporation Cottrell Scholar Award (JC and JS), by NSF-CAREER-DMR0449899 (JC), by NSF-DMR-0554796, by DOE Contract No. DE-AC03-76SF00098 (ODD), by ONR-N000140610122(JS and TJ), by NSF-CAREER–DMR-0547875 (JS), by the SWAN-NRI(JS and TJ), by EU Grants FP7-215368 SemiSpinNet and FP7-214499 NAMASTE and from Czech Republic Grants FON/06/E001, FON/06/E002, AV0Z10100521, KAN400100652, LC510, and Preamium Academiae (TJ and VN).References
- Ohno et al. (1992) H. Ohno et al, Phys. Rev. Lett. 68, 2664 (1992).
- Dietl et al. (1997) T. Dietl et al, Phys. Rev. B 55, R3347 (1997).
- Ohno (1998) H. Ohno, Science 281, 951 (1998).
- Jungwirth et al. (1999) T. Jungwirth et al, Phys. Rev. B 59, 9818 (1999).
- Dietl et al. (2000) T. Dietl, H. Ohno, F. Matsukura, J. Cibert, and D. Ferrand, Science 287, 1019 (2000).
- Jungwirth et al. (2006) T. Jungwirth, J. Sinova, J. Mašek, J. Kučera, and A. H. MacDonald, Rev. Mod. Phys. 78, 809 (2006).
- Novák et al. (2008) V. Novák et al, Phys. Rev. Lett. 101, 077201 (2008).
- eds. T. Dietl et al. (2008) eds. T. Dietl, D. D. Awschalom, M. Kaminska, and H. Ohmo, in Spintronics (Elsevier, 2008), vol. 82 of Semiconductors and Semimetals.
- Burch et al. (2006) K. S. Burch et al, Phys. Rev. Lett. 97, 087208 (2006).
- Jungwirth et al. (2007) T. Jungwirth et al, Phys. Rev. B 76, 125206 (2007).
- Rokhinson et al. (2007) L. P. Rokhinson et al, Phys. Rev. B 76, 161201 (2007).
- Garate et al. (2009) I. Garate, J. Sinova, T. Jungwirth, and A. H. MacDonald, Phys. Rev. B 79, 155207 (2009).
- Stone et al. (2008) P. R. Stone et al, Phys. Rev. Lett. 101, 087203 (2008).
- Tang and Flatté (2008) J.-M. Tang and M. E. Flatté, Phys. Rev. Lett. 101, 157203 (2008).
- Ando et al. (2008) K. Ando, H. Saito, K. C. Agarwal, M. C. Debnath, and V. Zayets, Phys. Rev. Lett. 100, 067204 (2008).
- Holý et al. (2006) V. Holý et al, Phys. Rev. B 74, 245205 (2006).
- Scarpulla et al. (2003) M. A. Scarpulla et al, Appl. Phys. Lett. 82, 1251 (2003).
- Scarpulla et al. (2008) M. A. Scarpulla et al, J. Appl. Phys. 103, 073913 (2008).
- Ando et al. (1998) K. Ando et al, J. Appl. Phys. 83, 6548 (1998).
- Kuroiwa et al. (1998) T. Kuroiwa et al, Electron. Lett. 34 (1998).
- Beschoten et al. (1999) B. Beschoten et al, Phys. Rev. Lett. 83, 3073 (1999).
- Szczytko et al. (1999) J. Szczytko et al, Phys. Rev. B 59, 12935 (1999).
- Lang et al. (2005) R. Lang et al, Phys. Rev. B 72, 024430 (2005).
- Chakarvorty et al. (2007) R. Chakarvorty et al, Appl. Phys. Lett. (2007).
- Komori et al. (2003) T. Komori et al, Phys. Rev. B 67, 115203 (2003).
- Jungwirth et al. (2003) T. Jungwirth et al, Appl. Phys. Lett. 83, 320 (2003).
- (27) J. Masek et al, unpublished.
- Cerne et al. (2003) J. Cerne, D. C. Schmadel, L. B. Rigal, and H. D. Drew, Rev. Sci. Instr. 74, 4755 (2003).
- Kim et al. (2007) M. H. Kim et al, et al., Phys. Rev. B 75, 214416 (2007).
- (30) M. H. Kim et al, unpublished.
- Sinova et al. (2003) J. Sinova, T. Jungwirth, J. Kučera, and A. H. MacDonald, Phys. Rev. B 67, 235203 (2003).
- Hankiewicz et al. (2004) E. M. Hankiewicz, T. Jungwirth, T. Dietl, C. Timm, and J. Sinova, Phys. Rev. B 70, 245211 (2004).
- Berggren and Sernelius (1981) K. F. Berggren and B. E. Sernelius, Phys. Rev. B 24, 1971 (1981).
- Sernelius (1986) B. E. Sernelius, Phys. Rev. B 34, 5610 (1986).
- Zhang and Das Sarma (2005) Y. Zhang and S. Das Sarma, Phys. Rev. B 72, 125303 (2005).