Infrared-red Cores in Nearby Elliptical Galaxies
Abstract
We present the Spitzer Space Telescope Infrared Array Camera (IRAC) observations for a sample of local elliptical galaxies to study later stages of AGN activities. A sample of 36 elliptical galaxies is selected from the Palomar spectroscopic survey. We detect nuclear non-stellar infrared emission in 9 of them. There is unambiguous evidence of circumnuclear dust in these 9 galaxies in their optical images. We also find a remarkable correlation between the infrared excess emission and the nuclear radio/X-ray emission, suggesting that infrared excess emission is tightly related with nuclear activity. Possible origin of infrared excess emission from hot dust heated by the central AGN is supported by spectral indices of IR excess emission.
keywords:
galaxies: active - galaxies: elliptical and lenticular,cD - galaxies: nuclei - infrared: galaxies1 Introduction
The tight correlation between the velocity dispersion of the bulge of the host galaxy and the black hole mass suggests that supermassive black hole (SMBH) is an ubiquitous component in elliptical galaxies (Gebhardt et al. 2000; Ferrarese & Merritt 2000; Kormendy & Richstone, 1995; Magorrian et al. 1998). Activities of SMBHs are well known for elliptical galaxies at high redshifts, these systems are host galaxies for most radio-loud and the bright quasars (Hutchings & Morris 1995; Bahcall, Kirkakos & Schneider 1996; Falomo et al. 2005). However, most SMBHs in nearby ellipticals are no longer very active. Ho et al.(1995,1997) found that, in the Palomar spectroscopic survey of nearby galaxies, only about 50% of ellipticals show detectable emission-line nuclei, most of which belong to be low-ionization nuclear emission-line regions (LINERs; Heckman 1980).
Mulit-wavelength band surveys in elliptical galaxies have been carried out to search for nuclear emission from LINERs and other low-luminosity active galactic nuclei (LLAGNs) to study the true ionization mechanism. Such observations were performed in optical (Ho, et al. 1995, 1997); X-ray (Terashima, et al. 2000, 2002; Flohic et al. 2006), radio (Nagar et al. 2002, 2005; Filho et al. 2006), and ultraviolet band (Maoz, et al. 1995; 1996). None of these observation were conclusive in determining the nature of these objects. A widely accepted perspective is that LLAGNs display remarkably different properties with their high-luminosity counterparts such as quasars and Seyferts. The optical-to-ultraviolet ”big blue bump”, a typical Spectral Energy Distribution (SED) of high-luminosity AGNs, is weak or absent in LLAGNs (Ho, 1999). At the same time, an anticorrelation between radio-loudness and Eddington ratio for AGNs is reported and confirmed by recent studies (Ho, 2002; Greene et al. 2006; Sikora et al. 2007). In the infrared band, the composite SEDs of LLAGNs display a mid-infrared peak (Ho, 2008). Ho (2008) concludes that LLAGNs have an radiatively inefficient accretion flow (RIAF) with a truncated thin disk. Maoz (2007), however, found that SEDs for a sample of relatively unobscured low luminosity LINERs show no difference with that for higher luminosity AGNs. A similar conclusion was obtained recently by Dudik et al. (2009) that [NeV] /[OIV] mid-infrared line flux ratio for LLANGs similar with standard AGN, arguing against a UV-to-optical deficiency due to inefficient accretion in LLANGs.
On the other hand, recent observations show that the circumnuclear region of elliptical galaxies is also complicated. Elliptical galaxies are thought to contain only old stellar population and hot gas. This picture has been challenged by recent observations. Shields (1991) detected warm gas () in many elliptical galaxies (see also Macchetto et al. 1996). Recent neutral hydrogen observations reveal substantial amount of neutral hydrogen gas in many early-type galaxies (Morganti et al. 2006; Noordermeer 2006). Moreover, even cool interstellar medium (ISM) including dust and molecular gas were detected in elliptical galaxies (Knapp et al. 1985; Knapp et al. 1989; van Dokkum et al. 1995; Wiklind et al.1995; Temi et al. 2004; Lauer et al. 2005; Sage et al. 2007; Kaneda et al. 2008). The circumnuclear cold interstellar media are mostly detected in elliptical galaxies with nuclear activities (Tran et al. 2001; Krajnovic & Jaffe, 2002; Xilouris & Papadakis, 2002; Simóes Lopes et al. 2007; Zhang et al. 2008). It is more likely that active elliptical galaxies possess circumnuclear dust feature. This fact challenges the RIAF accretion scenario, which assumes LLAGNs are not gas-starving, but have a low radiative efficiency.
The Spitzer Space Telescope (Werner et al. 2004) with 2” spatial resolution (Fazio et al. 2004) in mid-infrared () offers us a new approach to study both LLAGNs and their environment in ellipticals. Although contributions of photospheric emission from evolved stellar population and hot dust in the circum-stellar envelopes of AGB stars form a considerable mid-infrared background in ellipticals (Athey & Bregman 2002; Xilouris et al. 2004; Temi et al. 2008), smooth spatial distribution of surface brightness of elliptical galaxies permit to separate non-stellar nuclear source from galaxy component. There were several detections of mid-infrared core feature in previous studies (Pahre et al. 2004; Gu et al. 2007). This excess emission from AGN component can not be easily extracted from host galaxy extended component due to poor spatial resolution.
In this paper, we present results of MIR observation of a sample of nearby elliptical galaxies at mid-infrared wavelength with Infrared Array Camera (IRAC) and Multiband Imaging Photometer (MIPS) aboard the Spitzer Space Telescope in search for mid-infrared core, and studies of correlation between infrared core feature and other nuclear properties of elliptical galaxies. This MIR observation permits to investigate the origin of nuclear infrared emission in ellipticals.
This paper is organized as follows: the sample selection and data reduction are described in Section 2; the basic results of the observation are presented in Section 3; the results are discussed in Section 4; the conclusion is given in Section 5.
2 Sample Selection and Data Reduction
| Galaxy | D | Nuclear | |||
|---|---|---|---|---|---|
| Name | () | (mag) | Class | Dust | Ref |
| (1) | (2) | (3) | (4) | (5) | (6) |
| NGC315 | 65.8 | -22.22 | L1.9 | Disk/Ring | 3 |
| NGC410 | 70.6 | -22.01 | T | … | … |
| NGC777 | 66.5 | -21.94 | S | … | … |
| NGC821 | 23.2 | -20.11 | A | No Dust | 2 |
| NGC1052 | 17.8 | -19.90 | L1.9 | Lane/Chaotic | 5 |
| NGC2832 | 91.6 | -22.24 | L2: | No Dust | 4 |
| NGC3226 | 23.4 | -19.40 | L1.9 | Disk/Ring | 3 |
| NGC3377 | 8.1 | -18.47 | A | Lane/Chaotic | 1 |
| NGC3379 | 8.1 | -19.36 | L2/T2: | Disk/Ring | 2 |
| NGC3608 | 23.4 | -20.16 | L2/S2: | No Dust | 2 |
| NGC3610 | 29.2 | -20.79 | A | No Dust | 2 |
| NGC3640 | 24.2 | -20.73 | A | No Dust | 1 |
| NGC4125 | 24.2 | -21.25 | T | Disk/ring | 1 |
| NGC4168 | 16.8 | -19.07 | S | Lane/Chaotic | 1 |
| NGC4261 | 35.1 | -21.37 | L2 | Disk/Ring | 3 |
| NGC4291 | 29.4 | -20.09 | A | No Dust | 2 |
| NGC4278 | 9.7 | -18.96 | L1.9 | Lane/Chaotic | 2 |
| NGC4374 | 16.8 | -21.12 | L2 | Lane/Chaotic | 5 |
| NGC4406 | 16.8 | -21.39 | A | No Dust | 2 |
| NGC4473 | 16.8 | -20.10 | A | No Dust | 2 |
| NGC4552 | 16.8 | -20.56 | T | Lane/Chaotic | 2 |
| NGC4564 | 16.8 | -19.17 | A | No Dust | 2 |
| NGC4621 | 16.8 | -20.60 | A | No Dust | 1 |
| NGC4636 | 17.0 | -20.72 | L1.9 | Lane/Chaotic | 7 |
| NGC4649 | 16.8 | -21.43 | A | No Dust | 2 |
| NGC4660 | 16.8 | -19.06 | A | No Dust | 2 |
| NGC5077 | 40.6 | -20.83 | L1.9 | Lane/Chaotic | 6 |
| NGC5322 | 31.6 | -21.46 | L2: | Disk/Ring | 2 |
| NGC5557 | 42.6 | -21.17 | A | No Dust | 1 |
| NGC5576 | 26.4 | -20.43 | A | No Dust | 2 |
| NGC5813 | 28.5 | -20.85 | L2 | Disk/Ring | 1 |
| NGC5831 | 28.5 | -19.96 | A | No Dust | 1 |
| NGC5846 | 28.5 | -21.36 | T | Lane/Chaotic | 1 |
| NGC5982 | 38.7 | -20.89 | L2 | No Dust | 1 |
| NGC6482 | 52.3 | -21.75 | T | … | … |
| NGC7626 | 45.6 | -21.23 | L2 | Dust/Ring | 3 |
Notes— Col(4):Nuclear spectral type from the Palomar survey (Ho et al. 1997):L=LINER; S=Seyfert; T=Transition object; A=absorption-line nuclei (inactive). Col(5):Morphology of optical circumnuclear dust, obtained from references listed in Col(6), including three types: nuclear dust disk or dust ring; dust lane or disorganized dust patch; no dust. Col(6):References—(1) Tran et al. 2001; (2) Lauer et al. 2005; (3) González Delgado et al. 2008; (4) Lauer et al. 2007; (5) Ravindranath et al. 2001; (6) Rest et al. 2001; (7) van Dokkum & Franx, 1995.
A sample of 36 elliptical galaxies were selected from the Palomar optical spectroscopic survey for this study. The Palomar optical spectroscopy survey comprises all nearby galaxies brighter than in the northern hemisphere (Ho et al. 1995, 1997). This sample is statistical complete, and contains both galaxies with and without nuclear activity while the latter ones serve as a control sample. Multi-band observations of nuclear region has been carried out and studied for a large fraction of this sample, making it suitable for our study of the infrared properties. Our sample includes 2 Seyferts, 15 LINERs, 5 transition objects and 15 inactive galaxies.
The IRAC Basic Calibrated Data (BCD) and MIPS Post Basic Calibrated Data (Post BCD) of these galaxies are downloaded from the archive of Spitzer Science Center. The IRAC BCD images were performed with basic image processing, including dark subtraction, detector linearization corrections, flat-field corrections, and flux calibration. We further use the custom IDL software (Huang et al. 2004) to make the final mosaic image for each object. The absolute flux calibration for IRAC flux densities is better than 10% (Fazio et al. 2004). We adopt the AB magnitude system for magnitudes and colors throughout this paper.
To obtain the MIR color distribution of each galaxy, we first cross-convolve each image by using the corresponding PSF111http://dirty.as.arizona.edu/k̃gordon/mips/conv_psfs/conv_psfs.html(Gordon et al. 2008, Tom Jarrett, private communication). For example, the color difference between image at and at was obtained by following steps, firstly:
| (1) |
| (2) |
Where “” means convolution, then:
| (3) |
Where and are PSF aperture correction factors for an infinite aperture.
We used ellipse program in the ISOPHOT package of IRAF to perform the surface photometry of each galaxy. Hot pixels and foreground stars were identified by eye and masked out before isophotal fitting.
The isophotal parameters, such as ellipticity and position angle, were measured at where the Signal-to-Noise (S/N) ratio is the highest. These parameters were then applied for the surface photometry at 4.5, 5.8 and . Considering the scattered light, we employed extended sources aperture correction for calibration provided by Tom Jarrett222http://spider.ipac.caltech.edu/staff/jarrett/irac/calibration/. Since we particularly focus on the nuclear region, we also obtained the nuclear flux density from a circular region within an aperture of 10” (for NGC 1052 and NGC 3226, with an aperture of 15”) to extract the non-stellar excess emission. The size of such a central region is determined by the radial color distribution shown in Figure 1.
22
Galaxy Name () () () () () (1) (2) (3) (4) (5) (6) NGC315 39.38 30.39 41.64 30.22 30.27 NGC410 … 0 0 NGC777 … 0 0 NGC821 … … … 0 22.45 NGC1052 39.43 29.14 40.78 29.53 29.72 NGC2832 … … … NGC3226 38.93 27.55 39.62 … … NGC3377 … … … 28.04 28.39 NGC3379 37.73 37.89 0 0 NGC3608 37.80 38.64 … … NGC3610 … … … 0 0 NGC3640 … … … 0 0 NGC4125 38.85 38.93 29.70 30.02 NGC4168 37.91 27.01 … 0 29.30 NGC4261 39.70 29.65 40.65 29.07 29.28 NGC4291 … … … 0 0 NGC4278 38.88 28.10 39.96 28.83 29.27 NGC4374 39.03 28.79 39.58 29.24 29.54 NGC4406 … … … 28.57 29.00 NGC4473 … … … 0 0 NGC4552 38.05 28.30 39.41 28.73 29.20 NGC4564 … … … 0 0 NGC4621 … … … 0 0 NGC4636 … … … 0 0 NGC4649 … … … 29.43 29.52 NGC4660 … … … 0 0 NGC5077 39.52 … … … … NGC5322 38.54 28.18 … 29.71 30.03 NGC5557 … … … 0 0 NGC5576 … … … 28.88 29.20 NGC5813 38.35 27.37 … 0 0 NGC5831 … … … … … NGC5846 38.32 27.79 39.54 0 0 NGC5982 38.55 … … 0 29.77 NGC6482 … 39.40 0 0 NGC7626 38.52 29.00 … 0 0
Notes—Col(2): Luminosity of taken from Ho et al. (1997), except NGC 1052, NGC 4125 and NGC 5813, which are based on observations under non-photometric conditions. Ho et al. (2003b) give their updated luminosities and we use them to derive their luminosities, assuming same ratios of from Ho et al.(1997). Col(3): Nuclear Luminosity at 15GHz, taken from Nagar et al.(2005), except NGC1052, which is taken from Kellermann et al.(1998). Col(4): Nuclear Luminosity at 2-10keV, taken from Gonzalez-Martin et al. (2006), except NGC 4278, which is taken from Terashima & Wilson (2003). Col(5) - (6): Total luminosities at and from IRAS observation (Knapp et al. 1989)
3 Results
Figure 1 shows color distributions of , , for all elliptical galaxies in our sample. In , the infrared colors for almost all galaxies do not change significantly, and are generally consistent with photospheric emission of late-type stars with a minor contribution of hot dust in circum-stellar envelopes of AGB stars (Pahre et al. 2004; del Burgo, Carter & Sikkema, 2008; Temi, Brenghti & Mathews, 2008). However, the colors in the central region with tell a different story: 9 out of 36 galaxies exhibit much redder colors. The [3.6][8.0] shows most color excess in the central region. Thus we use [3.6][8.0] colors to distinguish galaxies with significant excess emission from normal galaxies. For galaxies with no significant color excess, the deviation of [3.6][8.0] color in central 10” region is only . The remaining 9 galaxies all have [3.6] - [8.0] color redder than -1.34, indicating a redder central color above level.
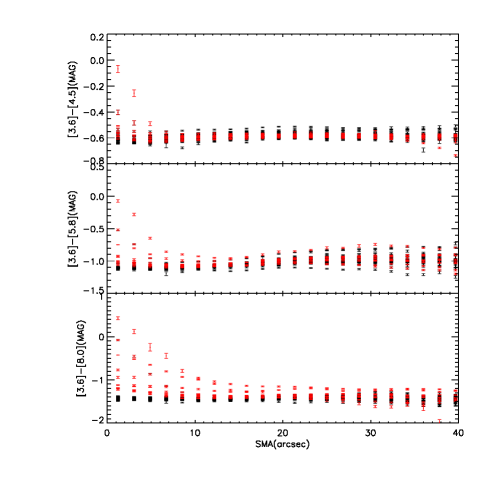
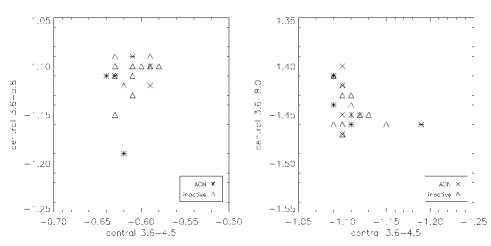
Figure 2 is the color-color diagram for galaxies with no color excess in the center. The dispersions of their IRAC colors are very small, with , , , in agreement with colors of M-type star ( Pahre et al. 2004). This result supports that normal ellipticals are dominated by old stellar population. Moreover, LLAGNs and inactive galaxies show no systematic difference in mid-infrared color, which agrees with the nuclear stellar population analysis of LLAGNs in previous studies (Boisson et al. 2000; Ho et al. 2003b). Zhang et al.(2008) studied the nuclear stellar population for a sample of early-type galaxies that is highly overlapped with our sample, and they found no difference in stellar age distribution between LLAGNs and inactive galaxies in their sample.
The mid-infrared emission from elliptical galaxies consists of two components: stellar and non-stellar emission (dust, AGN, etc.). The emission is dominated by later-type stellar photospheric emission (Pahre et al. 2004; Temi et al. 2008), thus traces stellar mass distribution. The non-stellar component becomes significant at longer wavelength, which is shown clearly by the color. To derive the flux density of excess non-stellar emission in infrared core galaxies, we use the mean colors ([3.6]-[5.8], [3.6]-[8.0]) for central regions of non-core galaxies as a template of the old stellar component. For five infrared core galaxies with visible excess emissions (NGC 315, NGC 1052, NGC 3226, NGC 4261 and NGC 5322) at both and , by assuming that the shape of SED for the central excess emission as a power-law function, we are able to disentangle excess component from stellar emission by solving following equations:
| (4) |
| (5) |
| (6) |
where subscript numbers correspond to different wavelength , are corresponding frequency of , and are flux densities of core emission and stellar emission at different bands, respectively. , and are set as variables, with a total number of 7, equal to the number of equations. are flux ratios of emission for old stellar population, obtained by averaging central colors of all non-core galaxies. are flux densities of stellar emission at different bands, extracted from central region within an aperture of 15” for NGC 1052/ NGC 3226 and 10” for other core galaxies. The size of aperture is determined by two factors, it should be large enough to include the whole infrared core structure, and as small as possible to reduce the influence from offset of zero-point caused by uncertainty in true nuclear stellar color, this influence bring larger uncertainty at shorter wavelength, where dilution by stellar emission is more serious. The special resolution of IRAC is 2”. In [3.6 - 8.0] distribution shown in Figure 1, except NGC 1052, NGC 3226 and NGC 4278, the sizes of red core structures for all the rest six galaxies are smaller or close to 10 arcsec. Furthermore, due to the convolution procedure mentioned in Section 2, the sizes of core structure in Figure 1 appear larger than their real values. Therefore, we consider 10 arcsec a proper size for the aperture to extract nuclear excess emission. For NGC 1052 and NGC 3226, 15” aperture is adopted, NGC4278 show a redder color throughout the galaxy and a vague core structure, we simply use 10” aperture to derive a ”nuclear” flux in this object. For such apertures, the propagated relative errors of excess emission due to uncertainties of are several to about ten percent.
Flux densities and luminosities obtained through above approachs are listed in Table 3 and 4. In Table 3, the errors of total IRAC and MIPS flux densities of whole galaxies are simply set as (Fazio et al. 2004; Rieke et al. 2004), which is an estimation for the uncertainties of absolute calibration, in contrast, uncertainties derived from image statistics are neglibile. The uncerntainties of excess emission and spectral indices are estimated from deviation of excess emissions extracted from apertures (10”/15”/20” for NGC 1052 and NGC 3226, 5”/10”/15” for other galaxies). The proportion of excess emission at 3.6 is very small, contributes less than 5% even in the strong infrared core galaxy, NGC 1052, and less than 0.5% in NGC 4261. Hence it is reasonable to assume all flux densities in the other four galaxies (NGC 4125, NGC 4278, NGC 4374 and NGC 5077) are produced by stellar component, with this assumption we obtain the excess flux densities at for these four galaxies, since their excess emissions at short wavelength, even if exist, will be too weak to be detected. The excess emissions are generally small comparing with stellar emission except in NGC 1052, where excess emission contributes to nearly 50 percents of total emission.
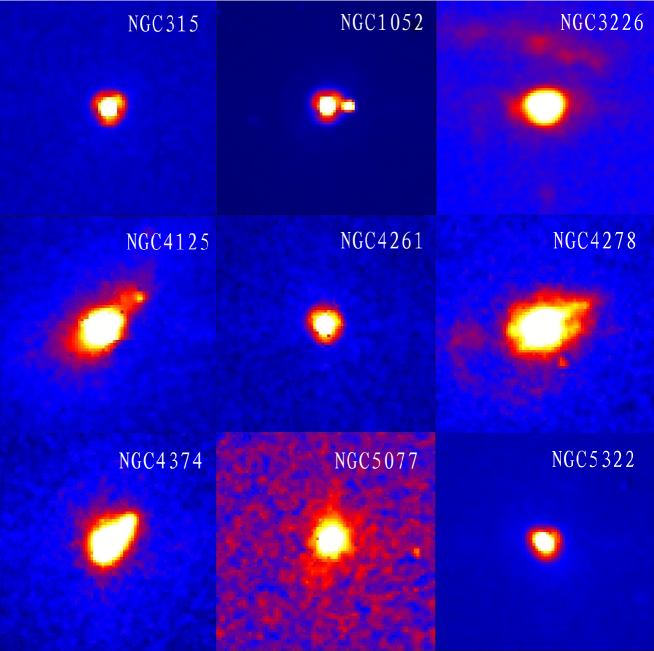
Figure 3 shows residual images of nine infrared core galaxies, which are obtained by utilizing image and flux ratio appearing in equation (5) to remove the contribution of underlying stellar population. The excess emissions in four galaxies (NGC 315, NGC 1052, NGC 4261 and NGC 5322) show point-like structure with ring-like feature of Point Spread Function (PSF), and the other five galaxies show extended excess emission, indicating off-nuclear sources of excess. NGC 1052 show a substructure on the right of the center. This is due to the bandwidth effect333IRAC Data Handbook: http://ssc.spitzer.caltech.edu/irac/dh/ and was masked for measuring photometry.
To show the contribution of extended emission, in Figure 4 we compare nuclear excess luminosity with the compactness of excess emission, quantified by , the proportion of nuclear excess luminosities within 5” aperture to total extended luminosities. For point-like sources, the surface brightness profile within 5” are uniform and consistent with PSF. The proportion of central emission within 5” are generally higher than and are higher than for point-like sources. The compactness decreases as nuclear luminosity decreases. Extended emissions become considerable only for sources with nuclear luminosities lower than .
4 Discussion
The excess non-stellar emission may originate from the central AGNs or nuclear hot dust heated by AGN. PAHs emission feature could also contribute to excess emission at , this is exactly the case for NGC 1052, where PAHs emission feature has been detected (Kaneda et al. 2008), though this feature by itself is not able to explain the excess emission at and . AGNs and kpc-scale circumnuclear dust are commonly detected in nearby elliptical galaxies. In the Palomar spectroscopic survey of nearby galaxies, about half of the ellipticals show detectable emission-line nuclei, while most of which are classified as LINERs (Ho, et al. 1997). On the other hand, recent observations from Hubble Space Telescope (HST) images show that circumnuclear dust appear in about of ellipticals in their optical images (Tran, et al. 2001; Lauer, et al. 2005; Simoes Lopes, et al. 2007). PAHs were thought to be rare in ellipticals considering the sputtering destruction in the hot plasma environment. However, recently, Kaneda et al.(2008) reported detection of PAHs emission features in 14 out of 18 dusty ellipticals, implying that PAHs are more common than ever thought in these systems. In the following discussion, we confine our interest to the role of different components playing in produce the excess infrared emission.
Columns (4) and (5) of Table 1 summarize the classification on nuclear activity and circumnuclear dust morphology in optical images of our sample galaxies. All infrared core galaxies, both point-like and extended sources, show AGN activities, 8 of them are LINERs, except for NGC 4125, which is classified as a Transition object. Thus infrared core galaxies account for of AGNs in our sample. With respect to circumnuclear dust, 17 galaxies, about half of our sample, have been detected of circumnuclear dust in optical band, all infrared core galaxies belong to this group. Therefore, the fact that both AGNs and circumnuclear dust coincide with a central infrared core makes it difficult to clarify their contributions to the infrared excess emission.
Galaxy Name (mJy) (mJy) (mJy) (mJy) (mJy) (mJy) (mJy) (mJy) (1) ( 2) (3) (4) (5) (6) (7) (8) (9) (10) (11) (12) NGC 315 2.1 0.27 NGC1052 1.3a 0.33 NGC4261 2.3 -0.24 NGC5322 1.2 0.15 NGC3226 1.0 0.11 NGC4125 … … … 1.8 … NGC4278 … … … 0.9 0.29 NGC4374 … … … 1.3 0.13 NGC5077 … … … 2.2 …
Notes—Col(2)—(6):Total infrared flux density at ,,, and . Col(7)—(9):Flux density of central excess emission at , , . Col(10): Power-law index of central excess emission between , derived from , and through method described in Section 3. Col(11): Power-law index of central excess emission between , derived from Col(6) and Col(9). Col(12): Spectral index of nuclei derived from flux densities at 5GHz and 15GHz, which are taken from Nagar et al. (2005).
a Since NGC1052 has no MIPS data, the power-law index is derived from the mid-infrared spectra, that is given by Kaneda et al, 2008.
Galaxy Name () () () () () () () () (1) (2) (3) (4) (5) (6) (7) (8) (9) NGC315 NGC1052 … NGC4261 NGC5322 NGC3226 NGC4125 … … NGC4278 … … NGC4374 … … NGC5077 … …
Notes—Col(2)—(5):Total infrared luminosity at , , , & . Col(6)—(8):Luminosity of central excess emission at , , .
Optical observations of early-type galaxies show that active early-type galaxies more tend to possess circumnuclear dust than inactive ones (Tran et al. 2001; Krajnovic & Jaffe, 2002; Xilouris & Papadakis, 2002; Simoes Lopes et al. 2007). Simoes Lopes et al. (2007) reported that 100% AGNs show ciucumnuclear dust feature in optical image, in contrast, only 2 out of 15 ellipticals are detected with dust. This correlation can be understood in two ways. Firstly, the accretion of a black hole requires fuel, and circumnuclear dust is a good indication of cold gas inflow and thus an evidence of fuel supply for the central of AGN. Nevertheless, the existence of ellipticals without visible dust but hosting AGNs, although in small amount: NGC 2832, NGC 3608, NGC 5982, exclude the presumption that nuclear dust is necessary for nuclear activity. On the other hand, Temi et al. (2007a, b) suggested that AGN feedback may play an important role in transporting dust from central reservoir to the interstellar space in ellipticals, this mechanism may also assist to establish such a correlation.
Figure 5 shows plots of luminosity versus luminosity based on IRAS data (Knapp et al. 1989), most of the far-infrared detected galaxies are infrared core galaxies hosting luminous AGN, while 4 inactive galaxies and 1 non-core AGN also show detection but lower luminosities on the whole. This is consistent with the fact that AGN nuclei preferentially exist in optically dusty ellipticals. Although for the most powerful AGNs: NGC 1052, NGC 315, NGC 4261, the far-infrared emission may come from strong radio continuum powered by AGN, it is unlikely that this is the dominant contribution for other fainter AGNs, since their far-infrared emission are too strong comparing with the extrapolation of radio continuum. Additional evidence arises from resolved far-infrared emission in NGC 5077 (Temi et al. 2007b) and equal dust mass between that inferred from far-infrared measurement and that from optical extinction observation in NGC 4125 (Bregman et al. 1998). In dusty ellipticals the dust mass inferred from far-infrared is generally an order of magnitude greater than that from optical extinction observation (Goudfrooij et al. 1994), indicating that the distribution of dust is extended. Therefore, the higher far-infrared luminosities in luminous AGNs than faint AGN and inactive galaxies reveal that correlation between AGN and dust does not only hold for dust at circumnuclear region but also for extended dust throughout the galaxy.

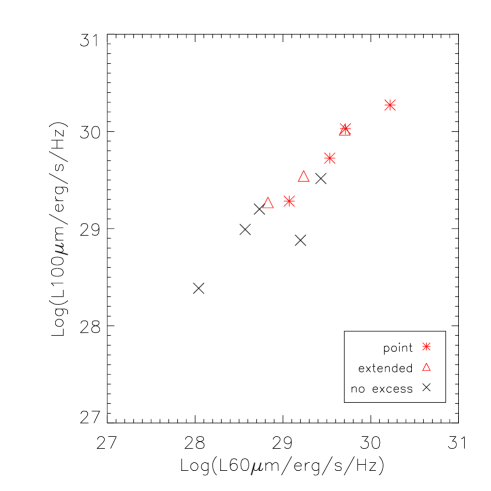
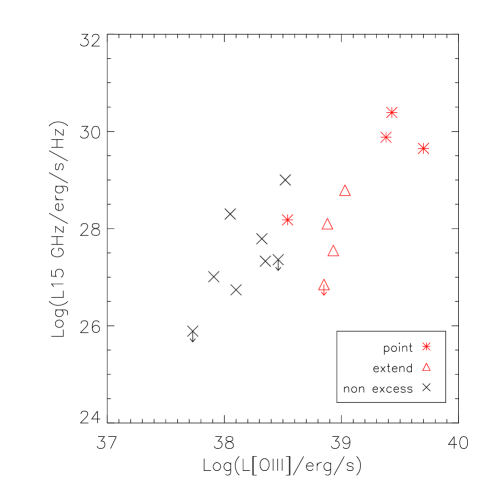
Figure 6 shows the 15 GHz nuclear radio luminosity versus nuclear luminosity for all AGNs in our sample. The nuclear 15 GHz radio luminosities are mainly taken from Nagar et al. (2005), and the nuclear luminosities are taken from Ho et al.(1997), which have been corrected for reddening effect by using the Balmer decrement. It is obvious that infrared core AGNs distinctly separate from non-core AGNs with higher luminosities both at optical and radio wavelength. Especially, for emission, core AGNs and non-core AGNs are completely distinguished at . With respect to radio emission, 7 out of 9 core galaxies have been detected of compact radio nuclei, all of which exhibit flat spectrum—as shown in the last column of Table 3—and high brightness temperature with indicating non-stellar origin.
Figure 6 strongly suggests that the activity of central black hole accounts for infrared excess emission. If infrared excess luminosity is correlated with AGN luminosity, a infrared-red core will intrinsically exist for every AGN, but be too weak to be detected in cases of low luminosity. The four panels of Figure 7 show excess luminosity plotted against nuclear 15GHz radio luminosity, MIPS luminosity, nuclear luminosity and nuclear X-ray luminosity at 2-10keV. The linear fit of data points yields linear-correlation R values of , , and , respectively. While the correlation between excess emission and emission can be simply attributed to similar origins, correlations between excess and radio and hard X-ray emission, further support an AGN origin for infrared core. In comparison, the weak correlation between excess emission and luminosity might be resulted from both extinction and shock ionization. A possible interpretation for the considerable scatter in Figure 7 is unresolved non-AGN sources. Infrared core galaxies with weak excess emission in Figure 3 generally have extended structure, while higher-luminosity sources mainly display point-like morphology, suggesting non-AGN contribution in low luminosity sources. Particularly, the weak emission at in extended sources imply PAHs origin, which are generally detected in dusty ellipticals (Bregman et al. 2006; Kaneda et al. 2008). Yet, PAHs emission, even if exist (For example: NGC 1052, Kaneda et al. 2008), will still play a minor role in strong and point-like sources considering the remarkable emission at wavelength shorter than in these objects.

The contribution of PAHs can be further evaluated by comparing spectral indices at long and short wavelength. Since uncertainties of excess emission are serious at wavelength shorter than , here we only consider three galaxies (NGC 315, NGC 1052, NGC 3226) given their reliable measurement at short wavelength. The approach to derive excess flux density described in Section 3 is based on the assumption that excess emission through IRAC band satisfy a single power-law distribution with a uniform . In order to compare spectral indices between different IRAC bands, the flux density need to be reevaluated in another way. For NGC 315 and NGC 3226, the proportion of non-stellar component at flux density is negligible, thus we assume that all emission is due to old stellar population, following this assumption the derived spectral index is 2.0 for NGC 315 and 3.4 for NGC 3226, while for both galaxies. The spectral indices are similar enough to rule out the possibility of dominant PAHs emission. For NGC 1052, we simply derive the spectral index following the same approach described in Section 3, the derived value is 1.7, also consistent with .
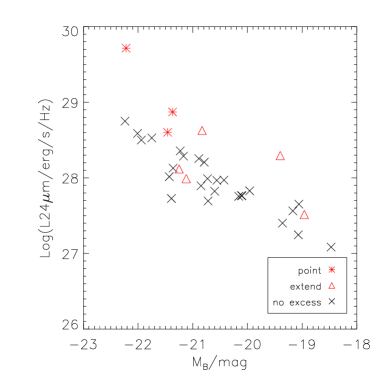
In normal elliptical galaxies, mid-infrared emission is dominated by circumstellar hot dust around AGB stars (Knapp et al. 1992; Temi et al. 2007a). Nevertheless, the tight correlation between MIPS emission and emission in Figure 7 suggests that the sources of both are the same in infrared core galaxies. To examine the origin of MIPS emission, we compare luminosities with optical B-band absolute magnitude in Figure 8. As Temi et al. (2007a) noted in their work, for non-active ellipticals, scales with luminosity, supporting a stellar origin for emissions. Half of galaxies with excess emission also show excess with respect to normal galaxies, while the other four galaxies do not show obvious signs of excess. Thus the tightness of the correlation between MIPS emission and emission should be taken with care when it comes to faint sources, which could be diluted by circumstellar emission.
Three AGN-associated mechanisms can be responsible for the observerd excess infrared emission. The first is thermal emission from nuclear hot dust heated by central AGN, which could be expected in normal Seyfert galaxies. As discussed earlier, in active ellipticals, optically observed circumnuclear dust feature is common , generally with scales of a few hundreds pc. With such distance from nuclei, dust could not be heated sufficiently by AGN to generate observed emission at IRAC band (van Bemmel et al. 2003 & 2004). Hot dust responsible for observed emission, if exist, will lie within a central region of several to about ten pc, where is traditionally assumed as torus and is difficult to be resovled. However, the viewpoint that LLAGNs possess torus as Serferts is challenged by the observed low X-ray column densities in LLAGNs (Terashima et al. 2002; Gonz lez-Mart n et al. 2006) and high detection rate of optical compact core (Chiaberge et al. 1999), which indicates mild obscuration. The disappearance of dust emission is also predicted by ”wind-torus” model, in which obscuring torus is essentially clumpy dusty wind emanating from accretion disk and could not maintain while accretion rate declines to the level insufficient for out flow (Emmering et al. 1992; Konigl & Kartje, 1994; Elitzur et al. 2006). Without hot dust, a second choice to interpret the infrared excess is the synchrotron emission from thermal electrons in accretion flows, existing models of RIAF predict a submillimeter to infrared bump in the SED (Quataert et al. 1999; Yuan et al. 2003). Finally, it is worthwhile to notice that 8 out of 9 core galaxies in our sample present compact radio core, and 4 of which (NGC 315, NGC 1052, NGC 4261, NGC 4374) belong to the category of FR I radio galaxies with kpc scale jets. There is a long-time consideration that the SED of FR I radio galaxies, or even other types of LLAGNs, could be dominated by synchrotron emission from the jet (Chiaberge et al. 1999; Yuan et al. 2002; Falcke et al. 2004). One typical example of jet dominated LLAGN is M87 (Shi et al. 2007; Perlman et al. 2007), where emission from bright knots of jet could be seen at all IRAC bands and nuclear mid-infrared emission is primarily due to the non-thermal emission from the base of the jet. Yet, unlike M87, none of core galaxies in our sample show any signs of jet emission at IRAC band, and our core galaxies generally have radio luminosities lower than M87 by a factor of 100, but comparable infrared excess emission.
As shown in Table 3, for 5 sources in our sample with detectable excess emission throughout the IRAC band, we give their spectral indices following the method described in Section 3. The spectral indices of the 5 galaxies are similar, with values 2, implying a common origin of infrared excess. Such an index value is too steep for a jet dominated SED, which is not expected to be significantly larger than 1.0 (Markoff et al. 2003; Perlman et al. 2007), and too flat for the model of radiation from RIAF, which lies around 3 (Yuan et al. 2003 and private communication with Yuan). A combination of this two components might interpret our derived indices. which could be expected in FR I radio galaxies (Wu et al. 2007). However, it should be noticed that the emission characters at radio wavelength of this 5 core galaxies are not uniform, while 3 galaxies (NGC 315, NGC 1052, NGC 4261) are FR I galaxies with large scale jets and strong radio emission, NGC 3226 and NGC 5322 only show relatively faint compact core and show no extended radio emission (Nagar et al. 2005). Thus it is questionable why the galaxies with distinctive radio-loudness could produce similar spectral energy distribution through hybrid emission including jet and accretion flows. On the contrary, this value is consistent with that of general spectral index of Seyfert nuclei (Alonso-Herrero et al. 2003), supporting origin of thermal emission from hot dust. In addition, Barth et al. (1999) detected polarized broad emission in and only in the 3 FR I galaxies mentioned above (NGC 315, NGC 1052, NGC 4261), out of 14 LLAGNs, and all of them also show considerable absorption X-ray columns () (NGC 1052: Guainazzi et al. 2000; NGC 4261: Sambruna et al. 2003; NGC 315: Gonz lez-Mart n et al. 2006 ), indicating the existence of obscuring structure and at least some contribution of thermal emission. Since these three objects have relatively higher AGN luminosities, it is possible they more closely resemble classical AGNs than other objects in our sample. Therefore, while we are more inclined to attribute the infrared excess of relatively higher luminosity AGNs to dust emission, for evidence of torus in some of them, and for their similar spectral indices with Seyfert2s, the infrared emission mechanism of fainter objects is more uncertain. Our results show that infrared excess emission decreases with the decrease of other AGN indicators, and current data show no sign for a change of infrared emission mechanism. On the other hand, although LLAGNs generally have low X-ray column density, X-ray absorption does not have a direct connection with infrared emission. Firstly, the X-ray inferred column density is determined by obscuring material along our line of sight, while the infrared emission is integrated emission emission from all sources surrounding AGN. Secondly, while both produce X-ray absorption, the contribution of dust-free gas is larger as compared to dusty gas. The important role of dust-free gas in X-ray absorption is supported by lower column density inferred from reddening effect than that from X-ray absorption. (Maccacaro et al. 1982; Maiolino et al. 2001). The insignificant X-ray absorption does not automatically indicate disappearance of dust emission. By assuming Galactic dust-to-gas ratio and ”standard” model of interstellar dust, the column density (Elitzur 2008), a neutral hydrogen column density with a few could still cause a considerable absorption in optical/UV band and thus thermal re-emission in infrared band.
After all, we should acknowledge that current data are insufficient to draw a ultimate conclusion. At the resolution of IRAC, it is difficult to further identify the mechanism to produce nuclear infrared emission among different possibilities. Comprehensive study of the SED might provide more information on this issue.
5 Conclusion
We performed the Spitzer IRAC observations of 36 local elliptical galaxies. 9 out of 36 galaxies display red core structure with nuclear infrared excess emission. The infrared excess emissions only and universally appear in galaxies with relatively luminous central AGN, strongly support a relation between the two. We also confirmed the correlation between the activities of AGN and optically observed circumnuclear dust and found this correlation also holds for extended dust in elliptical galaxies. We found correlation with considerable scatter between the luminosity of central AGN and excess emission, which indicates unresolved non-AGN contamination of excess emission in low-luminosity sources. While the specific mechanism to produce infrared emission could not be identified by current data, thermal origin from hot dust is supported by similar infrared spectral indices with Seyfert galaxies. In order to clarify origins for LLAGNs’ infrared emission, a further study calls for multi-wavelength study, which will be provided in our next work.
ACKNOWLEDGMENTS
We are very grateful to Tom Jarrett and Feng Yuan for their valuable advices. We are also thankful to Tao Wang and Song Huang for helpful suggestions. This work is supported by Program for New Century Excellent Talents in University (NCET), the national Natural Science Foundation of China under grants 10878010 and 10633040, and the National Basic Research Program (973 Program No. 2007CB815405). This research has made use of NASA’s Astrophysics Data System Bibliographic Services and the NASA/IPAC Extragalactic Database (NED), which is operated by the Jet Propulsion Laboratory, California Institute of Technology, under contract with the National Aeronautics and Space Administration. This work is based on observations made with the Spitzer Space Telescope, which is operated by the Jet Propulsion Laboratory, California Institute of Technology, under NASA contract 1407.
References
- [] Alonso-Herrero A., Quillen A. C., Rieke G. H., et al., 2003, AJ, 125, 81
- [] Athey A., Bregman J., Bregman J. 2002, ApJ, 571, 272
- [] Bahcall J. N., Kirhakos S., Schneider D. P. 1996, ApJ, 457, 557
- [] Barth A. J., Filippenko A. V., Moran E. C. 1999, ApJ, 525, 673
- [] Boisson C., Joly M., Moultaka J., et al. 2000, A&A, 357, 850
- [] Bregman J. N., Snider B. A., Grego L. & Cox C. V. 1998, ApJ, 499, 670
- [] Chiaberge M., Capetti A., & Celotti A., 1999, A&A, 349, 77
- [] Del Burgo C., Carter D., & Sikkema G. 2008, A&A, 477, 105
- [] Donley J. L., et al. 2007, ApJ, 660, 167
- [] Dudik R. P., Satyapal S., & Marcu, D. 2009, ApJ, 691, 1501
- [] Elitzur M. & Asensio R. A., 2006, MNRAS, 365, 779
- [] Elitzur M. 2008, NewAR, 52, 274
- [] Emmering R. T., Blandford R. D., Shlosman I. 1992, ApJ, 385, 460
- [] Falcke H., Korrding E. & Markoff S., 2004, A&A, 414, 895
- [] Falomo R., Kotilainen J. K., Scarpa R., Treves A., 2005, A&A, 434, 469
- [] Fazio G. G., Hora J. L., Allen L. E., et al., 2004, ApJS, 154, 10
- [] Ferrarese L. & Merritt D., 2000, ApJ, 539, 9
- [] Flohic, H l ne M. L. G., Eracleous M., Chartas G., et al., 2006, ApJ, 647, 140
- [] Fomalont E. B., Frey S., Paragi Z., 2000, ApJS, 131, 95
- [] Gallagher S. C., Johnson K. E., Hornschemeier A. E., et al. 2008, ApJ, 673, 730
- [] Gebhardt K., Bender R., Bower G., et al. 2000, ApJ, 539, 13
- [] Giovannini G., Cotton W. D., Feretti L., et al., 2001, ApJ, 552, 508
- [] Gonz lez Delgado R. M., et al. AJ, 135, 747
- [] Gonz lez-Mart n O., et al. 2006, A&A, 460, 45
- [] Goudfrooij P., de Jong T., Hansen L., Norgaard-Nielsen H. U. 1994, MNRAS, 271, 833
- [] Greene J. E.; Ho L. C.; Ulvestad J. S., 2006, ApJ, 636, 56
- [] Gu Q.-S., Huang J.-S., Wilson G., Fazio G. G., 2007, ApJ, 671, 105
- [] Guainazzi M., Oosterbroek T., Antonelli L. A., Matt, G. 2000, A&A, 364, 80
- [] Heckman, T. M., 1980, A&A, 87, 152
- [] Ho L. C., 2008, ARA&A, 46, 475
- [] Ho L. C., Filippenko A. V., Sargent W. L. W. 1995, ApJS, 98, 477
- [] Ho L. C., Filippenko A. V., Sargent W. L. W. 1997, ApJS, 112, 315
- [] Ho L. C. 1999 ApJ 516 672
- [] Ho L. C. 2002, ApJ, 564, 120
- [] Ho L. C., Terashima Yuichi, Ulvestad J. S. 2003a, ApJ, 589, 783
- [] Ho L. C., Filippenko A. V., Sargent W. L. W. 2003b, ApJ, 583, 159
- [] Huang J.-S. et al. 2004, ApJS, 154, 44
- [] Hutchings J. B. & Morris S. C. 1995, AJ, 109, 1541
- [] Jones D. L., Wehrle A. E., Piner B. G., & Meier D. L. 2001, ApJ, 553, 968
- [] Kadler M., Ros E., Lobanov A. P., et al. 2004, A&A, 426, 481
- [] Kaneda H., Onaka T., Sakon I., Kitayama T., et al. 2008, ApJ, 684, 270
- [] Kauffmann G. & Heckman T. M. 2005, RSPTA, 363, 621
- [] Kellermann K. I., Vermeulen R. C., Zensus J. A. & Cohen, M. H. 1998, AJ, 115, 1295
- [] Knapp G. R., et al. 1989, ApJS, 70, 329
- [] Knapp G. R., Turner E. L., Cunniffe P. E. 1985, AJ, 90, 454
- [] Knapp G R, Gunn J E, Wynn-Williams, C G. 1992, ApJ, 399, 76
- [] Konigl A. & Kartje J. F. 1994, ApJ, 434, 446
- [] Kormendy J., & Richstone D. 1995, ARA&A, 33, 581
- [] Krajnovic D. & Jaffe W. 2002, A&A, 390, 423
- [] Lauer T. R., Ajhar E. A., Byun, Y.-I., et al. 1995, AJ, 110, 2622
- [] Lauer T. R., Faber S. M., Gebhardt K. 2005, AJ, 129, 2138
- [] Lauer T. R., Gebhardt K., Faber S. M. et al. 2007, ApJ, 664, 226
- [] Lira P., Johnson R. A., Lawrence A., Cid Fernandes R. 2007, MNRAS, 382, 1552
- [] Maccacaro T., Perola G. C. & Elvis M. 1982, ApJ, 257, 47
- [] Macchetto F., Pastoriza M., Caon N., et al. 1996, A&A S, 120, 463
- [] Magorrian J., Tremaine S., Richstone D., et al. 1998, AJ, 115, 2285
- [] Maiolino R., Marconi A., Salvati M., et al. 2001, A&A, 365, 28
- [] Maoz D, Filippenko A. V., Ho L. C., et al. 1996, ApJS, 107, 215
- [] Maoz D, Filippenko A. V., Ho L. C. 1995, ApJ, 440, 91
- [] Maoz D. 2007. MNRAS, 377, 1696
- [] Markoff S., Nowak M., Corbel S., Fender R., & Falcke, H. 2003, A&A, 397, 645
- [] Nagar N. M., Falcke H., Wilson A. S., Ulvestad J. S. 2002, A&A, 392, 53
- [] Nagar N. M., Falcke H., Wilson A. S. 2005, A&A, 435, 521
- [] Pahre Michael A., Ashby M. L. N., Fazio G. G., Willner S. P. 2004, ApJS, 154, 229
- [] Pellegrini S., Baldi A., Fabbiano G., Kim D.-W. 2003, ApJ, 597, 175
- [] Perlman E. S., Mason R. E., Packham C., et al., 2007, ApJ, 633, 808
- [] Quataert E., di Matteo T., Narayan R. & Ho L. C., ApJ, 1999, 525, 89
- [] Ravindranath S., Ho Luis C., Peng C. Y. et al. 2001, AJ, 122, 653
- [] Rest A., van den Bosch Frank C., Jaffe W., et al. 2001, AJ, 121, 2431
- [] Sage L. J., Welch G. A., Young L. M. 2007, ApJ, 657, 232
- [] Sambruna R. M., Gliozzi M., Eracleous M., et al. 2003, ApJ, 586, 37
- [] Shi Y., Rieke G. H., Hines D. C., Gordon K. D., Egami E., 2007, ApJ, 655, 781
- [] Shields Joseph C. 1991, AJ, 102, 1314
- [] Sikora M., Stawarz L., & Lasota J.-P. 2007, ApJ, 658, 815
- [] Simoes Lopes R. D., et al. 2007 ApJ, 655, 718
- [] Temi P., Brighenti F. & Mathews W. G. 2007a, ApJ, 660, 1215
- [] Temi P., Brighenti F. & Mathews W. G. 2007b, ApJ, 666, 222
- [] Temi P., Brighenti F. & Mathews W. G. 2008, ApJ, 672, 244
- [] Temi P., Brighenti F. Mathews W. G. & Bregman J. D. 2004, ApJS, 151, 237
- [] Terashima Yuichi, Ho L. C., Ptak A. F., et al. 2000, ApJ, 533, 729
- [] Terashima Yuichi, Iyomoto Naoko, Ho L. C., Ptak A. F. 2002, ApJS, 139, 1
- [] Terashima Yuichi & Wilson A. S. 2003, ApJ, 583, 145
- [] Tran H. D., Tsvetanov Z., Ford H. C. 2001, et al., AJ, 121, 2928
- [] van Dokkum, P. G. & Franx, M. 1995, AJ, 110, 2027
- [] Verolme E. K., Cappellari M., Copin Y. 2002, MNRAS, 335, 517
- [] Weedman D. W. et al. 2005, ApJ, 633, 706
- [] Weedman D. W. et al. 2006, ApJ, 653, 101
- [] Werner M. W., Roellig T. L., Low F. J. 2004, ApJS, 154, 1
- [] Wiklind T., Combes F., Henkel C. 1995, A& A, 297, 643
- [] Wu Q. -W., Yuan F., Cao, X. -W. 2007, ApJ, 669, 96
- [] Xilouris E. M., Madden S. C., Galliano F. 2004, A&A, 416, 41
- [] Xilouris E. M. & Papadakis I. E. 2002, A&A, 387, 441
- [] Yuan F., Markoff S., Falcke H., Biermann P. L. 2002, A&A, 391, 139
- [] Yuan F., Quataert E. & Narayan, R. 2003, ApJ, 598, 301
- [] Zang Z. & Meurs E. J. A. 1999, NewA, 4, 521
- [] Zhang, Y., Gu Q.-S., Ho L. C. 2008, A&A, 487, 177