11email: frank@grupp-astro.de
22institutetext: Universitäts Sternwarte München, Scheinerstr. 1, 81679 München, Germany
22email: frank@grupp-astro.de
33institutetext: Harvard-Smithsonian Center for Astrophysics, Cambridge, MA 02138, USA
33email: rkurucz@cfa.harvard.edu
44institutetext: National Astronomical Observatories, Chinese Academy of Sciences, Beijing 100012, P. R. China
44email: tan@bao.ac.cn
New extended atomic data in cool star model atmospheres
Abstract
Context. Cool star model atmospheres are a common tool for the investigation of stellar masses, ages and elemental abundance composition. Theoretical atmospheric models strongly depend on the atomic data used when calculating them.
Aims. We present the changes in flux and temperature stratification when changing from iron data computed by R.L. Kurucz in the mid 90s to the Kurucz 2009 iron computations.
Methods. MAFAGS-OS opacity sampling atmospheres were recomputed with Kurucz 2009 iron atomic data as implemented in the VALD database by Ryabchikova. Temperature stratification and emergent flux distribution of the new version, called MAFAGS-OS9, is compared to the former version and to solar flux measurements.
Results. Using the Kurucz line lists converted into the VALD format and new bound-free opacities for Mg i and Al i leads to changes in the solar temperature stratification by not more than 28 K. At the same time, the calculated solar flux distribution shows significantly better agreement between observations and theoretical solar models.
These changes in the temperature stratification of the corresponding models are small, but nevertheless of a magnitude that affects stellar parameter determinations and abundance analysis.
Key Words.:
Atomic data – Sun: abundances – Stars: abundances – Stars: atmospheres – Stars: fundamental parameters – Stars: late-type1 Introduction
Theoretical model atmospheres are the most basic tool in the investigation of stellar parameters such as temperature, mass, age and of the element abundances present in stellar atmospheres. Thus the accuracy in determining all these stellar properties strongly depends on the accuracy and reliability of the underlying stellar atmosphere.
Many studies based on model atmospheres have shown the usefulness of model atmospheres for stellar parameter and abundance work. The work of Fuhrmann and colleagues (Fuhrmann (1998), Fuhrmann (1999), Fuhrmann (2002), Fuhrmann (2004) and Fuhrmann (2008)) on nearby stars of the galactic disk and halo might serve as an example of the validity of this approach. While Fuhrmann stays with the assumption of local thermal equilibrium (LTE), many precision studies of element abundances in cool stars remove this simplification and calculate element abundances based on full radiative and collisional equilibria (Non-LTE). For examples, see e.g. Mashonkina et al. (2008b), Mashonkina et al. (2008a), Shi et al. (2008) and Mashonkina et al. (2009).
For basic work on stellar parameters, that also enters the abundance analysis via the selection of the proper model, Megessier (1998) , Castelli & Kurucz (1994), Castelli (1999), Grupp (2004b) and Grupp & Mashonkina (2008) show the influence of different model atmospheres on various stellar parameter determination methods.
As a basic ingredient, bound-bound and bound-free atomic processes dominate the absorption properties of late type stellar atmospheres over a wide spectral range. Taking into account as complete as possible datasets for these major opacity sources is shown to be vital for accurate stellar parameter and abundance analysis work.
2 The model atmosphere code
Our study is based on the MAFAGS-OS theoretical model atmosphere code described by Grupp (2004a). Based on the ODF version of T. Gehren in the reprogrammed version of Reile (1987), this code relies on the following basic assumptions:
-
•
Plane-parallel 1D geometry.
-
•
Chemical homogeneity throughout the atmosphere.
-
•
Hydrostatic equilibrium.
- •
-
•
No chromosphere or corona.
-
•
Local thermal equilibrium.
-
•
Flux conservation throughout all 80 layers.
While these assumptions might break down for hot stars, stars with very extended atmospheres and the coolest stars, they are valid for stars in the range of T K and for gravities from the main sequence down to .
3 Atomic data
The main target of this study is to investigate the effect of the new Kurucz iron line data on models and energy distributions. These data were compiled for us in a private data extraction run using the VALD (Kupka et al., 1999) database in January 2009 by Tanya Ryabchikova. This private extraction run was performed including predicted levels in all elements of the iron group.
3.1 Old and new line list
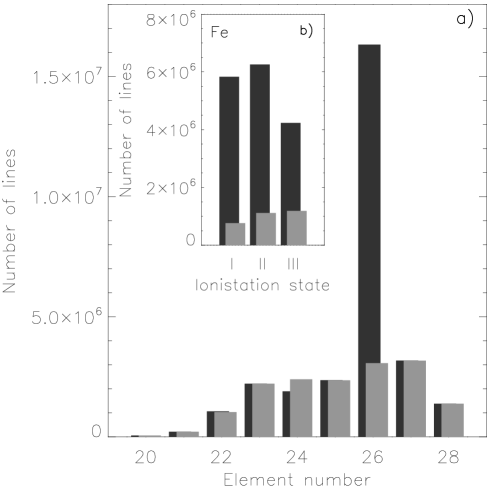
a) For the elements Ca through Ni, sum of ionization states I,II and III.
b) For the first three ionization states of Fe.
Our new line list was compiled based on the abovementioned data extraction of VALD and includes the latest Fe i to iii data of Kurucz (2009), taking into account observed and predicted transitions for each ion. These new calculations for iron included additional laboratory levels and more configurations than earlier work. Thus, the number of lines connecting the levels greatly increased. The line list are completed for the rest of the iron group using observed and predicted levels of Kurucz (1994a), Kurucz (1994c) and Kurucz (1994b). Both the new data of iron and the data for the rest of the iron group elements from the stated Kurucz CD-roms is incorporated in the VALD database used for data extraction by Tanya Ryabchikova. All lines were processed using the data extraction algorithms of VALD(Kupka et al., 1999).
These data replace older data compiled in 1998 from Kurucz (1994a), Kurucz (1994c), and Kurucz (1994b). For the old line lists lines between both observed and predicted levels have been extract making use of the files GFxxyy.GAM and GFxxyy.LIN where xx stands for the atomic numbers 20 through 28 and yy codes the ionisation states 00, 01 and 02. We used our own reduction software adopted from the software delivered with the CDs to process these files.
For the non iron group elements, Kurucz & Bell (1995) data were used in the old line list. Kurucz & Bell (1995) data was also included in the new list, but also its continuous updates incorporated in VALD. For detailed references to the new list see Kupka et al. (1999) and the compilations on the VALD Internet platform111http://vald.astro.univie.ac.at/. Both lists - old and new - contain diatomic molecules taken from Kurucz (1993) and Kurucz (1999).
Figure 1 a) shows the number of lines in the final list for the iron group elements. The enormous increase of iron lines is obvious. Small deviations in the number of Cr lines are due to the fact that in the old list, Cr lines had been included both below 500Åand above 100000Å. These regions are unimportant for the solar line blending and the bug has been corrected in the new version of the line list.
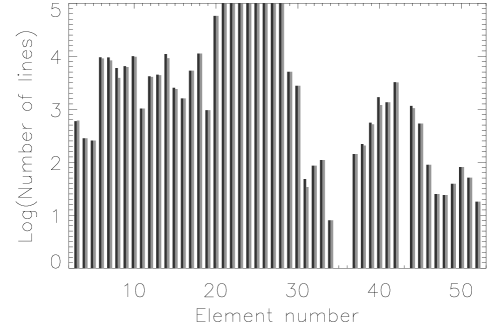
The number of lines for the non iron group elements Li through Te is shown in fig. 2. It becomes obvious that there are few changes for all elements but iron between both lists.
3.2 Changes in continuous opacities
3.3 Line selection
Our model considers the ionization states one, two and three and runs with wavelength points between 500Å and 850000Å. Table 1 shows the number of bound-bound transitions in the new and old line-list together with the number of lines that were selected by the code to sample our standard solar model opacities (For a description of the selection criteria see Grupp, 2004a). The number of selected lines corresponds to our standard solar model. Both line lists contain additional 4247857 lines related to transitions in diatomic molecules.
| List | Total number | Number of selected |
|---|---|---|
| of atomic lines | lines for sampling | |
| 1998 | 16012015 | 322040 |
| 2009 | 35352145 | 621406 |
4 Solar flux and temperature structure
Figure 3 shows the comparison of the old and new models with observed solar flux data from Neckel & Labs (1984) and Woods et al. (1996).
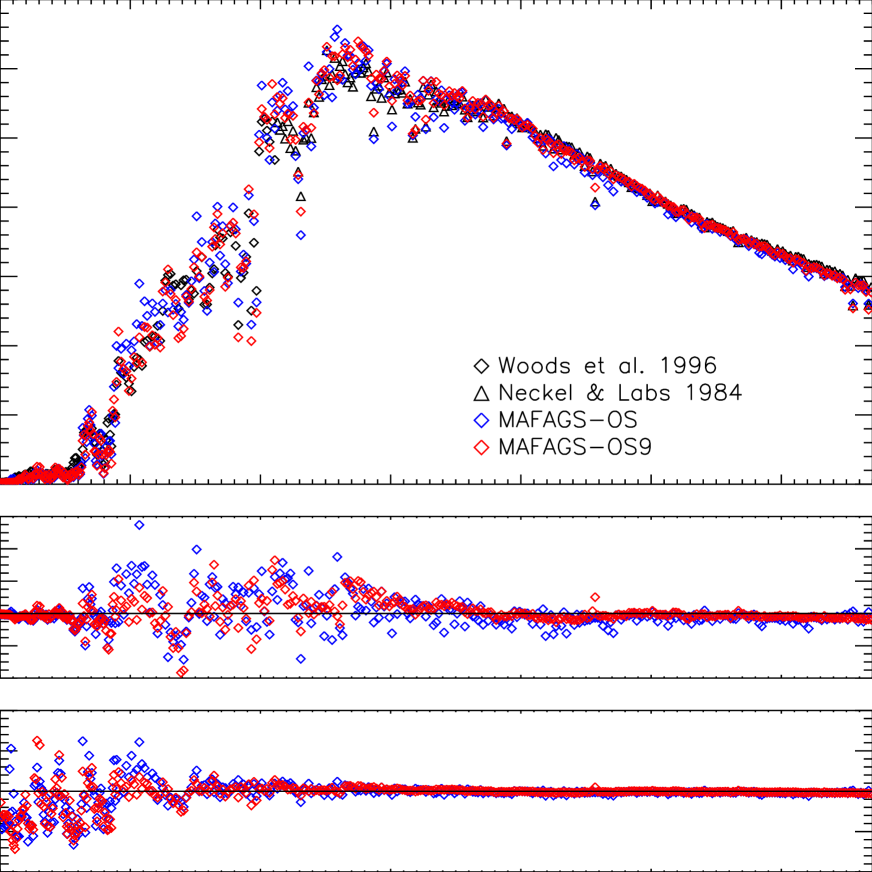
Top panel: Direct comparison of solar flux data.
Mid panel: Deviation of the models from the measured solar flux in absolute values.
Bottom panel: Deviation of the models from the measured solar flux in relative values.
Despite remaining inconsistencies in the wavelength range blueward of 5000Å, it is obvious that the model computed using the new iron data shows both less scatter and better absolute agreement with observed quantities.
Nevertheless, the region between 3000Å and 5000Å shows remaining shortcomings of about % in flux, that reach % at some points. These discrepancies and the slight underestimation of the solar flux in the very scatter-dominated region below 3000Å are present in both datasets. Still, the computations with the new iron data are closer to observation even in those regions.
The flux changes are mainly due to the new data for iron. The influence of new Al i (Mendoza et al., 1995) and Mg i (Butler et al., 1990) bound-free cross sections is shown in Fig. 4. The flux differences are small in the visible wavelength range and contribute only to some larger deviations in the near ultraviolet region. These changes in the UV do not significantly affect the atmosphere stratification, but they can be important for non-LTE calculations, as the departure coefficients of levels with transitions in the UV might well depend strongly on photon processes in this region (see e.g. Shi et al. (2008)). The rest of the input atomic data concerning bound-free transitions is unchanged with respect to the ”old” model.

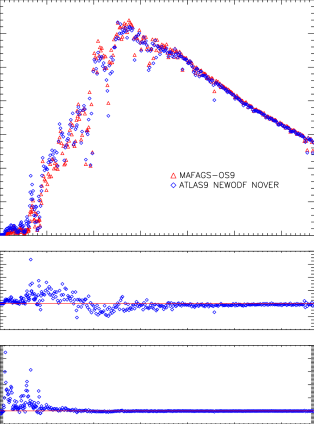
Top panel: Direct comparison of solar flux data.
Mid panel: Deviation of the ATLAS model from the MAFAGS-OS9 model in absolute values.
Bottom panel: Deviation of the ATLAS model from the MAFAGS-OS9 model in relative values.
Figure 5 shows the comparison of our latest model to the ATLAS9 model of Castelli & Kurucz (2003). The selected ATLAS model is the ASUNODFNEW model222http://wwwuser.oat.ts.astro.it/castelli/grids.html computed with new ODFs and the overshooting option turned off.
The ATLAS model chosen uses the new ODF tables of Kurucz and has the overshooting option turned off. While both models show similar flux structure in the red and near IR region, with the ATLAS model having slightly less flux here, they significantly differ in the UV to green part. This leads to the ATLAS model underestimating the observed solar flux in the red and IR by % at 9000Å and to a good agreement between ATLAS and measured solar flux in the green spectral range. Looking at the picture as a whole, neither of the two versions fits the solar flux significantly better than the other, but both have good and not so good spectral regions. The difference between the models is quite likely to emerge from the lack of the new iron lines in the ATLAS9-NEWODFs and some different UV continuous opacity sources used in both models. In addition, the models use different formalisms to treat convection, which will also influence the overall flux distribution.
The changes in solar temperature structure due to the two different line lists are shown in Fig. 6.

The overall effect is small, nevertheless changes of K in the line forming regions will slightly affect line formation.
5 Discussion and conclusions
We have shown the influence of the new iron Kurucz data on the solar model and solar energy distribution. This new data shows significantly better agreement with the observed solar flux with respect to scatter and absolute values. Changing to the new data also slightly changes the solar temperature stratification. Therefore, the new data are shown to be a real improvement of the model and helps to better represent solar atmospheric observables.
Remaining discrepancies are mainly found to be in the short wavelength part below the solar flux maximum. They might be related to missing or inaccurate data in the resonances of strong bound-free absorbers or slight misplacements of the center wavelengths of strong lines.
Some major implications of the improved representation of the stellar flux are:
-
•
Changes in synthetic colors and line indices.
-
•
Changes in abundance analysis due to changes in temperature stratification of the model atmosphere.
-
•
Changes in non-LTE analysis due to changes in the UV fluxes that determine photo-ionization processes emerging from transitions in this spectral region.
-
•
Changes in stellar parameters if they rely on synthetic colors, line indices or individual lines.
-
•
The lower scatter also allows better automatic comparison of synthetic and observed spectral data. A work field that shows increasing importance with large survey projects such as SDSS (York et al., 2000), LAMOST (Su et al., 1998) and GAIA (Perryman et al., 2001) on the way. For those projects the mere number of spectra acquired does not allow for manual inspection, requiring automated procedures of spectral analysis.
Although the impact on the temperature stratification is relatively small, changing to the new data significantly changes the flux of the solar model, placing it into better agreement with observations.
Acknowledgements.
The authors would like to thank Lyudmila Mashonkina for her help in testing and improving MAFAGS-OS in the UV spectral region. Additional thanks go to Thomas Gehren for his continuing support and for sharing his enormous experience with us. We also thank Zhao Gang for promoting our Sino-German collaboration.Our special thanks to Tanya Ryabchikova, Nikolai Piskunov and Denis Shulyak who, by providing the VALD compiled data, made this work possible.
Additional thanks to the referee Fiorella Castelli, through her comments a wrong setting in the line selection was found and corrected.
Part of this work was supported by the German Deutsche Forschungsgemeinschaft, DFG project number Ge 490/31–1, by the National Natural Science Foundation of China under Grants No. 10521001 and 10433010 and by the National Basic Research Program of China (973 Program) under Grant No. 2007CB815103.
References
- Bautista (1997) Bautista, M. A. 1997, A&AS, 122, 167
- Butler et al. (1990) Butler, K., Mendoza, C., & Zeippen, C. J. 1990, in 3rd International Collogium of the Royal Netherlands Academy of Arts and Sciences, ed. J. E. Hansen, 124–+
- Canuto & Mazzitelli (1991) Canuto, V. M. & Mazzitelli, I. 1991, ApJ, 370, 295
- Canuto & Mazzitelli (1992) Canuto, V. M. & Mazzitelli, I. 1992, ApJ, 389, 724
- Castelli (1999) Castelli, F. 1999, A&A, 346, 564
- Castelli & Kurucz (1994) Castelli, F. & Kurucz, R. L. 1994, A&A, 281, 817
- Castelli & Kurucz (2003) Castelli, F. & Kurucz, R. L. 2003, in IAU Symposium, Vol. 210, Modelling of Stellar Atmospheres, ed. N. Piskunov, W. W. Weiss, & D. F. Gray, 20P–+
- Cunto & Mendoza (1992) Cunto, W. & Mendoza, C. 1992, Revista Mexicana de Astronomia y Astrofisica, 23, 107
- Fuhrmann (1998) Fuhrmann, K. 1998, A&A, 338, 161
- Fuhrmann (1999) Fuhrmann, K. 1999, Ap&SS, 265, 265
- Fuhrmann (2002) Fuhrmann, K. 2002, New Astronomy, 7, 161
- Fuhrmann (2004) Fuhrmann, K. 2004, Astronomische Nachrichten, 325, 3
- Fuhrmann (2008) Fuhrmann, K. 2008, MNRAS, 384, 173
- Grupp (2004a) Grupp, F. 2004a, A&A, 420, 289
- Grupp (2004b) Grupp, F. 2004b, A&A, 426, 309
- Grupp & Mashonkina (2008) Grupp, F. & Mashonkina, L. I. 2008, in Astronomical Society of the Pacific Conference Series, Vol. 384, 14th Cambridge Workshop on Cool Stars, Stellar Systems, and the Sun, ed. G. van Belle, 221–+
- Kupka et al. (1999) Kupka, F., Piskunov, N., Ryabchikova, T. A., Stempels, H. C., & Weiss, W. W. 1999, A&AS, 138, 119
- Kurucz (1993) Kurucz, R. 1993, Diatomic Molecular Data for Opacity Calculations. Kurucz CD-ROM No. 15. Cambridge, Mass.: Smithsonian Astrophysical Observatory
- Kurucz (1994a) Kurucz, R. 1994a, Atomic Data for Ca, Sc, Ti, V, and Cr. Kurucz CD-ROM No. 20. Cambridge, Mass.: Smithsonian Astrophysical Observatory
- Kurucz (1994b) Kurucz, R. 1994b, Atomic Data for Fe and Ni. Kurucz CD-ROM No. 22. Cambridge, Mass.: Smithsonian Astrophysical Observatory
- Kurucz (1994c) Kurucz, R. 1994c, Atomic Data for Mn and Co. Kurucz CD-ROM No. 21. Cambridge, Mass.: Smithsonian Astrophysical Observatory
- Kurucz (1999) Kurucz, R. 1999, 1999 TiO linelist from Schwenke (1998). Kurucz CD-ROM No. 24. Cambridge, Mass.: Smithsonian Astrophysical Observatory
-
Kurucz (2009)
Kurucz, R. 2009, http://kurucz.harvard.edu/atoms/2600/,
http://kurucz.harvard.edu/atoms/2601/,
http://kurucz.harvard.edu/atoms/2602/ - Kurucz & Bell (1995) Kurucz, R. & Bell, B. 1995, Atomic Line Data (R.L. Kurucz and B. Bell) Kurucz CD-ROM No. 23. Cambridge, Mass.: Smithsonian Astrophysical Observatory
- Mashonkina et al. (2009) Mashonkina, L., Ryabchikova, T., Ryabtsev, A., & Kildiyarova, R. 2009, A&A, 495, 297
- Mashonkina et al. (2008a) Mashonkina, L., Zhao, G., Gehren, T., et al. 2008a, A&A, 478, 529
- Mashonkina et al. (2008b) Mashonkina, L. I., Vinogradova, A. B., Ptitsyn, D. A., Khokhlova, V. S., & Chernetsova, T. A. 2008b, VizieR Online Data Catalog, 908, 40997
- Megessier (1998) Megessier, C. 1998, in IAU Symp. 189: Fundamental Stellar Properties, 153++
- Mendoza et al. (1995) Mendoza, C., Eissner, W., LeDourneuf, M., & Zeippen, C. J. 1995, Journal of Physics B Atomic Molecular Physics, 28, 3485
- Neckel & Labs (1984) Neckel, H. & Labs, D. 1984, Sol. Phys., 90, 205
- Perryman et al. (2001) Perryman, M. A. C., de Boer, K. S., Gilmore, G., et al. 2001, A&A, 369, 339
- Reile (1987) Reile, C. 1987, Diplomarbeit, Universitäts Sternwarte München
- Shi et al. (2008) Shi, J. R., Gehren, T., Butler, K., Mashonkina, L. I., & Zhao, G. 2008, A&A, 486, 303
- Su et al. (1998) Su, D. Q., Cui, X., Wang, Y., & Yao, Z. 1998, in Presented at the Society of Photo-Optical Instrumentation Engineers (SPIE) Conference, Vol. 3352, Society of Photo-Optical Instrumentation Engineers (SPIE) Conference Series, ed. L. M. Stepp, 76–90
- Woods et al. (1996) Woods, T. N., Prinz, D. K., Rottman, G. J., et al. 1996, J. Geophys. Res., 101, 9541
- York et al. (2000) York, D. G., Adelman, J., Anderson, Jr., J. E., et al. 2000, AJ, 120, 1579