Confirming a Population of Hot Dust Dominant, Star Forming Ultraluminous Galaxies at High-Redshift
Abstract
We identify eight radio sources undetected at 850m but robustly detected at 70m, confirming that they represent ultraluminous infrared galaxies (ULIRGs) with hotter dust temperatures (T=5210 K) than Submillimetre Galaxies (SMGs) at similar luminosities and redshifts. These galaxies share many properties with SMGs: ultra-violet (UV) spectra consistent with starbursts, high stellar masses and radio luminosities. We can attribute their radio emission to star formation since high-resolution MERLIN radio maps show extended emission regions (with half light radii of 2-3 kpc), which are unlikely to be generated by AGN activity. These observations provide the first direct confirmation of hot, dusty ULIRGs which are missed by current submillimetre surveys. They have significant implications for future observations from the Herschel Space Observatory and SCUBA2, which will select high redshift luminous galaxies with less selection biases.
keywords:
galaxies: evolution - galaxies: starburst - galaxies: high-redshift - galaxies: formation - cosmology: observations1 Introduction
The most luminous starbursts in the Universe signal a rapid growth phase in galaxies. Submillimetre Galaxies (bright infrared luminous galaxies with S mJy at ; e.g. Smail et al., 2002; Blain et al., 2002; Chapman et al., 2005) represent some of the best studied ultra-luminous starbursts at high-, and they are likely building some of the most massive galaxies found at the present epoch. However, it has been suggested that selecting 1-3 galaxies by their submillimeter emission is prone to finding specimens with cold average dust temperatures (e.g. Eales et al., 2000; Blain et al., 2004; Chapman et al., 2004) leaving the possibility of a large population of hotter ULIRGs at high redshift.
The far-infrared (FIR) part of the spectrum (8-1000m) is dominated by the re-processed emission from dust and resembles a modified blackbody whose most important variable is the characteristic dust temperature, Td (Blain et al., 2002). At 2, the mean redshift of SMGs, submillimetre observations at 850m sample the emission at a strongly sloped section of the blackbody, the Rayleigh-Jeans tail, where the flux is approximated as S for a given . For example, if Td rises (for fixed LFIR), the peak flux shifts towards shorter wavelengths, away from observed 850m and the submillimeter (submm) flux can easily drop beneath the submm confusion limit (2 mJy for JCMT; Blain, 1999). Current submm instruments restrict studies to those ULIRGs with cooler dust temperatures (T40 K) or the highest luminosities (L1013L⊙), potentially missing a substantial portion of the luminous starbursts at high redshift.
Observations of local ULIRGs (e.g. 60m starbursts; Levine et al., 1998) suggest that dust temperatures can vary substantially in star forming systems, from 20K up to 100K. For a 1013L⊙ local ULIRG, the mean dust temperature is 45K (Rieke et al., 2009) higher than 36K, the mean temperature of similar luminosity SMGs at 1-3. A handful of individual ULIRGs at high redshift have been found to have characteristic dust temperatures around 50-80K (e.g. FSC 10214+4724, Cloverleaf Quasar, IRAS F15307+3252, APM08297+5255). However, they are either exceptionally luminous or strongly lensed, thus detectable at 70m, 850m and 1200m wavelengths with the sensitivity of current instruments. This hints that submm selection may indeed be biased towards colder dust specimens, missing some fraction of hotter dust ULIRGs at high redshift.
At 1-3, many galaxies with hot dust could exist but are difficult to detect and study as a population. The first observational effort to characterize these “hotter ULIRGs” came in Chapman et al. (2004), with a selection of submm-faint radio-selected galaxies with starburst optical/near-IR spectra, similar to SMGs. Since they had similar radio luminosities, redshifts, and optical spectra to SMGs they were thought to be ULIRGs. However, poor constraints on their FIR luminosities provided insufficient evidence of their high bolometric luminosity.
We present eight examples of ULIRGs where observations suggest hot dominant dust temperatures. §2 describes the data and our observations, §3 discusses the galaxies’ physical properties and §4 discusses the selection biases prominent at FIR wavelengths and the context of hot-dust ULIRGs in other galaxy populations. Throughout, we use magnitudes and assume H0= 71 km s-1 Mpc-1 and =0.27 (Hinshaw et al., 2009).
2 Sample and Observations
| NAME | S | S70 | S850 | S1200 | S24 | L | LFIR | SFR | M⋆ | Reff | Td | |
|---|---|---|---|---|---|---|---|---|---|---|---|---|
| (Jy) | (mJy) | (mJy) | (mJy) | (Jy) | (erg s-1) | (L⊙) | (M⊙ yr-1) | (M⊙) | (kpc) | (K) | ||
| RG J123710.60+622234.6 | 1.522 | 38.310.1 | 3.90.5 | 1.8 | 1.8 | 22739 | 9.61042 | 1.41012 | 247 | 1.21011 | 1.7 | 543 |
| RG J123653.37+621139.6 | 1.275 | 86.78.3 | 6.60.4 | 1.4 | 0.7 | 16433 | 2.21042 | 2.01012 | 349 | 1.71011 | 2.9 | 471 |
| RG J123645.89+620754.1 | 1.433 | 83.49.8 | 4.80.4 | 6.3 | 1.6 | 17234 | 5.11042 | 2.71012 | 458 | 3.01011 | 2.1 | 481 |
| RG J105159.90+571802.4 | 1.047 | 74.55.6 | 7.71.2 | 5.9 | 1.4 | 73827 | 2.21042 | 1.01012 | 179 | 6.61010 | 2.7 | 462 |
| RG J105154.19+572414.6 | 0.922 | 45.46.3 | 6.10.9 | 4.3 | 1.7 | 51022 | 1.61042 | 4.61011 | 79 | 8.31010 | 2.0 | 453 |
| RG J105146.61+572033.4 | 2.383 | 33.55.8 | 9.51.1 | 2.4 | 3.1 | 29816 | 1.41043 | 4.11012 | 709 | 2.71011 | 2.1 | 723 |
| ULIRGs with AGN: | ||||||||||||
| RG J123711.34+621331.0 | 1.996 | 126.38.6 | 1.40.4 | 6.0 | 4.4 | 47357 | 1.91043 | 9.71012 | - | 3.51011 | 3.7 | 502 |
| component: | 79.617.2 | 6.11012 | 1047 | |||||||||
| RG J123649.66+620738.0 | 2.315 | 327.08.6 | 5.80.4 | 8.4 | 1.1 | 91278 | 1.31045 | 3.71013 | - | 8.11010 | 2.7 | 571 |
| component: | 196.617.2 | 2.21013 | 3843 |
Observed and derived properties of the eight submm-faint radio galaxies detected at 70m. SFR and LFIR are derived from radio luminosities, M⋆ from stellar population model fits, and Td from modified black body FIR continuum fits constrained by 70m flux densities and normalized to radio luminosity. The temperature uncertainties stated here do not take the uncertainty in the FIR/radio correlation into account (as described in section 3.1). All sources are undetected at 850m and 1200m; the fluxes in the corresponding columns are 2 upper limits. Two sources have AGN in addition to luminous star formation (RG J123711 and RG J123649); their LFIR and SFR have been adjusted to represent just the star forming components in the abbreviated rows ‘RG J… SF component:’; the star forming components have been carefully deconvolved from AGN emission in the MERLIN maps as discussed in §3.4. The effective radius, Reff, is the circularized radius corresponding to a surface area of the 3 MERLIN radio emitting region.
We identified 44 potential hot high- ULIRGs using the Chapman et al. (2004) optically faint radio galaxy (“OFRG”, also submm-faint, star forming radio galaxy, “SFRG”) selection in the GOODS-N and Lockman Hole fields. They were detected in the ultra-deep VLA radio maps of Biggs & Ivison (2006) (S15Jy, 3 ). Spectroscopic follow up of these potential ULIRGs with Keck LRIS revealed starburst spectral features (Chapman et al., 2004; Reddy et al., 2006), mostly at redshifts z1. Obvious spectral AGN were not included in the sample. There were 26 GOODS-N sources and 18 Lockman Hole galaxies selected by this radio/rest-UV spectra method. Their redshift distribution (quartile of 1.2-2.6) is similar to the redshift distribution of radio-selected SMGs (quartile of 1.2-2.8).
The 70m maps of GOODS-N and Lockman Hole are used for further selection. From the sample of 44 radio-selected galaxies, five out of 26 in GOODS-N and three out of 18 are detected at 70m above . These eight galaxies make up the sample we discuss in this paper. The positional offsets between the 70m centroids and the VLA radio positions are no more than 5″, which is sufficiently smaller than the 70m beam size and astrometric uncertainty. See Table 1 for a summary of the observational data. We use the remaining 21 GOODS-N 70m undetected galaxies in a stacking test described in section 3.6 (the Lockman sample is excluded for this test since its 70m map has a much shallower depth).
All sources were observed with the Multi-Element Radio Linked Interferometer Network (MERLIN; Thomasson, 1986; Muxlow et al., 2005), yielding high-resolution 0.3″ (GOODS-N) and 0.5″ (Lockman Hole) beam 1.4-GHz radio maps. Three of the eight galaxies were included in the Muxlow et al. (2005) catalog of HDF radio sources (RG J123711, RG J123653, and RG J123645). The 1200m flux limits come from the Max-Planck Millimetre Bolometer (MAMBO; Greve et al., 2008) and 850m flux limits from SCUBA (Borys et al., 2003; Coppin et al., 2006). Both fields are covered with IRAC (3.6, 4.5, 5.8, and 8.0m) and MIPS (24 and 70m), however at greater depths in all bands in GOODS-N. Optical photometry in GOODS-N is from the ACS111Based on observations made with the NASA/ESA Hubble Space Telescope, and obtained from the Hubble Legacy Archive, which is a collaboration between the Space Telescope Science Institute (STScI/NASA), the Space Telescope European Coordinating Facility (STECF/ESA) and the Canadian Astronomy Data Centre (CADC/NRC/CSA). using the F435W, F606W, F814W, and F850LP filters (B, V, i and z bands). The Lockman Hole has ACS F814W only (PI: Chapman HST 7057). One source in Lockman Hole (RG J105146) is not covered by ACS so we use Subaru/Suprime-Cam i-band instead (Miyazaki et al., 2002). The GOODS-N sources have X-ray coverage from the CDF-N. All are formally undetected in the Alexander et al. (2003) catalog above 5 in the full band (0.5-8.0 keV), yet four sources are marginally detected at fluxes 610-16erg s-1 cm-2. Lockman Hole sources have X-ray coverage from - (Brunner et al., 2008), and none of the sources are formally detected, with a sensitivity limit in the soft band (0.5-2.0 keV) of 1.910-16 erg cm-2 s-1 and 910-16 erg cm-2 s-1 in the hard band (2.0-10.0 keV). No X-ray signal is detectable in a stack of the Lockman Hole sources.
3 Results
3.1 Dust Temperature
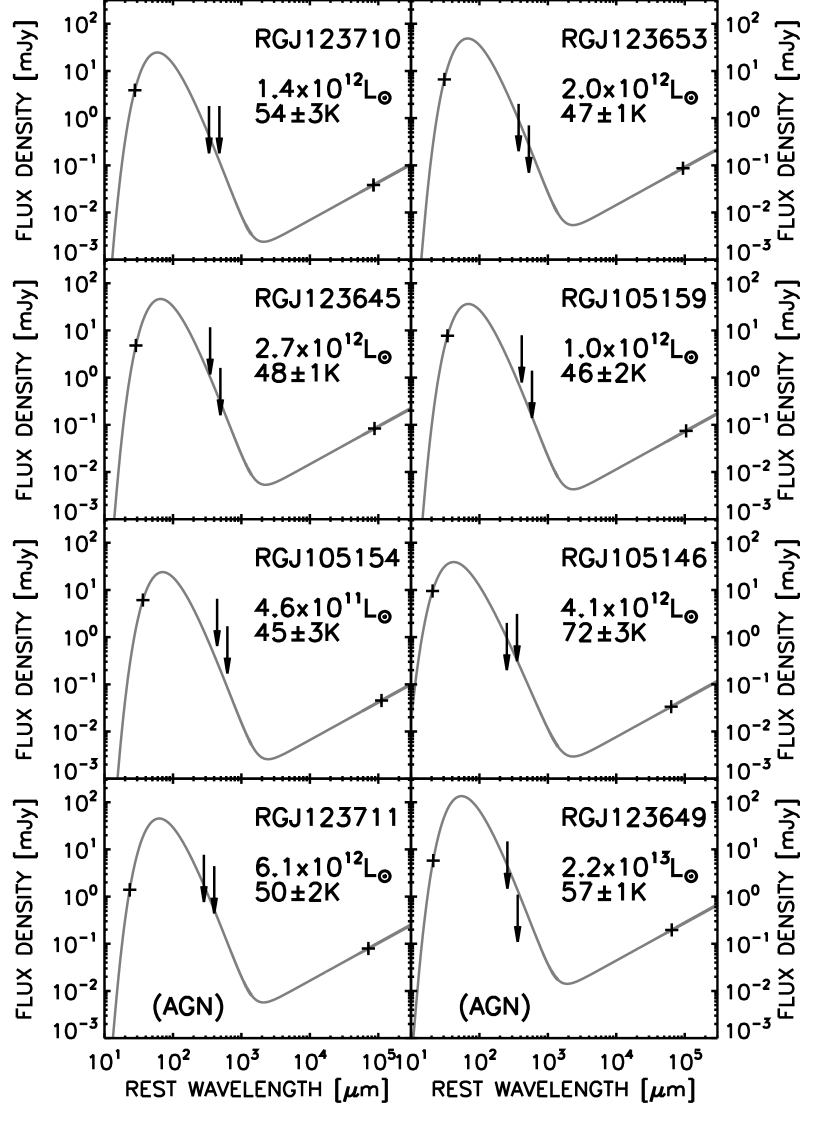
We fit FIR spectral energy distributions (SEDs) to the FIR flux densities (at 70m, 850m, and 1200m) using a modified blackbody emission curve where
| (1) |
is the observed flux density at rest frequency , is the characteristic dust temperature and is the dust’s emissivity. Since we are limited by a lack of data points in the FIR, we must assume that the FIR/radio correlation holds (i.e. that , evaluated from 8-1000m, scales linearly with 1.4GHz radio luminosity; Condon, 1992). While recent works (e.g. Bell, 2003; Beswick et al., 2008) indicate that the correlation might deviate at higher redshifts and lower flux densities, its effect on the dust temperature calculation would be systematic. The 0.2 dex scatter found for the local FIR-radio relation suggests an additional uncertainty to our estimates. We note that the additional uncertainties would apply equally to the galaxies in this paper as well as the Chapman et al. (2005) SMGs; foremost, we wish to highlight the temperature difference between the two populations rather than their absolute temperatures.
To calculate temperature, we require an additional constraint to reasonably fit the small number of photometric points with a modified blackbody. We fix and adopt a single temperature characterization of the emission, although it is recognized that dust components of a range in temperatures are required to accurately describe well studied nearby galaxies (e.g. Dale et al., 2001). We have tested that our fits are relatively insensitive to by also using , and finding only small () differences in the fitted . Fig. 1 shows the best fit modified blackbodies and derived temperatures for our galaxy sample. These blackbody SEDs are combined with radio synchrotron emission () which is fit through the 1.4 GHz flux densities. Best fit dust temperatures are listed in Table 1.
3.2 Stellar Mass
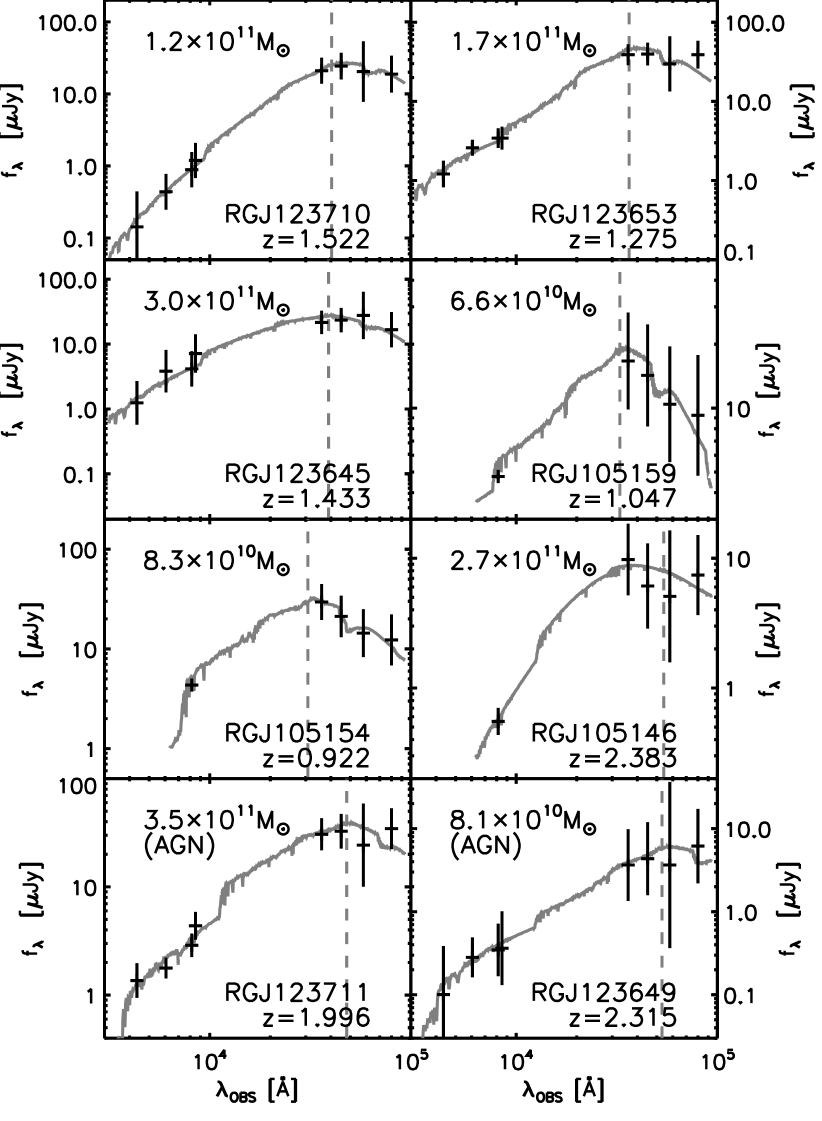
To estimate the galaxies’ stellar masses, we combine the photometric points in the optical ( ACS , , , and for GOODS-N and ACS for Lockman Hole) and the near-IR (-IRAC 3.6m, 4.5m, 5.8m and 8.0m). For 1-3, these photometric points cover the rest-frame 1.6m wavelength where stellar emission peaks. We use the hyperz photometric redshift code (Bolzonella et al., 2000) to fit this photometry to several stellar population SEDs (Coleman et al., 1980). The optimized stellar population fits are shown in Fig. 2. Measured output includes internal extinction factor AV and rest-frame K-band magnitude (which we use to measure stellar mass with the method outlined by Borys et al., 2005, assuming a mean light-to-mass ratio of LK/M = 3.2). This analysis indicates that the systems are quite massive and comparable to the stellar masses of the Borys et al. SMGs, with mean M21011M⊙. We note that Alexander et al. (2008) and Chapman et al. (2009) point out that the Borys et al. method of using K-band luminosities overestimates stellar masses since it does not correct for the AGN contribution to 8m flux density or sample the stellar emission at its peak; while also a probable systematic error in our data set, the effect applies equally to SMGs and hot-dust ULIRGs. Only one source, RG J123711, shows an excess 8m flux, indicative of AGN power law emission; its stellar mass is likely overestimated. Derived stellar masses are listed in Table 1.
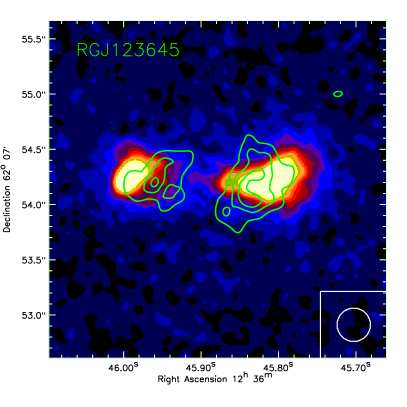
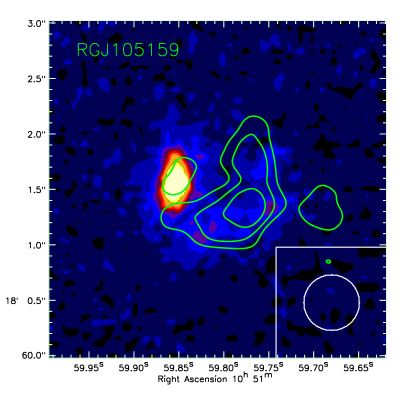
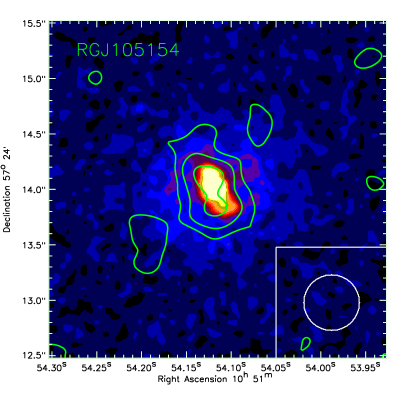
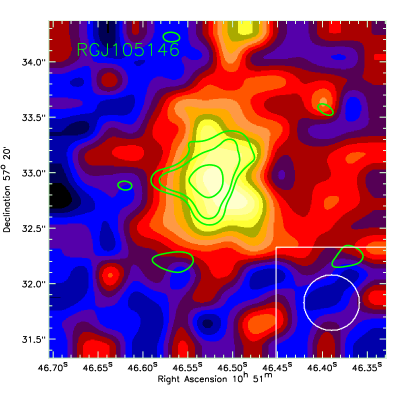
3.3 MERLIN Radio Morphology
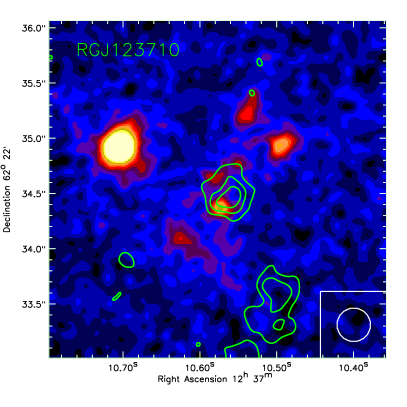
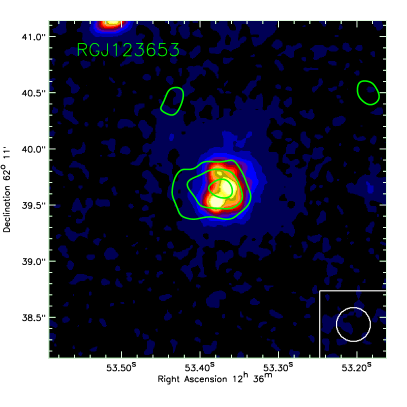
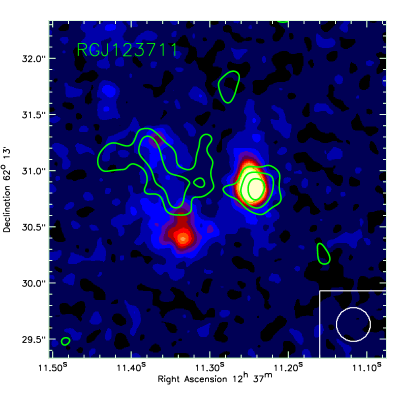
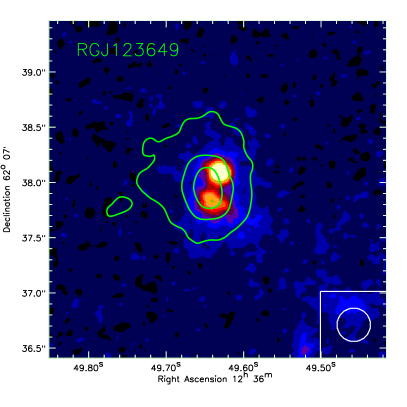
We use the high-resolution MERLIN radio maps to assess the contribution of AGN to these galaxies by considering their radio morphology, which is shown as contour overlays on optical imaging in Fig. 3. With resolutions of 0.3″ and 0.5″ per beam (for GOODS-N and the Lockman Hole respectively), the smallest resolvable structure at z1.5 would be 3-5 kpc across; however, the typical size of an AGN emission region at radio wavelengths is much less than 1kpc. This implies that an AGN dominated source would be completely unresolved in MERLIN radio maps (e.g. Casey et al., 2009). Fig. 3 shows that each of these galaxies has extended emission regions on 8 kpc scales, suggestive of spatially distributed star formation, unlikely to be generated by AGN. The effective radii corresponding to the surface areas of the radio emission regions () are given in Table 1. While the morphologies are irregular, we find that the effective radii average to 2.50.6 kpc, which agrees with the size measurements of SMGs in (Biggs & Ivison, 2008).
3.4 AGN Content
As their selection as SFRGs requires, these eight galaxies have rest-frame ultraviolet spectral features that are consistent with starbursts and do not exhibit features of active nuclear activity (e.g. no C IV absorption). Except for RG J123649, their X-ray luminosities (we assume ) are less than 31043erg s-1. These low X-ray luminosities are consistent with star forming galaxies with little contribution from AGN (e.g. Alexander et al., 2005). With the exception of RG J123649 and RG J123711, the 6 remaining galaxies also have low 24m flux densities (Jy). Low 24m luminosity is more strongly associated with star formation than AGN emission.
The two hot-dust ULIRGs RG J123711 and RG J123649 which have the highest X-ray luminosities and mid-IR luminosities of the sample might contain powerful AGN despite a lack of rest-UV AGN spectral features. The MERLIN radio emission in RG J123711 (bottom left panel in Fig. 3) is separated in two components: an extended region to the NE (63 percent of the integrated flux), and a bright compact region to the SW (37 percent). The X-ray source coincides with this SW component. In contrast, a large 1010 M⊙ molecular gas reservoir (a strong case that substantial star formation may be present) has been detected in CO and is morphologically separated evenly across the two NE and SW components (Chapman et al., 2008, Casey et al. 2009, in prep). For these reasons, we believe the NE region is likely a star forming ULIRG merging with the SW region, an AGN-dominated galaxy.
While the existence of an AGN in RG J123649 is supported by a bright X-ray luminosity and a compact core in optical imaging, there is no sign of AGN activity in the optical spectrum or in its 8 kpc extended radio morphology. We estimate that AGN emission is 4030 percent and the star forming component is 6030 percent of the radio flux by deconvolving an unresolved 0.3″ PSF from its radio morphology. We adjust the radio luminosity and inferred SFRs of both RG J123711 and RG J123649 to solely represent the estimated star forming components (see Table 1, “RG J… SF component:”). We have also labeled both galaxies as AGN in Fig. 1 and Fig. 2 to clarify that they differ from the other six.
It is possible that these two galaxies’ 70m flux densities are dominated by emission from torus dust surrounding the AGN (which can have very hot dust temperatures, 1000 K). However, disentangling the relative contributions of AGN and star formation to 70m flux density is beyond the scope of this study since it requires detailed knowledge of the FIR SEDs. For this reason, we exclude RG J123711 and RG J123649 from further analysis of the hot dust ULIRG aggregate properties, since we wish to characterize the properties of star formation dominated ULIRGs exclusively.
There is no evidence to suggest that the remaining six galaxies contain significantly luminous AGN. With a sample size of eight galaxies, two of which likely contain AGN, the total AGN fraction in the population is 25 percent. This is consistent with the estimated AGN fraction of Submillimetre Galaxies, between 20-40 percent, from Alexander et al. (2005).
3.5 Star Formation Rates
We estimate SFRs from the VLA radio luminosities, using the radio/FIR correlation for star forming galaxies (Condon, 1992; Helou et al., 1985; Sanders & Mirabel, 1996). We abstain from calculating UV-inferred SFRs since they would be subject to significant (yet uncertain) extinction factors (as evidenced by the irregular MERLIN radio morphologies relative to the distribution of rest-UV flux in Fig. 3). The FIR luminosities derived from the radio are consistent with the submm detection limits and the flux densities at 70m as shown in Fig. 1. The inner quartile (25-75 percent) of star formation rates in this sample is 200-1100M☉ yr-1 (both derived quantities, LFIR and SFR are given in Table 1).
Star formation rate densities are found by dividing these SFRs by the surface areas of MERLIN radio emission regions. Comparing these SFR densities to their theoretical maximumthe maximum gas density divided by the local dynamical time (see equation 5 of Elmegreen, 1999, we use tdyn= 4107yr)we can determine if the implied SFR density exceeds the theoretical prediction. While local ULIRGs with 200 M☉ yr-1 kpc-2 are forming stars at their theoretical maximum (e.g. Tacconi et al., 2006), none of the galaxies come within a factor of four of exceeding their maximum SFR density limits.
We note that one of the eight galaxies of our sample, RG J123710, has been detected in CO gas by Daddi et al. (2008). The presence of a molecular gas reservoir 1010 M⊙ indicates that high levels of star formation (100 M☉ yr-1) can potentially occur. In their interpretation of the detection, Daddi et al. claims that RG J123710 is most likely a spiral galaxy undergoing modest-efficiency star formation lower than most SMG ULIRGs. However, our detection of RG J123710 at 70m directly confirms that it is a ULIRG. More CO observations are needed to investigate if the rest of the hot-dust ULIRG population exhibits modest star formation efficiencies or high, SMG-like efficiencies (Casey et al., in preparation).
3.6 70m Undetected SFRGs
Our eight galaxy sample likely represents the most luminous subsample of the hot-dust ULIRG population because of the current limitations in 70m surveys. To investigate the possible lower-luminosity extension of the population, we analyze the 21 GOODS-N galaxies which were selected as SFRGs but not detected at 70m (the Lockman sample is excluded since its 70m coverage has a much shallower depth). Here, we stack 70m cutouts of these 21 SFRGs, centered on their VLA positions. We use the stacking method described in Huynh et al. (2007) and Hainline et al. (2009) which was used to stack 68 70m undetected SMGs. We have a detection of 0.450.15 mJy in the SFRG stacked image at 3.0, which is comparable to the 0.480.15 mJy 3.2 detection for the SMGs of Hainline et al. This indicates that SMGs and 70m-undetected SFRGs likely have similar 70m luminosities, although larger samples of SFRGs are needed to see if their relative detection rates at 70m are similar. Because of their detection at 70m, the eight SFRGs of this paper are likely the highest luminosity (z3) and potentially the hottest dust temperature specimens of the SFRG population.
4 Discussion
4.1 Volume Density
The volume density is estimated by constraining the density of galaxies satisfying our selection criteria. The density of these 70m detected ULIRGs is 1.410-5 Mpc-3. However, the difference in volume density estimates between GOODS-N and Lockman Hole, which is expected due to the 70m sensitivity differences between the two fields, prevents us from constraining the hot-dust ULIRG luminosity function well.
While this explicit population of hot-dust ULIRGs is more rare than SMGs, there likely exists a larger population of ULIRGs with hot dust temperatures. Firstly, spectroscopic incompleteness of 50 percent suggests the sample is likely twice as large (although it is noted that SMGs are also affected by spectroscopic incompleteness). Secondly, there are likely additional ULIRGs at undetected in the radio (for instance from scatter in the FIR/radio relation). Finally, the 70m sensitivity limits of these maps do not exclude many of the other SFRGs in our parent sample from having warm enough dust to still represent hotter ULIRGs than SMGs. As we have shown in our analysis of the GOODS-N sample, proportionally more SFRGs are 70m detected than SMGs; as also indicated by the stacked result of 70m undetected SFRGs, many more SFRGs might become 70m detected if the GOODS-N 70m depth can be achieved in other fields. The Herschel Space Observatory will dramatically improve the uniformity and depth of 70m coverage (confusion limit of 0.04 mJy at 2), potentially discovering many of the ULIRGs that lay just below the current MIPS detection limits.
4.2 Selection Effect in - and Redshift
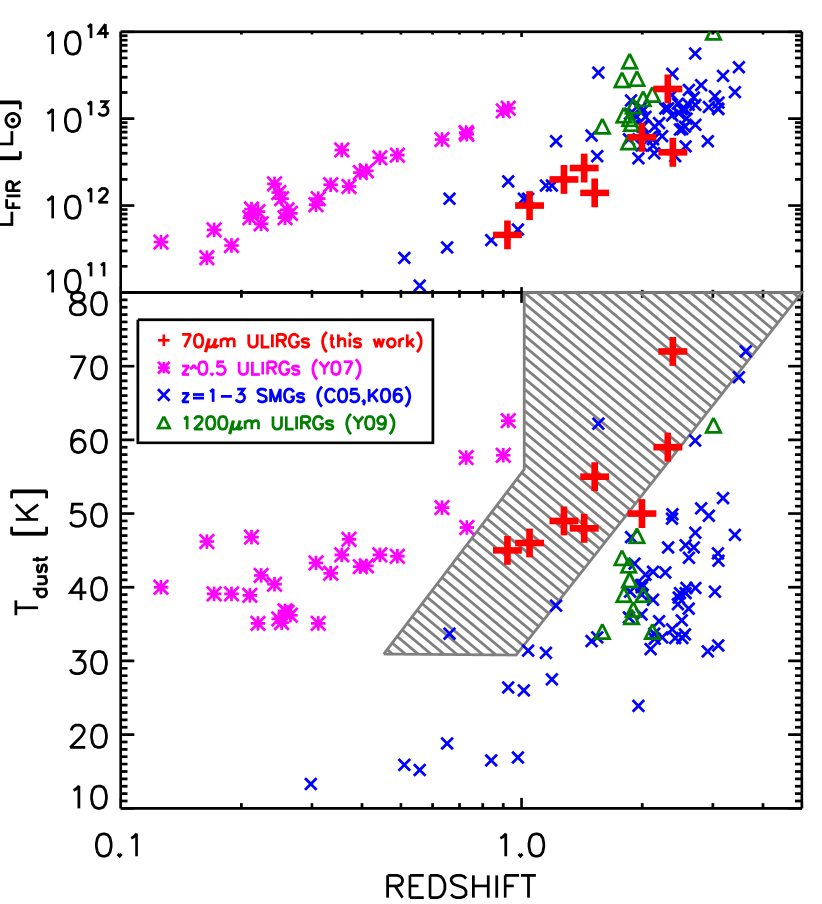
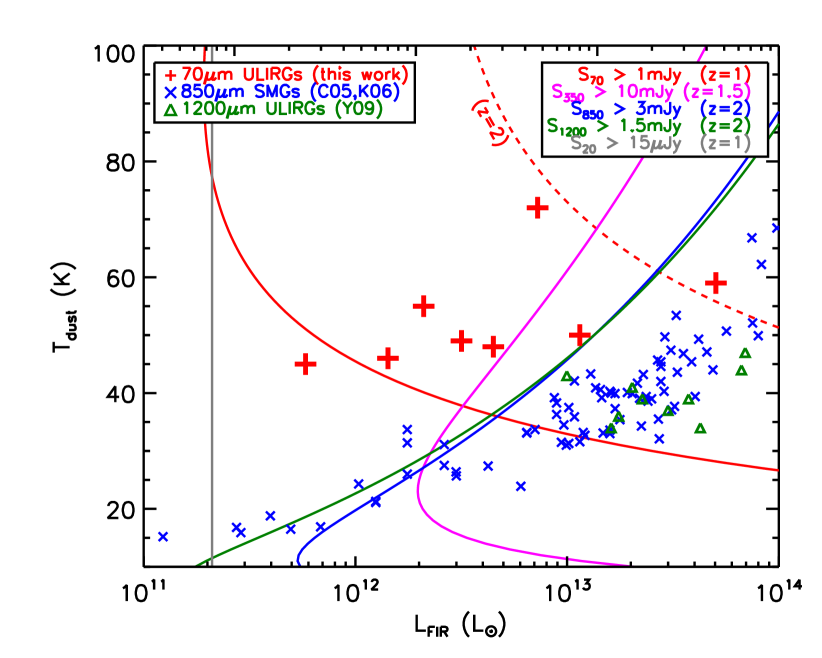
Fig. 4 illustrates the selection effects of IR-wavelength observations as a function of FIR luminosity and characteristic dust temperature. Assuming the radio/FIR correlation, radio detection is independent of dust temperature. At , a 1013 L⊙ system is only detectable at 850m or 1200m if it has T. Since the mean redshift of radio-detected SMGs is , the dust temperature selection-effect significantly impacts the proposed surface density of ULIRGs and thus their contribution to the global star formation rate density near . If instead we select objects by the methods of this paper at 70m, the dust temperature selection effect is inverted, and detection is possible for the hottest 2 sources (T). By lowering the redshift boundary from to , detection is possible for 1013 L⊙ galaxies that have T.
While the FIR selection functions have hard boundaries in and , their dependence on redshift is important. From Fig. 4, we see that 70m selection is not ideal for samples where it is limited to temperatures Td 70 K whereas at it can select a wider range of ULIRGs with Td 40 K. In Fig. 5 we show the projections of both and with redshift. This highlights that the luminosities of the 70m-selected sample are comparable to SMGs at the same redshift. However, as a function of dust temperature, the 70m galaxies occupy an unexplored region in which is heavily restricted by the selection biases illustrated in Fig. 4.
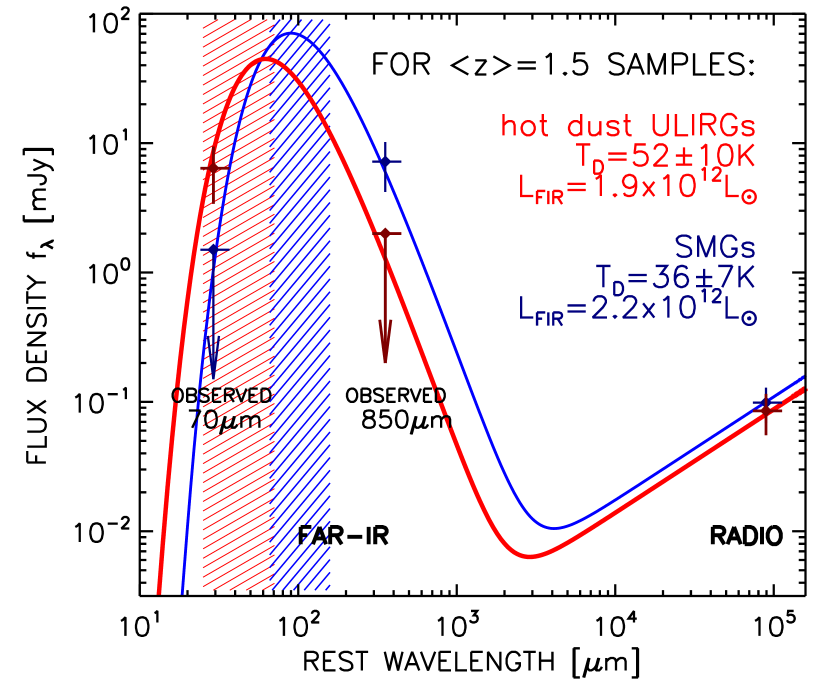
4.3 Comparison of SED shape to SMGs
A direct comparison of the observationally derived SED for these hot dust ULIRGs with SMGs is shown in Fig. 6. We average the 70m detections, 850m upper limits, and radio detections of the six star formation dominant hot dust ULIRGs to form our composite SED; the composite SED adopts the mean redshift (), FIR luminosity (1.91012 L⊙), and dust temperature (52 K) of the six galaxy sample. Since SMGs have a mean redshift of 2.2, we take several comparable sub-samples of GOODS-N and Lockman Hole SMGs to generate an average SMG SED with mean redshift 1.5. The resulting mean luminosity of this SMG sub-sample is 2.21012 L⊙ with dust temperature 36 K.
Based on these SED fits, we do not expect SMGs to be detected at 70m. This agrees with observations; nearly all SMGs (68/73, 93 percent) are undetected 3 at 70m (Hainline et al., 2009). Those that are 70m-detected are at low- and have higher luminosities than most SMGs at low redshifts. To compare the SMG and SFRG populations, we compare their 70m detection rates. We limit this test to since the redshift selection functions for the populations differ (submm+radio selection and radio selection have different redshift biases; see Chapman et al., 2005). This removes most effects of redshift-bias from radio detection in both samples. SMGs and SFRGs have similar radio luminosities, so the same fraction of each should be detected at 70m if they have the same distributions in dust temperature. In GOODS-N, where the observations are deepest and the most complete, 4/8 (5025 percent) z2 submm-faint radio galaxies are detected at 70m but only 1/14 (77 percent) of submm-bright radio galaxies (SMGs) are detected (Chapman et al., 2005; Pope et al., 2006, 2008). The Lockman Hole observations do not have nearly the depth as those of GOODS-N and thus have fewer sources; however, the statistics are consistent with the finding in GOODS-N, with 3/7 (4325 percent) submm-faint galaxies detected at 70m and only 1/5 (2020 percent) SMGs detected. Therefore, in contrast to SMGs, galaxies selected by our method (SFRG selection) are far more likely to be detected at 70m (30-50 percent).
4.4 Comparison to other IR Selection Techniques
Since the advent of and other infrared observatories, the population of dusty galaxies studied at high redshift has grown substantially. Many of these galaxies are more bolometrically luminous than typical UV-selected galaxies, but they may be poorly understood as a population due to faintness in the optical. Furthermore, the optical counterparts for 850m and 70m sources are not easily identified due to the 12-20″ beam size; for these reasons, substantial portions of SMGs and ULIRGs have no redshift identification. Similar problems exist for other IR-selected galaxies. Here, we contrast the hot dust ULIRGs in this paper to other infrared-selected, dusty galaxy populations at , noting potential overlap of selection techniques.
To circumvent the problems that arise from FIR selection (increased beam size and poor sensitivity limits), many dusty galaxies are selected in the mid-IR by their observed 24m flux densities. However, the selection of dusty star-forming LIRGs and ULIRGs through mid-IR 24m continuum diagnostics is frequently contaminated by power law emission from AGN, and inferring star formation properties can require large correction factors to bolometric luminosity (e.g. Dale et al., 2005; Papovich et al., 2005). All eight galaxies in our sample are classified as Dust Obscured Galaxies (DOGs; Dey et al., 2008; Pope et al., 2008); however, the selection criteria of DOGs is so broad that without detailed additional information (the radio maps, FIR detections and non-detections, and near-IR photometry) it is difficult to understand the importance or evolutionary significance of this classification. We further emphasize that 3/8 specimens in our 70m sample have S300Jy (and are only selected as DOGs under the selection described by Pope et al.), revealing that ultraluminous activity at 1-3 can be missed by 24m selection criteria.
A recent study by Younger et al. (2009) presents 12 ULIRGs in the EGS field, selected in the IRAC and MIPS bands and followed up with MAMBO at 1200m (where 9/12 are detected). They have a characteristic dust temperature (using modified blackbody fits) and are shown in Fig. 4 and Fig. 5. The 12 Younger et al. galaxies bridge the gap between SMGs and hot 70m-detected sources in temperature but are much more luminous than the 70m sample. They have a mean 1200m flux density of mJy where our 70m sample is uniformly undetected222The depth of MAMBO coverage in GOODS-N is 0.7-0.8 mJy RMS compared to the 0.4 mJy photometric RMS of the EGS pointings, while Lockman Hole has 0.8-1.0 mJy RMS.. This would imply that the 12 EGS galaxies have 850m flux densities 3-6 mJy, FIR luminosities (8-1000m) 1013 L⊙ and thus could be classified as SMGs. The selection of the Younger et al. sample in the mid-IR, by the presence of a prominent stellar bump in photometry and dust at 24m, is similar to the DOG selection, although with a few additional constraints reveals a potentially strong probe of ultraluminous activity at high redshift. However, more far-IR observations of mid-IR selected samples are needed to assess the selection’s completeness in choosing both star forming ULIRGs and AGN dominated ULIRGs at .
Selection at 350m at z2 has similar temperature biases as 850m and 1200m due to its high flux limit (S10 mJy at 2). As seen in Fig. 6, 350m selection at has the potential to select SMGs and hot-dust ULIRGs equally well since it samples the dust SED near its peak for a wide range of temperatures. However, until the depth of 350m imaging can be improved, current observing facilities allow only 350m detections of the most luminous or low redshift sources (e.g. Yang et al., 2007). The Balloon-borne Large Aperture Submillimeter Telescope (BLAST) has recently mapped the Chandra Deep Field South at 250m, 350m, and 500m at greater depth than has been done before in any field at those wavelengths (Patanchon et al., 2009). While useful for measuring the flux densities of already known ULIRGs and high-redshift galaxies, the statistically significant source counts in the BLAST map are limited (with only 12 galaxies detected at z1; Viero et al., 2009). When it begins full operations, the Herschel Space Observatory will be another observing tool at 350m and will dramatically improve the depth of 70m observations in many heavily observed fields, thus providing better statistics at shorter FIR wavelengths. In addition, future work from the SCUBA2 instrument at 450m have the potential to expand the sample of ULIRGs through deeper observations near the peak of the dusts’ SED.
5 Conclusions
This paper has observationally demonstrated that submillimetre wavelength observations of galaxies at have a strong temperature bias which preferentially detects galaxies with cooler dust temperatures. By selecting ULIRGs that are detected at 70m (and verifying that they are starburst dominated) we have found a set of galaxies which are undetected in the submillimetre yet still represent some of the most luminous systems at . Their volume density is 1.410-5 Mpc-3, approximately 5 more rare than SMGs, although this has likely been underestimated due to spectroscopic incompleteness and large variations in the sensitivity limits of 70m surveys.
Like most IR-selected dusty galaxies, the SFRs in these hot dust ULIRGs are on average much higher than the majority of UV-selected star-forming galaxies at the same epoch. While some UV-selected sources have high stellar masses (Shapley et al., 2005, Hainline et al., in preparation) they show consistently lower SFRs, reiterating that the UV misses the most dramatic star-forming galaxies at high redshift. Due to their similarity with SMGs (in terms of stellar mass, UV-spectra, FIR and radio luminosities), the hot-dust ULIRGs represent an extension of SMGs towards a wider range of dust temperatures at z, similar to the already observed wide range in dust temperatures seen in local ULIRGs.
We have shown that AGN contribute little to the FIR luminosities in six of the eight hot dust ULIRGs. The detection of extended radio emission (with typical radii 2-3 kpc) suggests spatially distributed star formation rather than compact AGN. In addition, the UV-spectral properties and low X-ray luminosities are consistent with star formation. The two ULIRGs that do show signs of AGN activity also have evidence for substantial star formation and are therefore comparable to SMGs which contain bright AGN.
Combining our hot-dust ULIRG population with the SMGs results in a sample of ULIRGs with less temperature-dependent bias than the SMG population alone. However, we have shown that searches for high redshift FIR luminous galaxies are likely still somewhat incomplete. Even at , there are likely other FIR luminous galaxies which are not well characterized by current submm or FIR observations. and SCUBA2 will help push detection of more ULIRGs in the 50-500m range while more work with deeper radio observations (from e-MERLIN and EVLA) will be needed to find potential ULIRG activity beyond . By working towards completeness in the ULIRG population, we will learn about the role of heavy, short-lived star formation in the formation and evolution of galaxies in the early Universe.
Acknowledgments
We thank the anonymous referee for helpful comments which improved the paper. This work is based, in part, on observations made with MERLIN, a National Facility operated by the University of Manchester at Jodrell Bank Observatory on behalf of STFC, and the VLA of the National Radio Astronomy Observatory, a facility of the National Science Foundation operated under cooperative agreement by Associated Universities, Inc. CMC thanks the Gates-Cambridge Trust, and IRS thanks STFC for support.
References
- Alexander et al. (2005) Alexander D. M., Bauer F. E., Chapman S. C., Smail I., Blain A. W., Brandt W. N., Ivison R. J., 2005, ApJ, 632, 736
- Alexander et al. (2003) Alexander D. M., et al., 2003, AJ, 126, 539
- Alexander et al. (2008) Alexander D. M., et al., 2008, AJ, 135, 1968
- Bell (2003) Bell E. F., 2003, ApJ, 586, 794
- Beswick et al. (2008) Beswick R. J., Muxlow T. W. B., Thrall H., Richards A. M. S., Garrington S. T., 2008, MNRAS, 385, 1143
- Biggs & Ivison (2006) Biggs A. D., Ivison R. J., 2006, MNRAS, 371, 963
- Biggs & Ivison (2008) Biggs A. D., Ivison R. J., 2008, MNRAS, 385, 893
- Blain (1999) Blain A. W., 1999, MNRAS, 304, 669
- Blain et al. (2004) Blain A. W., Chapman S. C., Smail I., Ivison R., 2004, ApJ, 611, 52
- Blain et al. (2002) Blain A. W., Smail I., Ivison R. J., Kneib J.-P., Frayer D. T., 2002, Phys. Rep., 369, 111
- Bolzonella et al. (2000) Bolzonella M., Miralles J.-M., Pelló R., 2000, A&A, 363, 476
- Borys et al. (2003) Borys C., Chapman S., Halpern M., Scott D., 2003, MNRAS, 344, 385
- Borys et al. (2005) Borys C., Smail I., Chapman S. C., Blain A. W., Alexander D. M., Ivison R. J., 2005, ApJ, 635, 853
- Brunner et al. (2008) Brunner H., Cappelluti N., Hasinger G., Barcons X., Fabian A. C., Mainieri V., Szokoly G., 2008, A&A, 479, 283
- Casey et al. (2009) Casey C. M., Chapman S. C., Muxlow T. W. B., Beswick R. J., Alexander D. M., Conselice C. J., 2009, MNRAS, 395, 1249
- Chapman et al. (2009) Chapman S. C., Blain A. W., Ibata R., Ivison R. J., Smail I., Morrison G., 2009, ApJ, 691, 560
- Chapman et al. (2005) Chapman S. C., Blain A. W., Smail I., Ivison R. J., 2005, ApJ, 622, 772
- Chapman et al. (2008) Chapman S. C., et al., 2008, ApJ, 689, 889
- Chapman et al. (2004) Chapman S. C., Smail I., Blain A. W., Ivison R. J., 2004, ApJ, 614, 671
- Coleman et al. (1980) Coleman G. D., Wu C.-C., Weedman D. W., 1980, ApJS, 43, 393
- Condon (1992) Condon J. J., 1992, ARA&A, 30, 575
- Coppin et al. (2006) Coppin K., et al., 2006, MNRAS, 372, 1621
- Daddi et al. (2008) Daddi E., Dannerbauer H., Elbaz D., Dickinson M., Morrison G., Stern D., Ravindranath S., 2008, ApJL, 673, L21
- Dale et al. (2005) Dale D. A., et al., 2005, ApJ, 633, 857
- Dale et al. (2001) Dale D. A., Helou G., Contursi A., Silbermann N. A., Kolhatkar S., 2001, ApJ, 549, 215
- Dey et al. (2008) Dey A., et al., 2008, ApJ, 677, 943
- Eales et al. (2000) Eales S., Lilly S., Webb T., Dunne L., Gear W., Clements D., Yun M., 2000, AJ, 120, 2244
- Elmegreen (1999) Elmegreen B. G., 1999, ApJ, 517, 103
- Greve et al. (2008) Greve T. R., Pope A., Scott D., Ivison R. J., Borys C., Conselice C. J., Bertoldi F., 2008, MNRAS, 389, 1489
- Hainline et al. (2009) Hainline L. J., et al., 2009, MNRAS in prep, 0, 0
- Helou et al. (1985) Helou G., Soifer B. T., Rowan-Robinson M., 1985, ApJL, 298, L7
- Hinshaw et al. (2009) Hinshaw G., et al., 2009, ApJS, 180, 225
- Huynh et al. (2007) Huynh M. T., Pope A., Frayer D. T., Scott D., 2007, ApJ, 659, 305
- Kovács et al. (2006) Kovács A., Chapman S. C., Dowell C. D., Blain A. W., Ivison R. J., Smail I., Phillips T. G., 2006, ApJ, 650, 592
- Levine et al. (1998) Levine D. A., et al., 1998, ApJ, 504, 64
- Miyazaki et al. (2002) Miyazaki S., et al., 2002, PASJ, 54, 833
- Muxlow et al. (2005) Muxlow T. W. B., et al., 2005, MNRAS, 358, 1159
- Papovich et al. (2005) Papovich C., Dickinson M., Giavalisco M., Conselice C. J., Ferguson H. C., 2005, ApJ, 631, 101
- Patanchon et al. (2009) Patanchon G., et al., 2009, ArXiv e-prints
- Pope et al. (2008) Pope A., Chary R.-R., Alexander D. M., Armus L., Dickinson M., Elbaz D., Frayer D., Scott D., Teplitz H., 2008, ApJ, 675, 1171
- Pope et al. (2006) Pope A., et al., 2006, MNRAS, 370, 1185
- Reddy et al. (2006) Reddy N. A., Steidel C. C., Erb D. K., Shapley A. E., Pettini M., 2006, ApJ, 653, 1004
- Rieke et al. (2009) Rieke G. H., Alonso-Herrero A., Weiner B. J., Perez-Gonzalez P. G., Blaylock M., Donley J. L., Marcillac D., . 2009, ApJ, 692, 556
- Sanders & Mirabel (1996) Sanders D. B., Mirabel I. F., 1996, ARA&A, 34, 749
- Shapley et al. (2005) Shapley A. E., Steidel C. C., Erb D. K., Reddy N. A., Adelberger K. L., Pettini M., Barmby P., Huang J., 2005, ApJ, 626, 698
- Smail et al. (2002) Smail I., Ivison R. J., Blain A. W., Kneib J.-P., 2002, MNRAS, 331, 495
- Tacconi et al. (2006) Tacconi L. J., et al., 2006, ApJ, 640, 228
- Thomasson (1986) Thomasson P., 1986, QJRAS, 27, 413
- Viero et al. (2009) Viero M. P., et al., 2009, ArXiv e-prints
- Yang et al. (2007) Yang M., Greve T. R., Dowell C. D., Borys C., 2007, ApJ, 660, 1198
- Younger et al. (2009) Younger J. D., et al., 2009, MNRAS, 394, 1685