Too large and overlooked? Extended free-free emission towards massive star formation regions
Abstract
We present Australia Telescope Compact Array observations towards 6 massive star formation regions which, from their strong 24 GHz continuum emission but no compact 8 GHz continuum emission, appeared good candidates for hyper-compact HII regions. However, the properties of the ionised gas derived from the 19 to 93 GHz continuum emission and H70 H57 radio recombination line data show the majority of these sources are, in fact, regions of spatially-extended, optically-thin free-free emission. These extended sources were missed in the previous 8 GHz observations due to a combination of spatial-filtering, poor surface brightness sensitivity and primary beam attenuation.
We consider the implications that a significant number of these extended HII regions may have been missed by previous surveys of massive star formation regions. If the original sample of 21 sources is representative of the population as a whole, the fact that 6 contain previously undetected extended free-free emission suggests a large number of regions have been mis-classified. Rather than being very young objects prior to UCHII region formation, they are, in fact, associated with extended HII regions and thus significantly older. In addition, inadvertently ignoring a potentially substantial flux contribution (up to 0.5Jy) from free-free emission has implications for dust masses derived from sub-mm flux densities. The large spatial scales probed by single-dish telescopes, which do not suffer from spatial filtering, are particularly susceptible and dust masses may be overestimated by up to a factor of 2.
keywords:
stars: early type, stars: formation, stars: evolution, ISM: evolution, (ISM:) HII regions, radio continuum: ISM, radio lines: ISM1 Introduction
A definition often used to describe a star as ‘massive’ requires it to have sufficient UV radiation to ionise the surrounding environment. The ionised material can then be observed as free-free continuum emission at radio wavelengths. When a massive star is forming, the emergence and subsequent expansion of detectable free-free emission from the natal cocoon, provides an indicator of the stars evolutionary state. As the ionising radiation overcomes quenching due to the large mass of infalling material, the continuum emission emerges. At first the ionised gas is extremely dense, but once the ionised gas pressure is sufficient to overcome the gravitational potential, the HII region expands into ultra compact (UC), compact and finally diffuse HII regions. The spectral energy distribution (SED) at cm wavelengths falls into two distinct regimes with increasing frequency. As the free-free emission turns from optically thick to thin, the spectral index (S, where Sν is the flux density at frequency ) changes from 2 to -0.1. The frequency at which the turnover occurs scales almost linearly with the electron density (Kurtz, 2005) i.e., denser and presumably younger objects will exhibit the turn over at higher frequencies. At shorter wavelengths the SED quickly becomes dominated by thermal emission from dust in the surrounding natal cocoon, which has a spectral index, .
To identify sources at the earliest stages of massive star formation we used the work of Walsh et al. (1998, hereafter WBHR98) to select objects in the relatively unexplored southern sky with: (i) SED’s peaking in the far-infrared, (ii) sufficient luminosity to expect stars massive enough to ionise the surrounding material, (iii) no detectable cm free-free emission and (iv) class II methanol maser emission (Longmore et al., 2007a, hereafter L07). Class II methanol masers are generally found offset from cm continuum emission but always coincident with sub-mm cores (e.g. Walsh et al., 2003) which have sufficient luminosity to contain massive stars (WBHR98). These highly luminous cores with no detected cm emission are interpreted as massive star forming cores prior to the onset of UCHII formation. Subsequent multi-wavelength studies have since derived the large-scale properties (mass, chemical composition, temperature etc.) of these star forming cores using the SEST, Mopra and ATCA telescopes (Hill et al., 2005; Purcell et al., 2006; Purcell et al., 2009; Longmore et al., 2007b, 2008) and performed a census of the (proto-) stellar populations at infrared wavelengths (Longmore et al., 2006, 2007).
In L07 we selected 21 regions for further study, all of which contained methanol maser emission detected by WBHR98. Six of these regions were reported as containing continuum emission by the simultaneously-observed 8 GHz observations of WHBR98, while the remaining 15 were reported as devoid of 8 GHz continuum emission by their 8 GHz observations. Using this selection criteria, we hoped to identify 15 young regions prior to UCHII formation and 6 older regions, post-UCHII formation. However, contrary to expectation, twelve rather than six of these regions were detected in the 24 GHz continuum by L07: the six detected in the 8 GHz continuum by WBHR98 and six reported as devoid of 8 GHz continuum by WBHR98.
In this work we are seeking to find the nature of the sources detected at 24 GHz by L07 but not at 8 GHz by WBHR98. If these cores are indeed at an earlier evolutionary stage as originally thought, this emission could be free-free emission in the optically-thick regime between 8 and 24 GHz. In this case their 24 GHz flux should be 10 times brighter than at 8 GHz and may explain the 8 GHz non-detections. However, both L07 and WBHR98 observations were made using an interferometer with significantly different array configurations and so probed the source structure at different spatial frequencies and with different surface brightness sensitivities. The other possibility discussed in L07 is that these sources could instead be much older, spatially extended, optically thin HII regions which were resolved out/not-detected due to the extended array configuration used by WBHR98. Kurtz et al. (1999) found just such extended continuum emission surrounding 12 out of 15 UCHII regions they observed, with important consequences for interpreting the nature of these regions. If such a result was found for many of the L07 sources, and these were representative of the WBHR98 sample as a whole, this would have ramifications regarding their currently assumed age and evolutionary state. Not only would this imply the sources are significantly older than originally thought, but it may also affect attempts to derive dust masses at shorter wavelengths ignoring the contribution from the extended free-free emission. In this paper we aim to uncover the nature of these sources through continuum and radio recombination line observations from 19 to 93GHz.
2 Observations and Data Reduction
| Region | IRAS | RA | DEC | VLSR | D |
|---|---|---|---|---|---|
| name | (J2000) | (J2000) | (km/s) | (kpc) | |
| G316.81-0.06 | 144165937 | 14:45:26.9 | -59:49:16 | -38.7 | 2.7 |
| G331.28-0.19 | 160765134 | 16:11:26.9 | -51:41:57 | -88.1 | 5.4 |
| G12.68-0.18 | 181171753 | 18:13:54.7 | -18:01:41 | 56.5 | 4.9 |
| G19.47+0.17 | 182321154 | 18:25:54.7 | -11:52:34 | 19.7 | 1.9 |
| G24.79+0.08 | 183350711 | 18:36:12.3 | -07:12:11 | 110.5 | 7.7 |
| G24.85+0.09 | 183350711 | 18:36:18.4 | -07:08:52 | 108.9 | 6.3 |
The sources were selected from L07 as those with 24 GHz continuum detections but no corresponding 8 GHz detections reported in WBHR98. Table 1 lists the pointing centres from the methanol maser position, VLSR and kinematic distances (from Purcell et al., 2006) for each of the regions.
2.1 ATCA continuum and radio recombination line (RRL) data
The Australia Telescope Compact Array (ATCA) observations were undertaken between 2006 and 2008 as part of ATCA projects C1287 and C1751. The observing setups (array and correlator settings, approximate sensitivities and beam sizes, continuum frequencies and RRL transitions) are listed in Table 2. In order to mitigate problems constructing SEDs of extended sources with different beam sizes, three array configurations were used (H75, H168 and H214, with maximum baselines of 75m, 168m and 214m, respectively) in an attempt to match the beams at the different observing frequencies. These configurations contain both north-south plus east-west baselines to allow for snapshot imaging. Each source was observed in multiple 15 minute cuts, with a close phase calibrator observed for 3 minutes before and after each cut. PKS 1253-055 and PKS 1921-293 were used as the bandpass calibrators. The ATCA standard PKS 1934-634 was used as the primary calibrator for observations below 30 GHz and Uranus was used at higher frequencies. The data were reduced in the standard way using the MIRIAD (Sault et al., 1995) package. Bad visibilities were flagged and the gains/bandpass solutions from the appropriate calibrator were applied to the visibilities. A zeroeth order polynomial was fit to the line-free channels and subtracted from the visibilities to separate the line and continuum emission. These separate visibilities were then Fourier transformed to form image cubes. Due to variation in system temperatures between the antennae, individual visibilities were weighted by their system temperature. The images were cleaned and convolved with a Gaussian synthesised beam to produce a final restored image.
Continuum fluxes were extracted using imfit on the restored images. Extended sources were fit with a 2D Gaussian profile to calculate the spatial extent, integrated and peak fluxes densities. Unresolved emission was fit as a point source. The positions, peak flux and deconvolved sizes of the continuum emission from these fits at each frequency and array configuration are shown in Table 3. Where detected, RRL spectra were extracted for each source at the peak of the continuum emission, baseline subtracted and fit with a Gaussian profile using the gauss method in CLASS111http://www.iram.fr/GILDAS. Table 4 lists the velocity-integrated flux, VLSR, FWHM, peak flux and their corresponding uncertainties for each of the detected transitions and array configurations.
| Trans. | Rest Freq. | BW | Num. | V | Array | Line RMS | Cont. RMS | Beam |
| (GHz) | (MHz) | Chan | (kms-1) | Config | (mJy/beam/chan) | (mJy/beam) | () | |
| H70 | 18.769 | 16 | 512 | 0.50 | H168 | 7 | 0.3 | 14 |
| H57 | 34.596 | 32 | 256 | 1.08 | H75 | 6 | 0.4 | 18 |
| H168 | 6 | 0.4 | 8 | |||||
| H41 | 92.034 | 32 | 256 | 0.41 | H75 | 56 | 4 | 7 |
| cont. | 93.5 | 128 | 32 | 26 | H214 | - | 2 | 3 |
| Source | Freq | Array | RA | DEC | Beam | Peak Fluxa | PA | ||
|---|---|---|---|---|---|---|---|---|---|
| (GHz) | (J2000) | (J2000) | () | (mJy/beamb) | () | () | (∘) | ||
| G316.81-0.06 Core 1 | 92.0 | H75 | 14:45:29.26 | -59:49:09.1 | 2.61.4 | (99)4319c | 10 | 5 | 5 |
| G316.81-0.06 Core 2a | 18.7 | H168 | 14:45:25.59 | -59:49:12.7 | 13.19.7 | (456)28477 | 11 | 6 | -3 |
| 24.0 | H168 | 14:45:25.68 | -59:49:15.2 | 10.29.3 | 43564 | - | - | - | |
| 34.6 | H75 | 14:45:25.45 | -59:49:10.6 | 16.313.0 | (766)422337 | 14 | 11 | 16 | |
| 34.6 | H168 | 14:45:25.91 | -59:49:15.4 | 7.85.9 | (168)7227 | 10 | 5 | 5 | |
| 92.0 | H75 | 14:45:26.26 | -59:49:16.9 | 7.36.0 | (135)5716 | 10 | 5 | -29 | |
| G316.81-0.06 Core 2b | 18.7 | H168 | 14:45:25.48 | -59:49:27.4 | 13.19.7 | (598)33477 | 11 | 8 | -4 |
| 24.0 | H168 | 14:45:26.04 | -59:49:24.4 | 10.29.3 | 49665 | - | - | - | |
| 34.6 | H75 | 14:45:25.68 | -59:49:25.7 | 16.313.0 | (829)490441 | 13 | 10 | 46 | |
| 34.6 | H168 | 14:45:25.75 | -59:49:27.8 | 7.85.9 | (177)6714 | 13 | 3 | 1 | |
| 92.0 | H75 | 14:45:25.70 | -59:49:26.7 | 7.36.0 | (36)3023 | 9 | 6 | 9 | |
| G316.81-0.06 Core 3a | 18.7 | H168 | 14:45:22.40 | -59:49:35.8 | 13.19.7 | (490)45199 | - | - | - |
| 24.0 | H168 | 14:45:21.98 | -59:49:41.5 | 10.29.3 | (1199)43259 | 14 | 12 | -17 | |
| 34.6 | H75 | 14:45:22.02 | -59:49:35.0 | 16.313.0 | (480)216371 | 27 | 6 | 80 | |
| 34.6 | H168 | 14:45:22.61 | -59:49:37.1 | 7.85.9 | (459)12177 | 12 | 11 | -61 | |
| G316.81-0.06 Core 3b | 18.7 | H168 | 14:45:20.86 | -59:49:27.4 | 13.19.7 | (901)29742 | 17 | 15 | -20 |
| 24.0 | H168 | 14:45:20.58 | -59:49:28.4 | 10.29.3 | (644)40575 | 11 | 6 | 2.1 | |
| 34.6 | H75 | 14:45:21.57 | -59:49:26.7 | 16.313.0 | (248)122279 | 22 | 7 | -35 | |
| 34.6 | H168 | 14:45:21.40 | -59:49:29.7 | 7.85.9 | (32)2212 | 6 | 1 | -7 | |
| G331.28-0.19 Core 1 | 18.7 | H168 | 16:11:27.36 | -51:41:59.7 | 13.29.5 | (296)863 | 25 | 12 | 84 |
| 24.0 | H168 | 16:11:27.6 | -51:41:59.68 | 13.078.9 | (280)8010 | 23 | 17 | 79 | |
| 34.6 | H75 | 16:11:27.30 | -51:41:59.4 | 18.611.9 | (299)1464 | 20 | 11 | 67 | |
| 34.6 | H168 | 16:11:27.47 | -51:41:59.2 | 9.25.6 | (265)442 | 25 | 10 | 90 | |
| 92.0 | H75 | 16:11:26.63 | -51:41:56.6 | 6.54.9 | 7323 | - | - | - | |
| 93.5 | H214 | 16:11:26.57 | -51:41:57.2 | 2.61.5 | (29)111 | 3 | 2 | -28 | |
| G12.68-0.18 Core 3 | 18.7 | H168 | 18:13:55.40 | -18:01:38.4 | 14.08.7 | (274)743 | 8 | 17 | 18 |
| 24.0 | H168 | 18:13:55.30 | -18:01:36.2 | 12.08.2 | 14010 | 13 | 9 | 27 | |
| 34.6 | H75 | 18:13:55.30 | -18:01:37.1 | 20.912.3 | 423 | - | - | - | |
| 34.6 | H168 | 18:13:55.29 | -18:01:35.8 | 8.15.2 | (79)273 | 14 | 6 | 50 | |
| 92.0 | H75 | 18:13:54.73 | -18:01:38.7 | 6.84.8 | 379 | - | - | - | |
| G12.68-0.18 Core 4 | 92.0 | H75 | 18:13:54.56 | -18:01:44.9 | 6.84.8 | 3210 | - | - | - |
| 93.5 | H214 | 18:13:54.74 | -18:01:46.3 | 3.01.4 | 263 | - | - | - | |
| G19.47+0.17 Core 1 | 92.0 | H75 | 18:25:54.75 | -11:52:34.2 | 7.05.0 | (92)589 | 5 | 4 | 71 |
| 93.5 | H214 | 18:25:54.72 | -11:52:34.0 | 3.11.5 | 332 | - | - | - | |
| G19.47+0.17 Core 2 | 18.7 | H168 | 18:25:54.34 | -11:52:22.3 | 14.19.1 | 343 | - | - | - |
| 34.6 | H75 | 18:25:54.39 | -11:52:22.8 | 19.412.4 | 313 | - | - | - | |
| 34.6 | H168 | 18:25:54.30 | -11:52:21.7 | 9.75.2 | 263 | - | - | - | |
| 92.0 | H75 | 18:25:54.35 | -11:52:21.0 | 7.05.0 | 2613 | - | - | - | |
| G24.79+0.08 Core 1 | 18.7 | H168 | 18:36:12.58 | -7:12:12.0 | 14.79.0 | 7712 | - | - | - |
| 34.6 | H75 | 18:36:12.54 | -7:12:11.7 | 19.412.2 | 1188 | - | - | - | |
| 34.6 | H168 | 18:36:12.52 | -7:12:12.0 | 10.25.1 | 1045 | - | - | - | |
| 92.0 | H75 | 18:36:12.60 | -7:12:10.4 | 7.24.5 | (244)17124 | 4 | 1 | 8 | |
| 93.5 | H214 | 18:36:12.56 | -7:12:11.0 | 3.61.3 | 1336 | - | - | - | |
| G24.79+0.08 Core 3 | 18.7 | H168 | 18:36:10.45 | -7:11:21.1 | 14.79.0 | 15411 | - | - | - |
| 34.6 | H75 | 18:36:10.53 | -7:11:26.9 | 19.412.2 | 6511 | - | - | - | |
| 34.6 | H168 | 18:36:10.66 | -7:11:21.5 | 10.25.1 | (104)256 | 15 | 9 | 17 | |
| G24.85+0.09 Core 1 | 18.7 | H168 | 18:36:18.51 | -7:08:54.0 | 15.09.0 | 696 | - | - | - |
| 34.6 | H75 | 18:36:18.57 | -7:08:54.7 | 19.013.1 | (116)535 | 29 | 19 | 74 | |
| 34.6 | H168 | 18:36:18.21 | -7:08:51.9 | 10.45.0 | (62)242 | 11 | 5 | 40 |
| Source | Trans. | Array | Fluxa | VLSR | FWHM | Peak | Line/cont. |
|---|---|---|---|---|---|---|---|
| (mJy/beam.km/s) | (km/s) | (km/s) | (mJy/beam) | ratio | |||
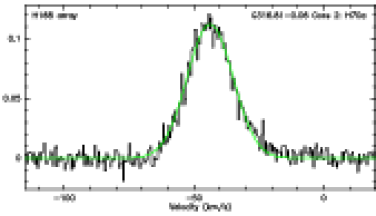
| G316.81-0.06 Core 2 | H57 | H75 | 761054 | -43.00.08 | 23.70.20 | 300 | 0.5 |
| H57 | H168 | 166054 | -46.50.34 | 20.80.84 | 72 | 0.5 | |
| H70 | H168 | 248326 | -43.80.11 | 20.80.26 | 110 | 0.3 | |
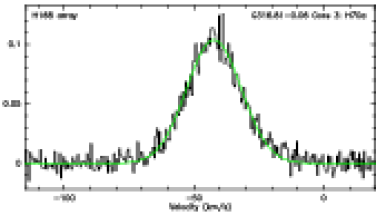
| G316.81-0.06 Core 3 | H57 | H75 | 369562 | -43.20.20 | 24.10.49 | 140 | 0.5 |
| H57 | H168 | 163048 | -45.50.28 | 19.40.68 | 79 | 0.5 | |
| H70 | H168 | 273732 | -42.30.14 | 24.80.35 | 100 | 0.2 | |
| G331.28-0.19 Core 1 | H57 | H75 | 136319 | -76.60.12 | 17.90.28 | 71 | 0.5 |
| H70 | H168 | 42920 | -78.60.48 | 21.81.2 | 18 | 0.3 | |
| G12.68-0.18 Core 3 | H57 | H75 | 45023 | 57.50.85 | 33.82.0 | 13 | 0.4 |
| H57 | H168 | 27322 | 55.80.98 | 22.72.0 | 11 | 0.5 | |
| H70 | H168 | 78064 | 54.71.3 | 34.33.6 | 21 | 0.3 | |
| G19.47+0.17 Core 2 | H57 | H75 | 42953 | 16.41.2 | 20.93.2 | 19 | 0.6 |
| H70 | H168 | 21037 | 12.71.4 | 15.43.0 | 13 | 0.2 | |
| G24.79+0.08 Core 1 | H57 | H75 | 123580 | 113.70.80 | 26.22.1 | 44 | 0.4 |
| H57 | H168 | 73571 | 112.81.3 | 27.23.2 | 25 | 0.4 | |
| G24.79+0.08 Core 3 | H57 | H75 | 80062 | 109.90.58 | 16.41.6 | 46 | 0.6 |
| H70 | H168 | 56930 | 112.40.45 | 17.31.1 | 31 | 0.2 | |
| G24.85+0.09 Core 1 | H57 | H75 | 56060 | 111.91.2 | 24.13.2 | 22 | 0.4 |
3 Results
3.1 to 3.6 report the 19 to 93 GHz continuum and RRL detections towards each of the individual regions. These are compared to both the L07 24 GHz observations and original 8 GHz WBHR98 data to try and uncover the nature of the continuum sources detected by L07 but not WBHR98. We focus on analysis of the continuum rather than the RRL data, which will appear in a subsequent paper. In this work we simply refer to the RRL detections as further evidence that the continuum arises from free-free emission.
3.1 G316.81-0.06
3.1.1 Previous observations
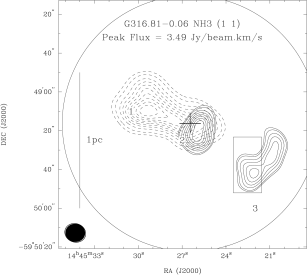
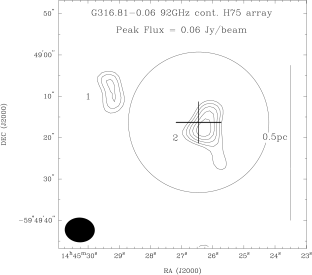
As shown in Figure 1 (top-left), L07 detected three sources in the region: two 24 GHz continuum sources (core 2 at the methanol maser position, and core 3 offset 30 south-west from the maser) and an ammonia filament extending east from core 2 and the methanol maser position. Despite the strong (0.5 Jy) continuum towards core 2 at 24 GHz, WBHR98 only reported a single 8 GHz detection towards this region at the position of core 3. To investigate this apparent discrepancy between the L07 and WBHR98 observations, we first re-examined the WBHR98 8 GHz data. With poor uv-coverage, phase stability and strong sidelobe emission, the image fidelity was not sufficient to rule out an 8 GHz detection at the position of core 2. However, the simultaneously observed WBHR98 6.7 GHz continuum images have much better image fidelity and show a non-detection to 5 mJy at the position of core 2 and a 40 mJy detection at core 3 with a similar morphology to the 24 GHz detection. The apparent discrepancy in the measured flux density of core 2 between the lower-frequency, very extended array observations of WBHR98 and the higher-frequency, compact observations of L07 therefore appears to be related to the nature of the source emission. Based on the new observations, we investigate the nature of core 2 below.
3.1.2 G316.81-0.06: Core 2
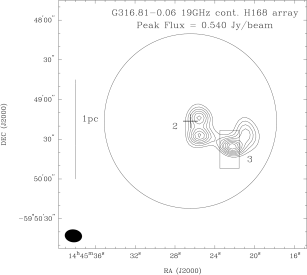
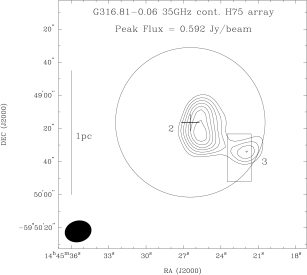
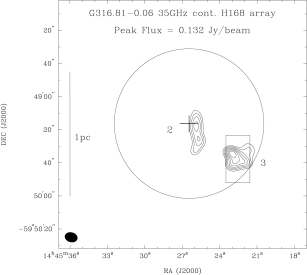
As shown in Figure 1, we confirm the strong 24 GHz continuum L07 detection of G316.81-0.06 core 2. At higher resolution the cm-continuum emission is resolved into two components separated by 10 north-south. At 93 GHz we find unresolved continuum emission at the centre of the two cm-continuum components.
It is clear from the 19, 24 and 35 GHz continuum images (Figure 1) and flux densities (Table 3), that the bulk of the emission in core 2 is spatially extended. Although the more extended H168 array configuration 35 GHz observations resolve the north-south elongation into at least two components, these only make up a small fraction of the flux compared to that measured at the same frequency in the more compact H75 array configuration.
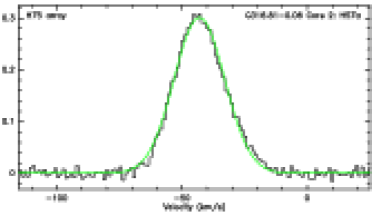
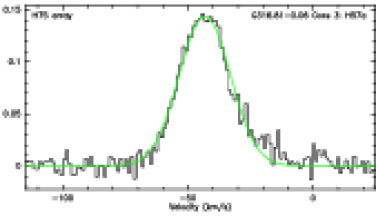
Strong emission from both H70 and H57 are detected towards core 2 in all the array configurations (Figure 2). Similar to the cm-continuum emission, the peak flux density of the H57 RRL in the more extended array configuration only recovers a small fraction of the flux density in the more compact configuration.
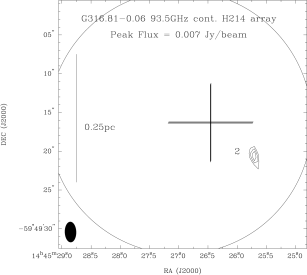
To correct for this spatial filtering when creating an SED it is therefore necessary to sample the source emission at the same spatial frequencies. Figure 13 shows the SED for core 2 sampled between spatial frequencies of 510 k, the mutually overlapping range between all the 18.9 to 35 GHz observations. This shows that on spatial scales of 25-50, the spectral index is almost flat – consistent with optically-thin free-free emission. It is not possible to unambiguously compare this spectral index with the flux from the 92 & 93 GHz observations due to the smaller primary beam, much higher spatial frequencies and the potential contribution from thermal dust emission. However, the similarity between the 92 GHz H75 array configuration observations and the lower frequency emission suggests at least some of the 92 GHz emission may be due to free-free emission.
The 93 GHz observations using the more extended H214 array configuration show a very different structure, with only a single, weak, unresolved detection directly in the middle of the two compact lower frequency knots. This source is also coincident with an N2H+ core (Longmore et al. in prep) tracing dense molecular gas, so we postulate this 93GHz emission is likely to be from thermal dust. Although the emission from this source is probably distinct from that of core 2 at lower frequencies, they are spatially associated within the beam of the lower resolution data, and as such are both labelled as ‘core 2’.
Finally, there is also a strong 93 GHz continuum source at the position of the ammonia peak, core 1. The spectral index inferred from the upper limits of the lower frequency data at this position means this is also likely to be thermal dust emission. As this source is substantially outside of the primary beam, the flux measurement reported in Table 3 is highly uncertain.
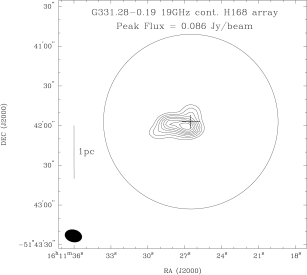
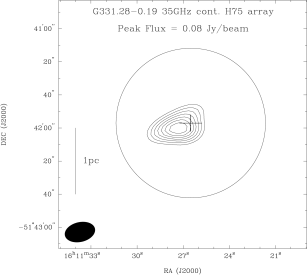
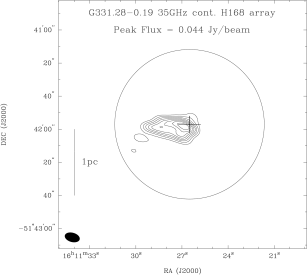
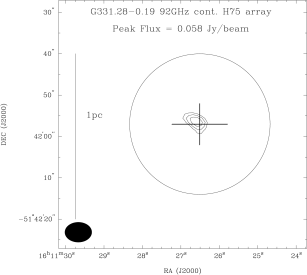
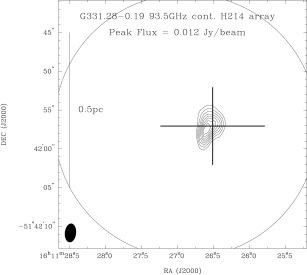
3.2 G331.28-0.19
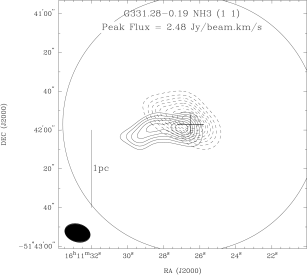
Figure 3 shows images of the continuum emission detected towards the region. The morphology of the 19 and 35 GHz continuum emission is very similar to that observed at 24 GHz by L07: a single source is seen peaking close to the methanol maser position with an extended tail towards the east. This continuum emission is offset to the south east from an L07 ammonia core which is extended north-east to south-west.
WBHR98 reported no 8 GHz continuum source in the region. Re-examination of the WBHR98 8 GHz data shows a potential source of 4mJy at this position with a similar morphology. However, due to poor weather, only 22 minute cuts were observed in the WBHR98 observations so the image fidelity is poor and the emission brightness lay below their detection criteria. However, Phillips et al. (1998) report weak (3.5 mJy) continuum emission at 8 GHz, extended east-west, with a similar morphology to that in Figure 3.
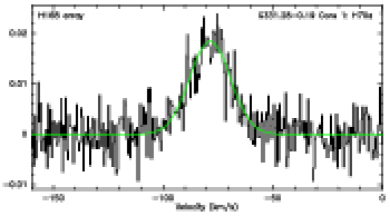
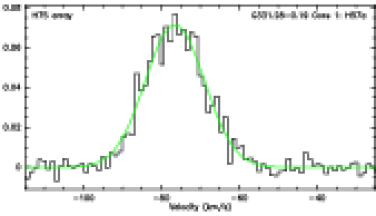
The H70 and H57 RRL emission detected towards the continuum (Figure 4) and spectral index of 0.07 derived from the SED (Figure 13) confirms the continuum between 19 and 35 GHz as free-free emission.
A compact continuum source is also detected at 92 and 93 GHz. This is offset from the peak of the lower frequency emission and is instead associated with the methanol maser emission, the peak of the L07 NH3(1,1) ammonia emission and the unresolved NH3(4,4) and (5,5) emission. Due to a combination of the lower sensitivity to extended emission of these observations and the lower optical depth of free-free emission at higher frequencies, the 92 & 93 GHz emission could be from the densest and brightest free-free component inside the larger region traced by the lower frequency emission. However, given the similar synthesised beam sizes of the 35 GHz H168 and 92 GHz H75 observations, it is difficult to understand the offset in the peak of the emission. We favour an alternative explanation in which the 92 & 93 GHz emission is dominated by thermal dust emission rather than free-free emission.
In summary, G331.28-0.19 core 1 appears to be an optically thin HII region. The 92 GHz emission and the ammonia emission are likely tracing a hot molecular core located at the edge of the HII region, similar to the case of G29.96-0.02 (Cesaroni et al., 1998). The 8 GHz non-detection by WBHR98 can be attributed to their poorer sensitivity for this source compared to the rest of their sample.
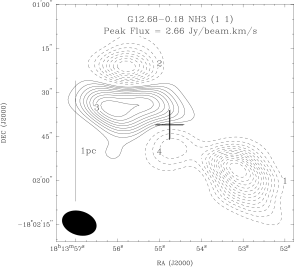
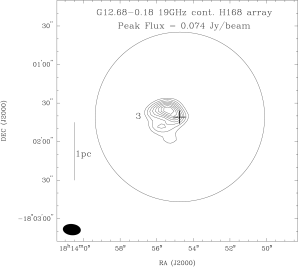
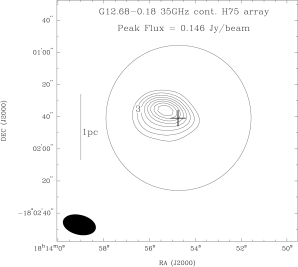
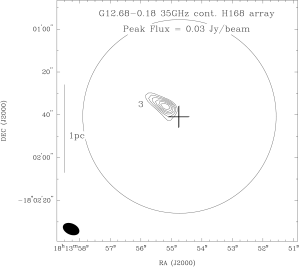
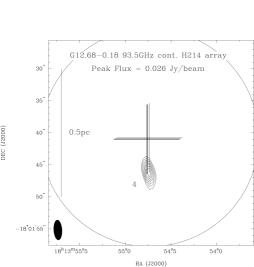
3.3 G12.68-0.18
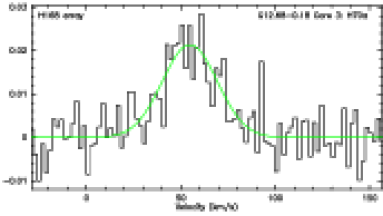
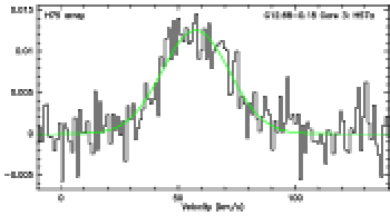
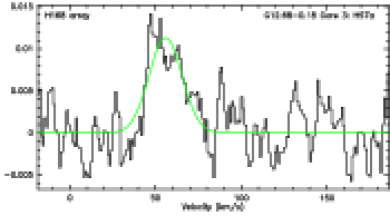
Figure 5 shows images of the continuum emission detected towards the region. The morphology of the 19 and 35 GHz continuum emission is similar to that observed at 24 GHz by L07: a single extended source is seen 10 north-east of the methanol maser emission and offset from the ammonia cores in the region. Figure 6 shows the H57 and H70 RRL spectra detected towards the peak of the continuum emission, confirming this arises from ionised gas. Figure 13 shows the SED for this source. Although the quality of the fit is not particularly good, the spectral index of is clearly inconsistent with optically thick free-free or dust emission. The extremely negative spectral index is biased by the low flux density of the 35 GHz H168 data point, which is probably due to missing flux. Removing this point before fitting results in a spectral index of .
Re-inspection of the WBHR98 data shows this source is 10 from the WBHR98 pointing centre, significantly outside their half-power beamwidth of 5.7. Any emission would therefore have suffered from primary beam attenuation in their observations.
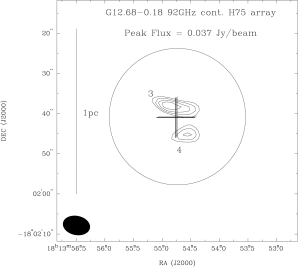
Figure 5 also shows a second, unresolved source detected at 93 GHz, 5 south of the maser position, coincident with the unresolved (5,5) core reported in L07 (core 4). The non-detection at frequencies 93 GHz makes it likely that the emission mechanism for this source is from dust rather than thermal free-free emission.
In summary, G12.68-0.18 core 3 is an extended region of optically-thin ionised gas that was not detected by WBHR98 as it lies far outside their primary beam.
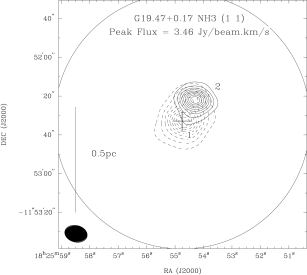
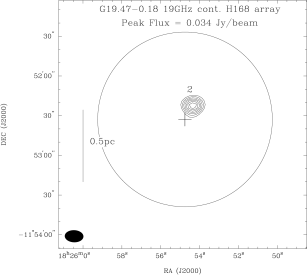
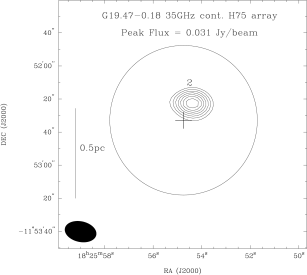
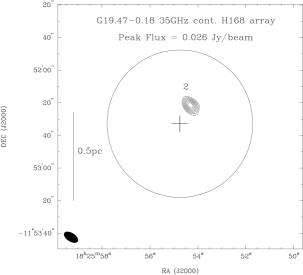
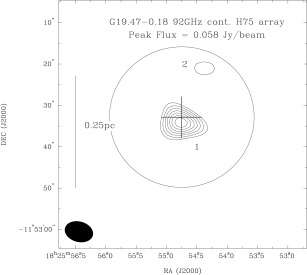
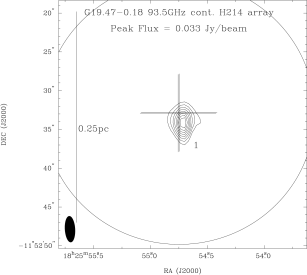
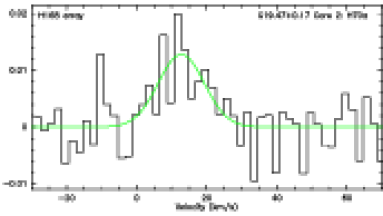
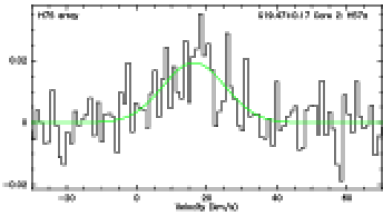
3.4 G19.47+0.17
Figure 7 shows images of the continuum emission detected towards the region. The morphology of the 19 and 35 GHz continuum emission is similar to that observed at 24 GHz by L07: an unresolved continuum source, labelled core 2, lies 15 north-west of the methanol maser position. H57 and H70 RRL emission is detected towards the peak of the continuum emission (Figure 8), confirming the emission arises from ionised gas. The spectral index (Figure 13) is consistent with optically-thin free-free emission.
No 8 GHz continuum emission was reported at this location by WBHR98. Re-examination of the WBHR98 data shows this region lies outside the primary beam so the continuum sensitivity would have suffered significantly from primary beam attenuation.
A second, weaker source is seen only at 92 and 93 GHz within a few arc-seconds of the methanol maser position and unresolved emission, designated core 1 in L07. At 35 GHz the 3 upper limit is 7 mJy. This implies a spectral index between 35 and 92 GHz of , which rules out either optically-thick or thin bremsstrahlung emission. We conclude that the core 1 emission is most likely from warm dust.
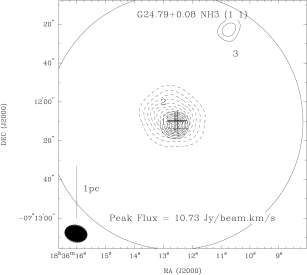
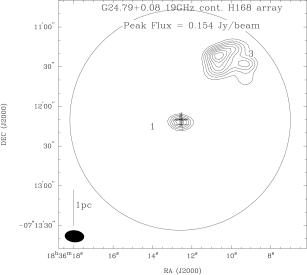
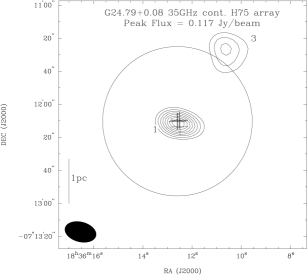
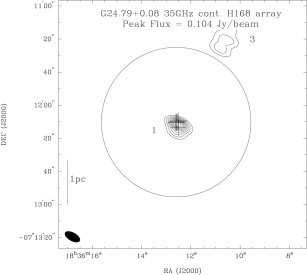
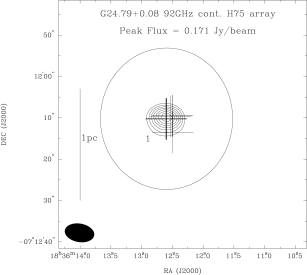
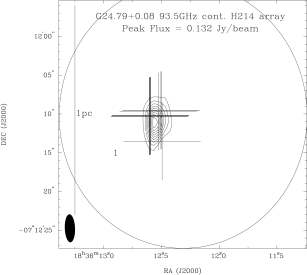
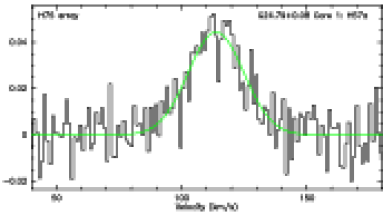
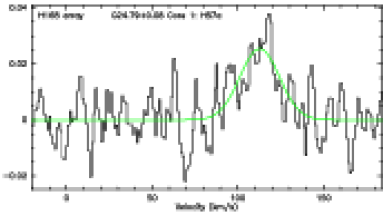
3.5 G24.79+0.08
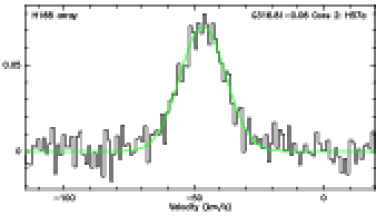
Figure 9 shows images of the continuum emission detected towards the region. The morphology at 19 and 35 GHz is very similar to that observed at 24 GHz by L07: an unresolved source at the methanol maser position (core 1) and a slightly extended source at the edge of the primary beam (core 3). Although, core 3 was not detected at 92 & 93 GHz, it lies outside the primary beam at 24 GHz making both detection more difficult and the flux determination more uncertain. Figure 10, shows H57 and H70 RRL emission is detected at the peak of the continuum emission towards core 3 and H57 is detected towards core 1, confirming both these sources contain ionised gas.
WBHR98 reported a 1 non-detection to 3mJy at both 24 GHz continuum positions. However, Forster & Caswell (2000) reported two 8.6 GHz continuum sources in the proximity of the methanol maser emission, with flux densities of 36 and 51 mJy. Re-examining the calibrated WBHR98 data shows residual phase errors in the data for this region. The image shows 8 GHz continuum emission in the region but its location is unclear, resulting in the reported non-detection.
Core 1 is well known in the literature as a hyper-compact HII region (e.g. Beltrán et al., 2007). Figure 13 shows the SED at the frequencies observed in this work which are consistent with the source transitioning between optically-thick and thin free-free emission. The single-component spectral index attributed to this source in Figure 13 is therefore not a good representative of the true SED.
In summary, these observations confirm both the L07 24 GHz continuum detections and show core 3 is an extended region of optically-thin ionised gas which was missed by WBHR98. Core 1 is a well known optically-thick, hyper-compact HII region which was missed by WBHR98 due a combination of the steeply rising flux density between 8 and 24 GHz and calibration problems.
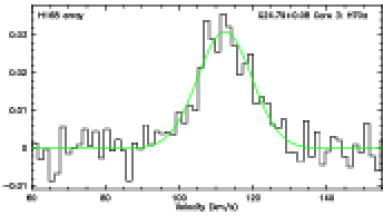
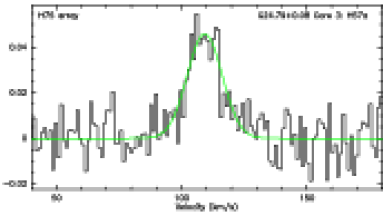
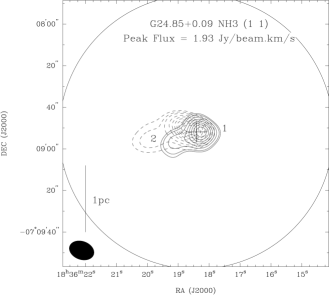
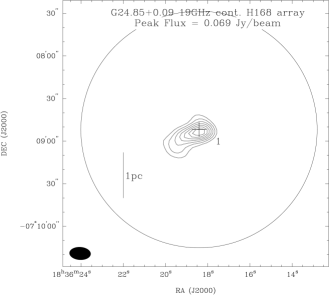
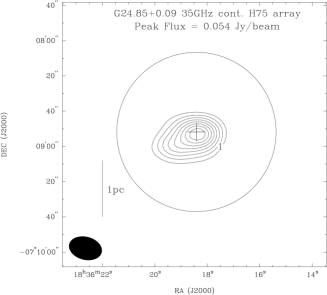
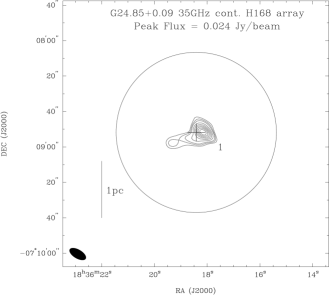
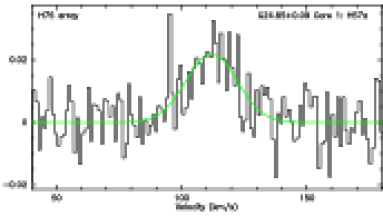
3.6 G24.85+0.09
Figure 11 shows images of the continuum emission detected towards the region. The morphology at 19 and 35 GHz is similar to that observed at 24 GHz by L07: a compact source is seen peaking 5 west of the methanol maser position, with a fainter tail extending towards the south-east. No emission was detected at 92 or 93 GHz. The detection of H57 (Figure 12) confirms the presence of free-free emission towards the source. Figure 13 shows the SED. The spectral index of 0.4 determined from the fit is not very robust due to the flux uncertainties and the narrow range of detected frequencies. Nevertheless, the spectral index is sufficient to rule out dust as the primary contributor to the emission. The spectral index of 0.4 is intermediate between the canonical values of 2 and 0.1, suggesting that the sampled frequencies are near the turn over region. Re-examination of the WBHR98 data shows a 3 non-detection to 6mJy at 8 GHz. Extrapolating the WBHR98 upper limit assuming a spectral index of 2 results in a 19 GHz flux density well below the measured value (see Figure 13). From this, and the extended source size we assume the emission is optically thin.
| Region | Core | Nature of emission | Freq. |
|---|---|---|---|
| G316.81-0.06 | 2 | optically thin free-free | 24 GHz |
| G331.28-0.19 | 1 | optically thin free-free | 24 GHz |
| G12.68-0.18 | 3 | optically thin free-free | 24 GHz |
| G12.68-0.18 | 4 | dust | 92 GHz |
| G19.47+0.17 | 1 | dust | 92 GHz |
| G19.47+0.17 | 2 | optically thin free-free | 24 GHz |
| G24.79+0.08 | 1 | optically thick free-free | 24 GHz |
| G24.85+0.09 | 1 | optically thin free-free | 24 GHz |
3.7 Spectral Energy Distributions
Figure 13 shows the SEDs towards each of the cores detected at 24 GHz by L07 and not at 8 GHz by WBHR98. Our aim was to distinguish between the different expected emission mechanisms: optically-thin/thick thermal free-free emission (0.1 or 2, respectively. Given the different range of spatial frequencies probed between the different observations, the observations at 90 GHz were re-imaged selecting only visibilities in the mutually overlapping spatial frequency range. In practice this meant dropping the longest baselines at higher frequency, thus biasing the SED towards the large scale structure. As a result it was not possible to resolve G316.81-0.06 Core 2 into the two separate components, and only a composite SED is given. After re-imaging and re-fitting the emission to determine the flux density (as outlined in 2), the spectral index was calculated using a weighted, linear least-squares fit. Uncertainties in the individual flux density measurements were calculated by adding in quadrature the formal error of the fit to the emission and the estimated uncertainty in absolute flux (see 2). The absolute flux uncertainty was dominant in nearly all cases. As there were no overlapping spatial frequencies between the higher resolution observations at 92/93.5 GHz and the remaining data, it was not possible to re-image these data in the same way. As a result, the 92/93.5 GHz observations miss much of the flux seen towards extended sources at lower frequencies, potentially biasing the spectral index. The uncertainty to the spectral index is provided in each of the figures.
Table 5 shows the conclusions as to the nature of the 24 GHz continuum emission in L07 based on the SED fitting. Despite the sometimes large uncertainty in spectral index, the SEDs are sufficient to rule out an optically-thick component as the dominant emission mechanism at this spatial scale in G316.810.02 core 2, G331.280.19 core 1, G12.680.18 core 3 and G19.47+0.17 core 2. This does not preclude the existence of compact ionised gas components at smaller spatial scales (indeed, density gradients may well exist), only that at this position and spatial scale diffuse, optically thin ionised gas is dominant.
So how do these SEDs compare to the WBHR98 data? Where applicable, the WBHR98 8 GHz upper limits are shown as arrows in Figure 13. Given the sometimes several orders of magnitude discrepancy between the expected 8 GHz flux extrapolated from the SEDs, the non-detections seem initially inconsistent. One potential explanation may be that the emission is optically-thick between 8 and 19 GHz, and as a result drops below the WBHR98 detection limit. To test this we have extrapolated the expected SED between 8 and 19 GHz assuming the emission is optically thick and just falls below the WBHR98 detection limit (dashed line in Figure 13). While this may be a viable explanation for G24.79+0.08 core 1 and possibly G24.85+0.09, it clearly fails for the remaining sources. We conclude the only other viable explanation is that WBHR98 observations must have missed the spatially extended optically-thin emission through either spatial filtering, reduced surface brightness sensitivity or a combination of the two.
4 Discussion: the “missing” cm-continuum sources
Observations of cm-continuum emission towards regions of massive star formation provide a powerful indicator of the region’s age. Simplistically, detection of relatively weak (1-5 mJy) emission from shock-ionised gas signals the existence of a powering source (that may be driving a thermal jet for example), while stronger emission from photo-ionised gas signals a young massive stellar object has evolved sufficiently to have begun ionising its surrounding environment. Conversely, lack of bright cm-continuum emission is often used to infer the region is at an evolutionary stage prior to the development of an UCHII region. As such, previous large, high-resolution, cm-continuum surveys have proven invaluable in helping to assess the relative ages of many massive star formation regions. However, from our original sample of 21 massive star formation regions, selected from such a survey to contain no cm-continuum emission, we have confirmed that 6 of these are in fact associated with cm-continuum emission. In 4.1 we summarise the reasons for these discrepancies for the sources we have studied in this work and in 4.2 discuss the implications this has on the implied evolutionary stage of the objects. We then assess how these results may affect the interpretation of the whole WBHR98 sample.
4.1 Reasons for the “missing’ cm-continuum sources
We find three reasons why the cm-continuum sources in this work were not detected at 8 GHz by WBHR98. These can be separated by the nature of the source emission and the sensitivity limit of the survey as follows:
-
1.
the free-free emission is dominated by compact components, is optically-thick at 8 GHz and lies below the WBHR98 detection limit (i.e. G24.79+0.08 core 1)
-
2.
the emission is significantly above the WBHR98 detection limit but much more spatially extended than the WBHR98 beam (i.e. G316.81-0.06, G331.28-0.19 and G24.85+0.09)
-
3.
the emission lies well outside the primary beam of WBHR98 (i.e. G12.68-0.18 and G19.47+0.17)
In each of the three cases, the reason for the non-detection at 8 GHz is straightforward: (i) is due to the sensitivity limits of WBHR98; (ii) is due to the WBHR98 observations resolving-out extended emission, and, (iii) is due to the significantly reduced sensitivity of the observations outside of the primary beam.
4.2 Implications
4.2.1 Methanol masers and an evolutionary sequence
Based on the WBHR98 data, 15 of the 21 regions in the initial L07 survey were selected as being methanol maser sites devoid of 8 GHz continuum emission and were thus assumed to be in an evolutionary stage prior to UCHII region formation. The results from this work show that in fact only 9 of the original 21 regions contain no free-free emission and the remaining 12 are either at the HCHII region stage [case (i)] or in fact substantially older [cases (ii or iii)].
WBHR98 found 80% of their methanol maser sites were not associated with radio continuum emission and suggested methanol masers may form before an UCHII region develops. While this work does not contradict the conclusions of WBHR98 - methanol masers do trace very early stages of massive star formation - our results suggest a substantially larger fraction of methanol masers than determined by WBHR98 are associated with more evolved stages, UCHII regions and later. However, it is not possible to rule out methanol masers as signposts of the pre-HII phase. Given the clustered mode of massive star formation, these youngest sources may simply be coincident with more evolved massive young stellar objects.
Our findings support the idea that methanol masers commonly occur in both a very early phase before a detectable UCHII region develops (this may include the hypercompact HII region phase), and after the formation of a UCHII region where the ionised gas is expanding and becomes extended enough that it may be missed by extended interferometer configurations, such as that used by WBHR98, due to spatial filtering/poor surface brightness sensitivity.
In order to fully understand the relative occurrence of methanol maser sites in these three stages, we suggest a radio continuum survey that is sensitive to more extended radio continuum emission be undertaken. Such a survey should observe a large number of methanol maser sites without associated radio continuum emission, as identified by WBHR98.
4.2.2 Dust masses derived from sub-mm flux densities
Inadvertently ignoring a potentially substantial flux contribution (up to 0.5 Jy) from free-free emission has implications for deriving dust masses from sub-mm flux densities. Given the sharply rising flux density of dust with frequency this overestimate will be most pronounced at lower frequencies. Comparison with sub-mm flux densities towards massive star formation regions (e.g. Hill et al., 2005), shows that in the worse case scenario, missing a 0.5 Jy contribution from free-free emission will result in an over-estimate of dust mass by a factor of 2.
5 Conclusions
We have presented 19 to 93 GHz continuum and H70 H57 radio recombination line observations with the Australia Telescope Compact Array towards 6 hot molecular cores (HMCs) associated with methanol maser emission. We confirm the results of Longmore et al. (2007a) that previous continuum surveys have missed several, sometimes bright (0.5Jy) cm-continuum sources. If the original Longmore et al. (2007a) sample of 21 massive star formation regions are representative of the population as a whole, the evolutionary stage of a large number of regions have been mis-classified. Rather than being very young objects prior to UCHII region formation, they are, in fact, associated with free-free emission and thus significantly older.
In addition, inadvertently ignoring a potentially substantial flux contribution (up to 0.5 Jy) from free-free emission has implications for dust masses derived from sub-mm flux densities, particularly the larger spatial scales probed by single-dish telescopes. Dust masses may be overestimated by a factor of 2.
We note that cm-continuum data from observations simultaneously studying masers are particularly susceptible to this missing flux problem, due to the extended array configurations needed to achieve sufficient angular resolution. The data in this work adds further evidence that high resolution interferometric continuum data from such data may not be telling the whole picture.
6 Acknowledgements
We thank Paul Ho and the referee, Stuart Lumsden, for instructive comments. The Australia Telescope is funded by the Commonwealth of Australia for operation as a National Facility managed by CSIRO.
References
- Beltrán et al. (2007) Beltrán M. T., Cesaroni R., Moscadelli L., Codella C., 2007, A&A, 471, L13
- Cesaroni et al. (1998) Cesaroni R., Hofner P., Walmsley C. M., Churchwell E., 1998, A&A, 331, 709
- Forster & Caswell (2000) Forster J. R., Caswell J. L., 2000, ApJ, 530, 371
- Hill et al. (2005) Hill T., Burton M. G., Minier V., Thompson M. A., Walsh A. J., Hunt-Cunningham M., Garay G., 2005, MNRAS, 363, 405
- Kurtz (2005) Kurtz S., 2005, in Cesaroni R., Felli M., Churchwell E., Walmsley M., eds, IAU Symposium Hypercompact HII regions. pp 111–119
- Kurtz et al. (1999) Kurtz S. E., Watson A. M., Hofner P., Otte B., 1999, ApJ, 514, 232
- Longmore et al. (2007a) Longmore S. N., Burton M. G., Barnes P. J., Wong T., Purcell C. R., Ott J., 2007a, MNRAS, 379, 535
- Longmore et al. (2007b) Longmore S. N., Burton M. G., Barnes P. J., Wong T., Purcell C. R., Ott J., 2007b, in IAU Symposium Vol. 242 of IAU Symposium, The molecular environment of massive star forming cores associated with Class II methanol maser emission. pp 125–129
- Longmore et al. (2006) Longmore S. N., Burton M. G., Minier V., Walsh A. J., 2006, MNRAS, 369, 1196
- Longmore et al. (2008) Longmore S. N., Burton M. G., Purcell C. R., Barnes P., Ott J., 2008, in Beuther H., Linz H., Henning T., eds, Astronomical Society of the Pacific Conference Series Vol. 387 of Astronomical Society of the Pacific Conference Series, Determining the Relative Evolutionary Stages of Very Young Massive Star Formation Regions. pp 58–+
- Longmore et al. (2007) Longmore S. N., Maercker M., Ramstedt S., Burton M. G., 2007, MNRAS, 380, 1497
- Phillips et al. (1998) Phillips C. J., Norris R. P., Ellingsen S. P., McCulloch P. M., 1998, MNRAS, 300, 1131
- Purcell et al. (2006) Purcell C. R., Balasubramanyam R., Burton M. G., Walsh A. J., Minier V., Hunt-Cunningham M. R., Kedziora-Chudczer L. L., Longmore S. N., 27** other authors 2006, MNRAS, pp 198–+
- Purcell et al. (2009) Purcell C. R., Longmore S. N., Burton M. G., Walsh A. J., Minier V., Cunningham M. R., Balasubramanyam R., 2009, MNRAS, 394, 323
- Sault et al. (1995) Sault R. J., Teuben P. J., Wright M. C. H., 1995, in Shaw R. A., Payne H. E., Hayes J. J. E., eds, ASP Conf. Ser. 77: Astronomical Data Analysis Software and Systems IV A Retrospective View of MIRIAD. pp 433–+
- Walsh et al. (1998) Walsh A. J., Burton M. G., Hyland A. R., Robinson G., 1998, MNRAS, 301, 640
- Walsh et al. (2003) Walsh A. J., Macdonald G. H., Alvey N. D. S., Burton M. G., Lee J.-K., 2003, A&A, 410, 597
 |
 |
 |
 |
 |
 |
 |
 |
 |
 |
 |
 |
 |
 |
 |
 |
 |
 |
 |
 |
 |
 |
 |
 |
 |
 |
 |
 |
 |
 |
 |
 |
 |
 |
 |
 |
 |
 |
 |
 |
 |
 |
 |
 |
 |
 |
 |
 |
 |
 |
 |
 |
 |
 |
 |
 |
 |
 |