Rate of Homogeneous Crystal Nucleation in molten NaCl
Abstract
We report a numerical simulation of the rate of crystal nucleation of sodium chloride from its melt at moderate supercooling. In this regime nucleation is too slow to be studied with “brute-force” Molecular Dynamics simulations. The melting temperature of (“Tosi-Fumi”) NaCl is K. We studied crystal nucleation at =K and K. We observe that the critical nucleus formed during the nucleation process has the crystal structure of bulk NaCl. Interestingly, the critical nucleus is clearly faceted: the nuclei have a cubical shape. We have computed the crystal-nucleation rate using two completely different approaches, one based on an estimate of the rate of diffusive crossing of the nucleation barrier, the other based on the Forward Flux Sampling and Transition Interface Sampling (FFS-TIS) methods. We find that the two methods yield the same result to within an order of magnitude. However, when we compare the extrapolated simulation data with the only available experimental results for NaCl nucleation, we observe a discrepancy of nearly 5 orders of magnitude. We discuss the possible causes for this discrepancy.
1 Introduction
Crystallization of salts is a phenomenon of great practical relevance. In fact, it is one of the most important industrial separation processes. But it also plays a crucial role in geological processes that occur on an altogether different time scale. The crystallization process consists of two steps: nucleation and growth. If nucleation is slow compared to the time it takes a crystal to grow to a size comparable to the size of the container, large single crystals will form (an example is rock salt). When nucleation is fast, the resulting solid will form as a fine powder. It is clearly important to be able to predict the rate of nucleation of salts and – at a later stage – to understand the factors that influence nucleation. In the present paper we aim to demonstrate that, with current simulation techniques and currently available force-fields, it is indeed possible to compute the rate of nucleation of a real salt crystal (in the present case NaCl from its melt) This opens the way to “ab-initio” predictions of nucleation rates of many ionic substances.
Solutions or melts can often be cooled well below their freezing temperature. The reason is that the formation of small nuclei of the stable crystal phase is an activated process that may be extremely slow. Intuitively, it is easy to understand why crystal nucleation is an activated process, i.e. why there is a free-energy barrier separating the metastable parent phase (the liquid) from the stable crystal phase. The point is that, initially, the formation of small crystalline nuclei costs free energy. But once the crystal nucleus exceeds a critical size, its free energy decreases as it grows. The rate at which crystal nuclei form depends strongly on , the free-energy required to form a critical nucleus. Classical Nucleation Theory (CNT) is commonly used to estimate the height of the nucleation barrier and to predict the rate of crystal nucleation [1, 2, 3, 4, 5]. According to CNT, the total free energy of a crystallite that forms in a supersaturated solution or melt contains two terms: the first is a “bulk” term that expresses the fact that the solid is more stable than the supersaturated fluid - this term is negative and proportional to the volume of the crystallite. The second is a “surface” term that takes into account the free-energy cost of creating a solid-liquid interface. This term is positive and proportional to the surface area of the crystallite. According to CNT, the total (Gibbs) free-energy cost to form a spherical crystallite with radius is
| (1) |
where is the number density of the solid, () the difference in chemical potential of the solid and the liquid, and is the solid-liquid interfacial free energy density. The function goes through a maximum at and the height of the nucleation barrier is
| (2) |
The crystal-nucleation rate per unit volume, , depends strongly on :
| (3) |
Here is a kinetic prefactor, is the absolute temperature and is Boltzmann’s constant. The CNT expression for the nucleation rate then becomes
| (4) |
Under experimental conditions, nucleation is infrequent on the time scale of typical molecular processes. Yet, when it happens, it proceeds rapidly. This makes it difficult to study the structure and dynamics of crystal nuclei of atoms or small molecules in experiments. In the case of NaCl, the experiments are also complicated by the fact that crystallization occurs at high temperatures. This may explain why there is a scarcity of experimental data on the nucleation of NaCl. To our knowledge, the only data are those of Buckle and Ubbelhode [6, 7, 8] from the 1960’s. In these experiments, crystallization in NaCl micro-droplets was observed visually. As the droplet size (() and time window for the measurement (1–30 seconds – after which the droplets sedimented out of view) – were fixed, the nucleation rate could be determined at one temperature only (905 K for NaCl). At this temperature, the nucleation rate was such that, on average, one nucleus would form during the observation time () in a droplet with a volume of order . Hence the experimental nucleation rate per unit volume was .
For experimental nucleation rates of this order of magnitude, brute-force MD simulations are out of the question. The average time it would take for nuclei to form spontaneously in a system consisting of several thousands of particles is of order of seconds. Clearly, this is beyond the scope of MD simulations. The standard solution to circumvent this problem is to perform simulations at much larger undercooling than used in the experiments. Huang et al. [9] performed MD simulations of melting and freezing of a droplet composed of 216 NaCl ions in vacuum: to this end, they performed temperature quenches down to 550K (i.e. approximately half the melting temperature) and found nucleation rates of the order of , which is 20 orders of magnitude higher than the experimental rate at .
Another effort to study nucleation at less severe supercooling was made by Koishi et al. [10]. These authors performed an MD simulation of 125000 ions system in vacuum, at temperatures of 740K (i.e. approximately 0.7 the melting temperature ) and 640K (i.e. approximately 0.6 the melting temperature ). Both free and periodic boundary conditions were used. The estimated nucleation rate at was , which is virtually the same value as found by Huang et al. [9] at a much larger supercooling. This is surprising because nucleation rates tend to depend very strongly on temperature. This suggests that, at least at the lowest temperatures, the barrier for crystal nucleation is negligible. More in general, crystal nucleation under extreme supercooling need not proceed following the same path as under moderate supercooling [5].
In what follows, we use the technique of refs. [11, 12, 13] based on a combination of umbrella sampling [14] (to determine the barrier height) and a dynamical simulation (to determine the crossing rate). The computing time required for this scheme does not scale exponentially with the nucleation barrier, but it does increase with increasing nucleus size.
We also compute the nucleation rate using an algorithm based on the ”forward flux sampling” (FFS) [15] and the ”Transition Path Samplig” (TIS) techniques [16] and compare it with the one obtained using the method previously mentioned.
In the present work we study homogeneous crystal nucleation in the Tosi-Fumi NaCl model for NaCl at two different temperatures, viz. =K and =K, corresponding to and undercooling. For this system, we computed the nucleation barrier, examined the structure and shape of the critical nucleus and computed the nucleation rate.
2 Methods
The Tosi-Fumi rigid-ion interaction potential for NaCl is of the following form [17, 18],
| (5) |
where the parameters have the values given in table 1.
Na-Na Na-Cl Cl-Cl
This pair potential is written as the sum of a Born-Mayer repulsion, two attractive van der Waals contributions and a Coulomb interaction term. In our simulations, we calculated the Coulomb interactions using the Ewald summations method with a real space cutoff of 10 and a real space damping parameter of 0.25 . We truncated the Van Der Waals part of the potential at 9 , assuming the beyond this cutoff.
The computed number density of ions in the bulk solid at K and K at Pa was , in agreement with experiment [19]. The density of ions in the supercooled liquid at the same temperature and pressure was .
We prepared under cubic boundary conditions a supercooled system of NaCl ion pairs at ambient pressure by cooling it down below the melting temperature. For the present model, Anwar et al. [20] have computed the melting temperature: =K, which is very close to the experimental melting temperature (=K). Using constant-pressure Monte Carlo simulations, we cooled the system down to the temperatures where we studied nucleation: =K and =K, corresponding to and undercooling. Note that the experiments on NaCl nucleation where performed at a somewhat higher temperature ( supercooling). The reason why we could not perform simulations at these higher temperatures is that the critical nucleus would be about twice the size of the nucleus that could be studied without spurious finite-size effects [21] for the system sizes that we employed. At temperatures below 750K, spontaneous nucleation occurred during the simulations. We therefore kept the temperature above this lower limit.
Nucleation is an activated process. In steady-state, the nucleation rate per unit volume and time is given by eq. (3) [2, 22, 5] where is the equilibrium probability per nucleus to find a critical nucleus in the metastable parent phase. is a kinetic prefactor. In the case of a diffusive barrier crossing, can be expressed as:
| (6) |
where is the ion density of the metastable liquid, the rate at which particles are added to a critical nucleus, = is the difference in chemical potential between liquid and solid and the Zeldovitch factor, that takes into account the fact that, during steady-state nucleation, the concentration of critical nuclei is, in fact, not the equilibrium concentration.
It is important to distinguish between , which is the rate at which particles are added to a nucleus with the critical size, and the net flux across the nucleation barrier. In steady state, this net flux is equal the number of nuclei that go from to minus the number that go from to [2, 3, 4]. Hence, the actual nucleation rate is a combination of the forward rate and the backward rate . However, because of detailed balance, knowledge of (combined with knowledge of the barrier height and shape) is enough to compute the nucleation rate.
Assuming a diffusive attachment or detachment of single particles from the critical nucleus, the forward rate at the top of the barrier can be related to the spontaneous fluctuations in the number of particles in a nucleus at the top of the nucleation barrier:
| (7) |
where = is the mean square change in the number of particles belonging to the critical nucleus during a time interval . To estimate a series of dynamical trajectories were necessary: after generating a set of uncorrelated configurations at the top of the barrier, we carried out NVT MD simulations using the package[23] with a timestep of 0.5 fs. We computed the nucleation rate using equation (3).
3 Results
We computed the free energy barrier for crystal nucleation at =800K and =825K, corresponding to = and =. The values of were estimated numerically by thermodynamic integration from the coexistence temperature and free energies reported by Anwar et al. [20]. Fig.1 shows the computed nucleation barriers as a function of .
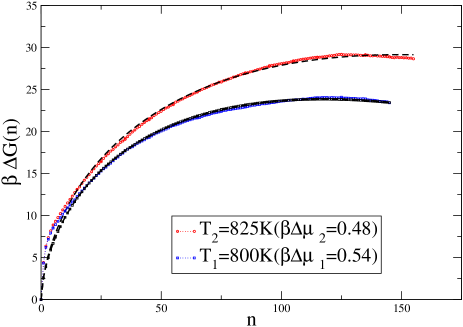
As expected, decreases with supersaturation. Around T750K the barrier gets sufficiently low that spontaneous nucleation can take place on the time scale of a simulation. The size of the critical nucleus, , was estimated according to a fit of the functional form of the CNT, and we found ions at and ions at . Koishi et al. [10] estimated ions at 640K and 740K, which is surprising in view of the CNT prediction that the size of the critical nucleus scales as . If we make the usual assumption [5] that and , where is the entropy of fusion per ion pair, then we would expect that and we would predict that the critical nucleus at 640K should contain a quarter as many particles as those at 800K.
Next, we consider the structure and shape of the critical nucleus.
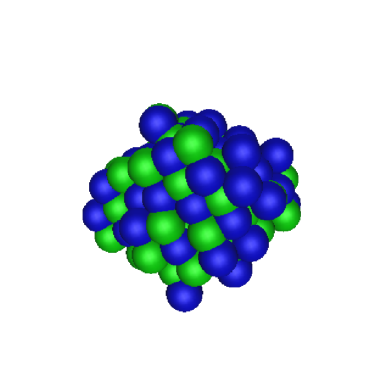
Fig.2 shows a snapshot of the critical nucleus at =825K. Note that the crystal presents rudimentary low-index facets. In experiments [6, 24] the existence of such facets was postulated, as they may act as sites for subsequent heterogeneous nucleation.
As can be seen from Fig.2, the critical nucleus already shows the charge-ordered rock-salt structure of the bulk phase. This indicates that, at least for NaCl, nucleation does not proceed via an intermediate metastable phase [25]. Fig.2 also shows that, in the temperature range that we studied, the critical nucleus is non-spherical. In order to quantify the degree of non-sphericity of the critical nucleus, we expanded its density with respect to the center of mass in rank-four-spherical-harmonics and constructed the quadratic invariant [26]: we obtained =0.115 and =0.110. For a simple cube =0.172 and for a sphere =0, therefore the shape of the critical nucleus is closer to a cube than to a sphere. In other words, the critical nucleus already exhibits the morphology of macroscopic NaCl crystals [27].
In order to make sure that there were not finite size effects that resulted in interactions between image cluster, we visually checked that the critical nuclei didn’t show a preferred spacial orientation and that the minimum distance between them was bigger than half box.
Moreover we calculated the Debye-Huckle screening lenght and found that it was smaller than 1 , showing that the critical nuclei did not even electrostatically interact. We could therefore conclude that there was no induced nucleation due to the interaction between a critical cluster and its own periodic image.
Using the computed height of the nucleation barrier and the values of as input, we can estimate the surface free-energy density . To this end, we make use of the CNT expression for the barrier height (eqn. 2). However, this expression assumes that the critical nucleus is spherical. It is easy to derive the corresponding expression for a cubical nucleus. The results for both estimates of are given in Table 2.
T[K] 800 825 905
There exist experimental estimates of at 905K [6]. These estimates are based on a somewhat questionable CNT expression for the nucleation rate. Moreover, in ref. [6] it is assumed that the critical nucleus is spherical. The experimental estimate of (=) is therefore not based on a direct determination. Nevertheless, in the absence of other experimental data, this is the only number we can compare to.
As the table shows, there is a fair agreement between simulation and experiment. The experimental estimate for is based on the assumption that the critical nucleus is spherical. If it is cubic, one would obtain the number in the lower right-hand corner. In view of the many uncertainties in the analysis of the experimental data, it is impossible to tell whether the discrepancy between simulation and experiment is significant. An estimate of based on the experimental enthalpy of fusion following Turnbull, would yield (see e.g. [9]).
Huang et al. [9] estimated the solid-liquid surface free-energy density of NaCl from the nucleation rate at 550K. To achieve this, Huang et al. assumed that the CNT expression for the nucleation rate is valid. Under those assumptions, they obtained: = for a spherical nucleus.
In the present work, we can compute absolute nucleation rates without making use of CNT. The only assumption we make is that the barrier crossing is diffusive and that the Zeldovitch (pre)factor is well approximated by the form given in eqn.(4). The Zeldovitch factors were found to be respectively =0.016 for and =0.013 for . The true Zeldovitch factor may be slightly different, but is in any event expected to be of . From our MD simulations we obtained the following estimates for the forward rates (eq. 7) : =0.013 ps-1 for and =0.033 ps-1 for . Combining this information, we can compute the kinetic prefactor of eq. 6: = 6.9 and = 1.5 . As is to be expected, the kinetic prefactor depends only weakly on temperature. Using eqn.(4) we then calculated the nucleation rate. The results are: =3 and =4 .
These nucleation rates are about ten orders of magnitude higher than the estimated experimental rate at 905K (). Such a difference is hardly surprising because the nucleation rate is expected to increase rapidly with increasing supercooling.
We also computed the nucleation rate using an algorithm based on the path-sampling techniques of refs. [15, 16] (Forward-Flux Sampling (FFS) and Transition-Interface Sampling (TIS)) . The value obtained at K is , which agrees surprisingly well with the one obtained using the diffusive barrier-crossing approach.
As the path-sampling method does not depend on the choice of the reaction coordinate and does not require prior knowledge of the phase space density, we can conclude that the method based on the free-energy calculation gives us a good estimate for the nucleation rate at this temperature.
We have also computed the nucleation rate at T=750 K, using the FFS-TIS method. The computed nucleation rate is =) . This is of the same order of magnitude as the nucleation rate obtained calculated by Koishi et al. [10] using “brute-force” MD. We cannot use the diffusive barrier crossing method at this temperature, as the barrier is too low to avoid spontaneous nucleation during long runs. However, if we assume that the kinetic pre-factor and the surface free-energy density do not vary much with temperature, we can use CNT to extrapolate the nucleation rate from to . We find: ) which is considerably lower than the results of the direct calculations. This suggests that an extrapolation procedure based on CNT is not reliable. A summary of our numerical results for the nucleation barriers and rates are given in Table 3.
T[K] 800 3 825 4
A similar problem occurs if we try to extrapolate our numerical data at and to , the temperature of the experiments of ref. [6]. If we can extrapolate our simulation results to the experimental temperature of 905 K (=0.3) we obtain an estimated nucleation at 905 K that is . This is some nearly five orders of magnitude less than the experimentally observed rate.
The discrepancy between simulation and experiment can be due to several reasons. a) There might be an appreciable (but unspecified) error in the experimental estimates (e.g. due to residual heterogeneous nucleation). b) The estimated error in the computed melting temperature of the Tosi-Fumi model is 20K [20]. Such an uncertainty again easily translates into a variation of the nucleation rate by several orders of magnitude. c) In view of the extreme sensitivity of nucleation rates to the details of the intermolecular potential (see, e.g. [28]), the Tosi-Fumi potential may be inadequate to model nucleation in NaCl, even though it can reproduce the static properties of the solid and liquid NaCl [29]. d) Finally, it it is not quite correct to assume that the kinetic prefactor, the surface free energy and the latent heat of fusion are temperature-independent.
We can also compare our calculated nucleation rate at to the rate estimated with CNT. In order to do that, we need to compute the kinetic pre-factor that, using the CNT approximations, is [5]:
| (8) |
The attachment rate of particles to the critical nucleus () takes into account the number of available attachment sites on the surface of a spherical nucleus () and depends on the jump frequency for bulk diffusion (), where is the atomic jump distance. Since the functional form of the nucleation barrier can be fitted to the corresponding CNT expression, the computed Zeldovitch factor (Z) coincides with the predicted one. We computed the self-diffusion coefficient with MD simulations using the package [23] in the supercooled liquid at =800K. We found , in good agreement with an estimate () based on extrapolation of the available experimental data of Ref. [30] to the temperature . Since , we only considered the self-diffusion of the Na+ ions. We estimated as a fitting parameter from the previously calculated; we obtained . However, considering that the ion size is , this value for the jump distance seems unphysical (). Typically, one would expect to be of the order of a mean free path. In a molten salt, the mean free path of an ion is certainly less than a particle diameter. This discrepancy also suggests that the CNT picture is inadequate to describe crystal nucleation of NaCl.
In summary, we have computed the crystal nucleation rate of sodium chloride from the melt using two independent methods: one based on calculations of the free-energy barrier and the diffusive barrier-crossing and another based on a path-sampling approach. We have found that, to within an order of magnitude, the two approaches yield the same value for the nucleation rate. When we use Classical Nucleation Theory to extrapolate our numerical data to lower temperatures, we observe serious discrepancies with the results of direct calculations. When we use CNT to extrapolate to high temperatures, we find serious discrepancies with the nucleation rates found in experiments. Several factors may contribute to this discrepancy but, at present, it is not yet known which factor is most important.
Acknowledgments
The work of the FOM Institute is part of the research program of FOM and is made possible by financial support from the Netherlands Organization for Scientific Research (NWO). C.V. gratefully acknowledges the financial support provided through the European Community Human Potential Program under contract HPRN-CT-1999-00025, (Nucleus). E.S. gratefully acknowledges the Spanish government for the award of a FPU Ph.D. grant, and the FOM Institute for the hospitality during the period in which this work was carried out.
C.V. and E.S. thanks Angelo Cacciuto and Rosalind Allen for valuable discussions and suggestions, and Georgios Boulougouris and Josep Pámies for a critical reading of the manuscript.
Appendix A Identification of crystalline clusters
To distinguish between solid-like and liquid-like particles and identify the particles belonging to a solid cluster, we used the local bond order parameter introduced by Ten Wolde el al. [31]. Although the method we used is the same as the one proposed by Ten Wolde, the definition of a ’solid-like’ particle is not rigorously the same. The q vector and the thresolds selected were optimazed for the NaCl Tosi-Fumi model.
First we computed a normalized complex vector for every particle . Each component of this vector was given by:
| (A-1) |
Where is the number of neighbours of the particle within a cut-off radious of 4 (the first minimum in the Na-Cl radial distribution function).
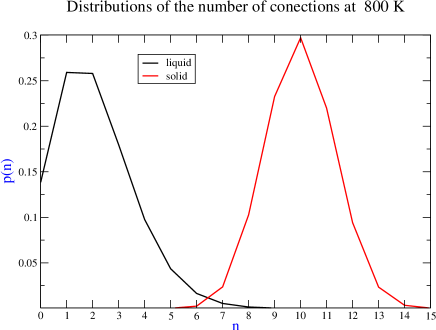
Then we computed a scalar product for every particle with each of its neighbours particle . A particle was considered to be ’solid-like’ when at least 6 of the scalar products were bigger than . Finally two ’solid-like’ particles were considered to be neighbours in the same cluster if they were closer than 3.4 .
Ionic fluids are more ordered than Lennard-Jones or Hard Spheres ones, as the radial distribution function shows. However, with the method implemented by Ten Wolde, we were able to clearly distinguish between solid-like and liquid-like particles in the NaCl Tosi-Fumi model. We enclose a plot3 that shows the distributions of the number of scalar products bigger than at T=800 K for the solid and for the liquid: for values bigger than 6 a particle was considered to be solid-like.
References
References
- [1] J. W. Gibbs, in The Scientific Papers of J. Willard Gibbs, New York, 1961, Dover.
- [2] M. Volmer and A. Weber, Z. Phys. Chem. 119, 227 (1926).
- [3] L. Farkas, Z. Phys. Chem. 125, 236 (1927).
- [4] R. Becker and W. Doring, Ann. Phys. 24, 719 (1935).
- [5] K. F. Kelton, in Crystal Nucleation in Liquids and Glasses, edited by .-. 45, Boston, 1991, Academic.
- [6] E. R. Buckle and A. R. Ubbelohde, Proc. R. Soc. London 529, 325 (1960).
- [7] E. R. Buckle and A. R. Ubbelohde, Proc. R. Soc. London 261, 197 (1961).
- [8] E. R. Buckle, Proc. R. Soc. London, Ser. A 261, 189 (1961).
- [9] J. Huang, X. Zhu, and L. S. Bartell, J. Phys. Chem. A 102, 2708 (1998).
- [10] T. Koishi, K. Yasuoka, and T. Ebisuzaki, J. Chem. Phys 119, 11298 (2003).
- [11] J. S. V. Duijneveldt and D. Frenkel, J. Chem. Phys. 96, 4655 (1992).
- [12] P. R. ten Wolde and D. Frenkel, J. Chem. Phys. 109, 9901 (1998).
- [13] S. Auer and D. Frenkel, J. Chem. Phys. 120, 3015 (2004).
- [14] G. M. Torrie and J. P. Valleau, Chem. Phys. Lett. 28, 578 (1974).
- [15] R. J. Allen, P. B. Warren, and P. R. tenWolde, Phys. Rev. Lett. 94, 018104 (2005).
- [16] T. S. V. Erp, D. Moroni, and P. G. Bolhuis, 2003 118, 7762 (J. Chem. Phys).
- [17] F. Fumi and M. Tosi, J. Phys. Chem. Solids 25, 31 (1964).
- [18] M. Tosi and F. Fumi, J. Phys. Chem. Solids 25, 45 (1964).
- [19] G. J. Janz, in Molten Salt Handbook, New York, 1967, Academic.
- [20] J. Anwar, D. Frenkel, and M. Noro, J. Chem. Phys. 188, 728 (2003).
- [21] J. D. Honeycutt and H. C. Andersen, Chem. Phys. Lett 108, 535 (1984).
- [22] D. W. Oxtoby, J. Phys.: Condens. Matter 4, 7627 (1992).
- [23] W. Smith and T. Forester, J. Mol. Graphics 14, 136 (1996).
- [24] P. Balk and G. C. Benson, J. Phys. Chem. 63, 1009 (1959).
- [25] W. Ostwald, Z. Phys. Chem 22, 289 (1897).
- [26] P. R. ten Wolde, M. J. Ruiz-Montero, and D. Frenkel, Phys. Rev. Lett. 75, 2714 (1995).
- [27] J. C. Heyraud and J. J. Métois, J. Cryst. Growth 82, 269 (1987).
- [28] S.Auer, W. C. K. Poon, and D. Frenkel, Phys. Rev. E 67, 020401 (2003).
- [29] T. Zykova-Timan, U. Tartaglino, D.Ceresoli, and E. Tosatti, Surface Science 566, 794 (2004).
- [30] J. O. M. Bockris, S. R. Richards, and L. Nanis, J. Phys. Chem. 69, 1627 (1965).
- [31] P. R. ten Wolde, M. J. Ruiz-Montero, and D. Frenkel, Faraday Discuss. 104, 93 (1996).