The June 2008 flare of Markarian 421 from optical to TeV energies
Abstract
We present optical to very-high energy (VHE) gamma-ray observations of Mrk 421 between 2008 May 24 and June 23. A high-energy (HE) gamma-ray signal was detected by AGILE-GRID during June 9–15, brighter than the average flux observed by EGRET in Mrk 421 by a factor of 1.5. In 20–60 keV X-rays, a large-amplitude 5-day flare (June 9–15) was resolved with a maximum flux of approx. 55 mCrab. SuperAGILE, RXTE/ASM and Swift/BAT data show a clearly correlated flaring structure between soft and hard X-rays, with a high flux/amplitude variability in hard X-rays. Hints of the same flaring behavior is also detected in the simultaneously recorded GASP-WEBT optical data. A target of opportunity observation by Swift near the flare maximum on June 12–13 revealed the highest 2-10 keV flux ever observed (100 mCrab) and a peak synchrotron energy of approx. 3 keV, a large shift from typical values of 0.5–1 keV. Observations at VHE (200 GeV) gamma-rays during June 6–8 show the source flux peaking in a bright state, well correlated with the simultaneous peak in the X-rays. The gamma-ray flare can be interpreted within the framework of the Synchrotron Self Compton model in terms of a rapid acceleration of leptons in the jet.
X-rays: observations; Gamma-rays: observations; Blazars: individual (Mkn 421)
1 Introduction
Mrk 421 is a nearby blazar (), detected in -rays by EGRET [1] and it was the first extragalactic object detected at GeV [2]. It belongs to the class of high-energy peaked BL Lac objects (HBLs) [3], i. e. radio-loud active galactic nuclei with high radio and optical polarization. Its spectral energy distribution (SED) is double-humped with a first peak usually in the soft to medium X-ray range, and a second one at GeV-TeV energies [4, 5]. The first hump is commonly interpreted as due to synchrotron radiation from high-energy electrons in a relativistic jet, while the origin of the second peak is still uncertain. In leptonic scenarios it is interpreted as inverse Compton (IC) scattering of the synchrotron (Synchrotron self-Compton, SSC) or external photons (External Compton, EC) by the same population of relativistic electrons. The observed correlated variability between X-rays and TeV -rays [6, 7, 8] is well explained in the SSC framework [9], whereas the EC scenario is unlikely to apply in HBLs, due to the low density of ambient photons. Alternatively, hadronic models invoke proton-initiated cascades and/or proton-synchrotron emission [10, 11]. Leptonic and hadronic scenarios for HBLs predict different properties of the -ray emission in relation to emissions in other energy bands. -ray observations of flaring BL Lacs and simultaneous multiwavelength data are thus the keys to investigating these two scenarios.
A hard X-ray flare of Mrk 421 was detected by SuperAGILE on 2008 June 10 [12]. This detection was later followed by a detection in -rays [13] by the AGILE/GRID (Gamma Ray Imaging Detector) and prompted a ToO observation by Swift/XRT, complementing the ongoing multifrequency observing campaign of Mrk 421 with GASP-WEBT (optical), MAGIC and VERITAS (TeV). A full account of this work has recently been published [14].
2 Observations and Results
2.1 AGILE observations
The AGILE [15] composite payload allows for simultaneous observations in the energy ranges 30 MeV-30 GeV and 20–60 keV over a very wide field of view by means of GRID and the hard X-ray imager SuperAGILE, respectively. Mrk 421 was observed for five days, between 2008-06-09 17:02 UT and 2008-06-15 02:17 UT.
2.1.1 Hard X-ray observations
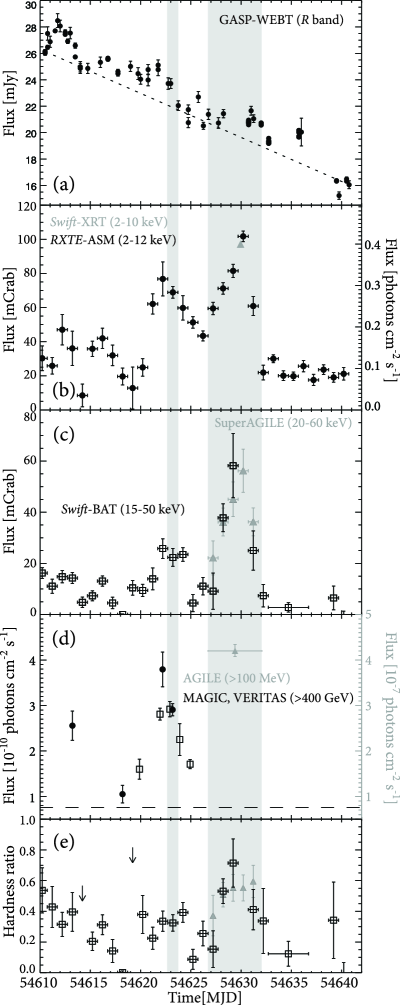
On 2008 June 10, SuperAGILE detected enhanced hard X-ray emission from Mrk 421. The measured flux in 20–60 keV was found to be above 30 mCrab (24-hour average), almost an order of magnitude larger than its typical flux in quiescence. In the following days, the flux increased up to about 55 mCrab. The 5-day 20-60 keV SuperAGILE light curve is shown in Fig. 1c. Using the publicly available light curves for this source from the BAT instrument in the 15-50 keV energy range, we calculated daily averages, obtaining a good coverage also before and after the AGILE observation (black squares in Fig. 1c), revealing that SuperAGILE indeed observed the maximum brightness of this hard X-ray flare.
SuperAGILE photon-by-photon data allows extraction of a time-averaged energy spectrum from the mask-convolved data. Given the lack of substantial spectral variability in the SuperAGILE/ASM hardness ratio (Fig. 1e) we accumulated the average energy spectrum from the data of the last 4 days of the observations, when the source flux varied between 35 and 55 mCrab, for a total exposure of ks, constraining the photon index of a simple power law, (, 2 dof). The average flux is erg cm (( photons cm-2 s-1).
2.1.2 Gamma-ray Observations
Mrk 421 was not detected on daily time scales, implying a daily-averaged flux photons cm-2 s-1, similar to what observed by EGRET [16]. A 4.5- significance in the range 100 MeV-10 GeV resulted from an integration over the whole 5-day period ( ks). The measured flux is ( photons cm-2 s-1, about 3 times higher than the average flux detected by EGRET (, [16]) and 1.5 times higher than, but still consistent, with the highest flux ( photons cm-2 s-1 observed during the Viewing Period 326.
2.2 The Soft X-ray band
2.2.1 Swift X-ray telescope
Following the SuperAGILE detection, on 2008 June 12 Swift ToO observations were triggered. between 2008 June 12 19:33:20 UT and June 13 at 01:57:37 UT for 5 ks. The XRT spectral data are well described by an absorbed log-parabolic model. A joint fit of the XRT and SuperAGILE spectral data using the 4-day average spectrum used the log-parabolic model with Galactic absorption ( cm-2; [17]), defined as:
photons cm-2 s-1
where is the photon index at 1 keV and is the curvature parameter [18, 19]. This model usually describes adequately the featureless and curved spectrum in HBLs. The joint fit provides , (=1.4, 763 dof), which implies a peak energy keV, and predicts erg cm-2 s-1 (or photons cm-2 s-1) and erg cm-2 s-1 (( photons cm-2 s-1), comparable to the stand-alone SuperAGILE best fit.
2.2.2 RossiXTE All Sky Monitor (ASM)
We retrieved the public light curves provided by the ASM to trace the evolution of the soft X-rays during the AGILE observation. Fig. 1b shows the daily light curve of Mrk 421 in the energy range 2-12 keV, obtained by properly averaging the dwell-by-dwell data.
The emission at soft X-rays is well correlated with hard X-ray emission. The ASM data show that the XRT observation took place when the source was at its maximum emission at soft X-rays (MJD 54630). Comparing the relative intensity of the two flares in Fig. 1, the second peak appears to be significantly harder than the first one. This is also seen in Fig. 1e, where we computed the daily-averaged hardness ratio between hard (15–60 keV) and soft (2–12 keV) X-rays. The source appears to have undergone the hardest part of this double-humped flare just during the AGILE -ray detection.
2.3 Observations in the VHE -rays
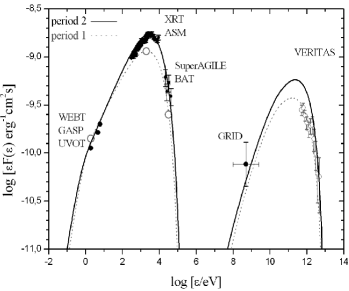
The 4-telescope array VERITAS [20] in Arizona, USA, and the single-dish instrument MAGIC [21, 22] at La Palma are imaging air Cherenkov telescopes covering an energy range from GeV to some tens of TeV. The instruments have a typical energy resolution of 20% (VERITAS) and 20–30% (MAGIC), and event-by-event angular resolution of 0.14∘. Wobble-mode observations [23] at an 0.4∘ offset from the camera center were taken on five nights from 2008 June 3–8 with MAGIC at zenith angles (ZA) between 28∘ and 48∘ and on 4 nights (May 27, June 1, 5, 6) with VERITAS (wobble offset: 0.5∘) at ZA between 32∘ and 40∘ during partial moon light conditions. The total live-time after applying quality selection is 2.95 and 1.17 hours with MAGIC and VERITAS, respectively. The data were analyzed using the MAGIC [24] and VERITAS [25, 20] standard calibration and analyses and image parameters [26]. Two independent analyses of both the MAGIC and VERITAS data sets yielded consistent results. In total, a signal corresponding to a significance level of (VERITAS) and (MAGIC) is obtained. The combined MAGIC-VERITAS data (Fig. 1d) show a transient peaking near MJD 54622. The VERITAS energy spectrum for June 6 is provided. A power law fit over the energy range 0.3–5 TeV resulted in a =0.7 with a photon index . In Fig. 2 we show the intrinsic -ray spectrum at the source reconstructed by removing attenuation effects by the extragalactic background light [27] following the procedure of [28]. Fitting a power law to the intrinsic spectrum yields a photon index , which is not significantly harder than the measured spectrum due to the relatively low redshift z 0.031.
2.4 Optical and UV observations
Mrk 421 is one of the 28 -ray-loud blazars regularly monitored by the GLAST-AGILE Support Program (GASP; [29]) of the Whole Earth Blazar Telescope (WEBT). The GASP observations started in early 2007 November.
During the Swift pointing on 2008 June 12–13, the UVOT [30] instrument observed Mrk 421 in the UVW1 and UVW2 photometric bands. The UVOTSOURCE tool is used to extract counts, correct for coincidence losses, apply background subtraction, and calculate the source flux.
3 Discussion
Mrk 421 showed an interesting broad-band activity during the first half of 2008 June as derived from AGILE data combined with those of GASP-WEBT, Swift, MAGIC and VERITAS. Using our multi-frequency data we were able to derive time-resolved SEDs (Fig. 2). We distinguish two time periods: period 1, 2008 June 6, and period 2, 2008 June 9–15. The optical, soft and hard X-ray bands strongly constrain the SED around the synchrotron peak, and its daily variability reveals the physical processes of Mrk 421. Possible correlated variability is shown in Fig. 1 between the optical, the X-ray, and the high-energy parts of the spectrum. Based on the physical constraints obtained for the synchrotron peak, we can model both the HE and VHE -ray emission. We first model the synchrotron peak of emission using the period 1 optical, soft and hard X-ray data. The short time-variability (Fig. 1) constrains the size of the emitting region to cm. Hence, we consider a one-zone SSC model [31] based on a blob of comoving size cm, with a relativistic Doppler factor and characterized by non-thermal comoving electron energy distribution function described by a double power law:
| (1) |
where the comoving Lorentz factor () varies in the range , the normalization (density) constant cm-3, and the break energy and with , , the low-energy and high-energy power-law indices, respectively (see Table 1). With these parameters we found that the data for period 1 are best fitted with a comoving magnetic field G.
Variability may be caused by several factors; we consider two cases: (A) hardening/softening of the electron energy distribution function caused by particle acceleration processes; (B) increase/decrease of the comoving particle density, as a consequence of additional particle injection/loss by shock processes.
We expect TeV variability to be comparable with the X-ray one if case (A) applies: this is because the emission is in the Klein-Nishina regime. Alternately, for case (B) we expect the TeV relative variability () to be a factor of 2 greater than that of the X-ray flux variability.
Our AGILE, MAGIC and VERITAS data appear to support case (A). We compare the SEDs for period 1 and period 2, to better assess the spectral evolution. In Fig. 2 we show our optimized modelling of the time-resolved synchrotron peak and consequent SSC high-energy emission for the period 1 as well as for 2008 June 12–13 of the period 2. In the last case, the adopted model parameters are , , , cm-3. Our model predicts an even larger TeV flux for period 2 (no TeV observations exist, however) than detected in period 1.
The optical light curve shows variations of the order of on a time scale few days, superimposed on a long decay during the entire period. Individual soft and hard X-ray peaks result in increased fluxes by a factor of 2.5 and 5, respectively: no long term decay appears. This different behavior of the X-ray radiation and the bulk of the optical emission may suggest a more complex scenarios than A) and B): optical and X radiation comes from two different jet regions, each one characterized by its own variability. A possible scenario is one in which the inner jet region would produce the X-rays and it would be at least partially transparent to the optical radiation. In contrast, the outer region can only produce lower-frequency emission. The signature of the X-ray events visible in the optical light curve would come from the inner region and would be diluted by the optical radiation emitted from the outer region, see [32] for the case of Mrk 501; [33].
Interestingly, the 2-10 keV flux measured by XRT on June 12 – 13, erg cm-2 s-1, is higher than all previous observations ( erg cm-2 s-1; [7, 34]). A joint analysis of the XRT and SuperAGILE data, covering the range from 0.7 to 60 keV, provides a best-fit spectral model consistent with a log-parabolic shape, with parameters implying a peak energy 3 keV, in good agreement with the steeper positive correlation between the peak energy and the maximum of the SED found by [35]. although our value of the peak energy shows a significant shift with respect to typical values of 0.5-1 keV for this source.
Acknowledgements
AGILE is a mission of ASI, with co-participation of INAF and INFN. This work was partially supported by ASI grants I/R/045/04, I/089/06/0, I/011/07/0 and by the Italian Ministry of University and Research (PRIN 2005025417), (ASDC) I/024/05/1. The MAGIC collaboration thanks the Instituto de Astrofisica de Canarias for the excellent working conditions at the Observatorio del Roque de Los Muchachos in La Palma and acknowledges support by the German BMBF and MPG, the Italian INFN and Spanish MCINN, by ETH Research Grant TH 34/043, by the Polish MNiSzW Grant N N203 390834, and the YIP of the Helmholtz Gemeinschaft. The VERITAS collaboration is supported by grants from the U.S. Department of Energy, the National Science Foundation, and the Smithsonian Institution, by NSERC in Canada, Science Foundation Ireland, and PPARC in the UK and acknowledges the technical support staff at the FLWO. We also acknowledge the Swift Team for carrying out the ToO observation. RMW’s research is supported in part by the DFG Cluster of Excellence “Origin and Structure of the Universe”.
| parameter | period 1 | period 2 |
|---|---|---|
| 2.22 | 2.1 | |
| 4.5 | 5 | |
| [G] | 0.1 | 0.1 |
| [cm-3] | ||
| 20 | 20 | |
| 2 | 2 |
References
- [1] Lin, Y. C. et al. 1992, ApJ, 401,61
- [2] Punch, M. et al. 1992, Nature, 358, 477
- [3] Padovani, P. & Giommi, P. 1995, ApJ, 444, 567
- [4] Sambruna, R. M., Maraschi, L., Urry, C., 1996, ApJ, 463, 444
- [5] Fossati, G. et al. 1998, MNRAS, 299, 433
- [6] Maraschi, L. et al. 1999, ApJ, 526, L81
- [7] Fossati, G. et al. 2008, ApJ, 677, 906
- [8] Wagner, R.M., 2008, PoS(BLAZARS2008), 63, 013
- [9] Ghisellini, G. et al. 1998, MNRAS, 301, 451
- [10] Aharonian, F. A. 2000, NewA, 5, 377
- [11] Mücke, A. et al. 2003, APh, 18, 593
- [12] Costa, E. et al. 2008, ATEL
- [13] Pittori, C. et al. 2008, ATEL
- [14] Donnarumma, I. et al., 2009, ApJ, 691, L13.
- [15] Tavani, M. et al., 2008, Nucl. Instrum. Meth. A, 588, 52
- [16] Hartman, R. C., et al. 1999, ApJS, 123, 79
- [17] Lockmann, F. J., & Savage, B. D. 1995, ApJS, 97, 1
- [18] Massaro, F. et al. 2004, A&A, 422, 103
- [19] Massaro, F. et al. 2008, A&A, 478, 395
- [20] Acciari, V. A. et al. (VERITAS Collab.) 2008, ApJ, 679, 1427
- [21] Baixeras, C. et al., 2004, Nucl. Instrum. Meth. A, 518, 188
- [22] Tescaro, D. et al. (MAGIC Collaboration) 2008, in Proc. 30th ICRC, Merida, Mexico, Vol. 3, 1393
- [23] Daum A. et al. (HEGRA Collab.) 1997, Astropart. Phys., 8, 1
- [24] Albert et al. (MAGIC Collab.) 2008a, ApJ, 674, 1037
- [25] Daniel, M. K. et al. 2007, in Proc. 30th ICRC, Merida, Mexico, Vol. 3, 283
- [26] Hillas A. M. 1985, in Proc. 19th ICRC, La Jolla, USA, Vol. 3, 445
- [27] Hauser, M. G., Dwek, E., 2001, ARA&A, 39, 249
- [28] Raue M., Mazin, D. 2008, Int. J. Mod. Phys. D, 17, 1515
- [29] Villata, M., et al. 2008, A&A, 481, L79
- [30] Poole, T. S. et al. 2008, MNRAS, 383, 627
- [31] Tavecchio, F., et al. 1998, ApJ, 509, 608
- [32] Villata, M., & Raiteri, C. M. 1999, A&A, 347, 30
- [33] Villata, M., et al. 2004, A&A 421, 103
- [34] Lichti, G. G., et al. 2008, A&A, 486, 721
- [35] Tramacere, A., et al., 2007, A&A, 467, 501