Application of Monte Carlo-based statistical significance determinations to the Beta Cephei stars
V400 Car, V401 Car, V403 Car and V405 Car
Abstract
We have used Lomb-Scargle periodogram analysis and Monte Carlo significance tests to detect
periodicities above the 3-sigma level in the Beta Cephei stars V400 Car, V401 Car, V403 Car and
V405 Car. These methods produce six previously unreported periodicities in the expected frequency
range of excited pulsations: one in V400 Car, three in V401 Car, one in V403 Car and one in V405
Car. One of these six frequencies is significant above the 4-sigma level. We provide statistical
significances for all of the periodicities found in these four stars.
1 Introduction
The refinement of asteroseismological models requires increased numbers of statistically reliable pulsational periodicities for observed stars. Recent advances in the detailed modelling of Beta Cephei stars (for example, Miglio et al. (2007), Pamyatnykh & Ziomek (2007), Smolec & Moskalik (2007)) have added urgency to the need for accurate and complete identification of pulsation modes in real stars. This requires quantified significances for peaks identified in periodograms. Frescura et al. (2008) recently reviewed some statistical significance tests that are in common use in periodogram analysis, and have assessed and compared their reliability. In their paper, they recommend implementing Monte Carlo methods to establish the significances of periodogram peaks, arguing that these are more reliable than the methods in common use. Accordingly, we have calculated the Lomb-Scargle periodograms, suitably normalised by the variance of the data (as advised by Horne & Baliunas, 1986), for observations of the four Beta Cephei stars V400 Car, V401 Car, V403 Car and V405 Car, and have applied Monte Carlo methods in the way proposed by Frescura et al. (2008) to assign significances to peaks identified in each periodogram analysis. This involved the construction of cumulative distribution functions (CDF’s) for pseudo-Gaussian noise generated on the observation time-grid of each of the respective real data sets. These CDF’s were then used to determine quantitatively the significances of candidate peaks in their respective periodograms. The results of these analyses are described in the sections that follow.
We report a number of newly discovered periodicities that lie above the 3 sigma level (a significance of 99.7%) in each of these stars. Our analysis determines that there are seven periodicities above the 3-sigma level that lie within the expected range for pulsation modes in V400 Car, eight in V401 Car, four in V403 Car, and four in V405 Car. The methods applied in this paper provide an objective assessment of the identified periodicities.
A canonical value of 4:1 for the signal-to-noise ratio in a Fourier amplitude spectrum (see Breger et al., 1993) has long been applied as a threshold for accepting that a detected periodicity may be attributed to a variation in the stellar magnitude itself. Kuschnig et al. (1997) showed that this 4:1 ratio corresponds to a significance of approximately 99.9% as determined from Monte Carlo trials. The detections claimed in this paper therefore correspond very closely to the generally accepted threshold for period detection in pulsating stars.
2 Significances of periodicities in V400 Car
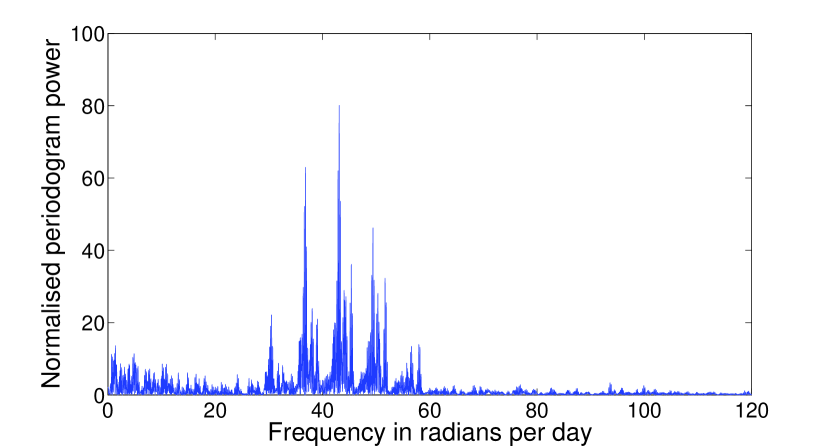
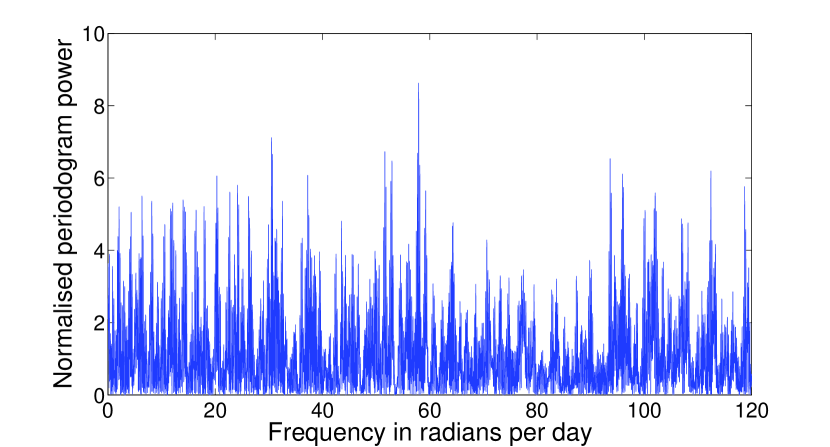
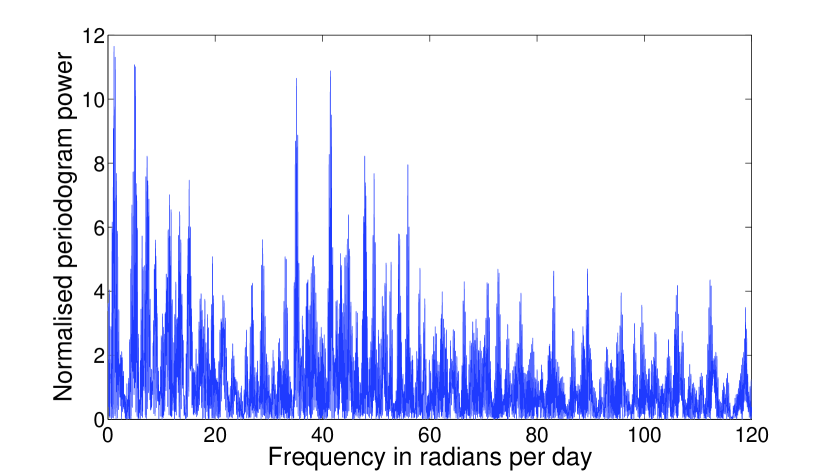
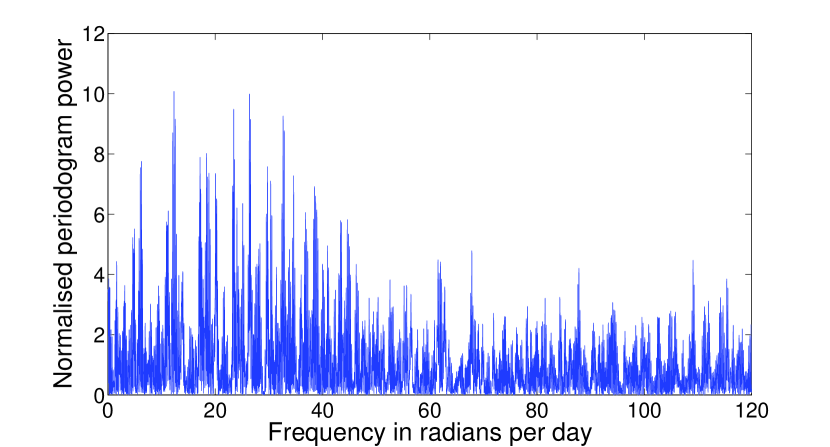
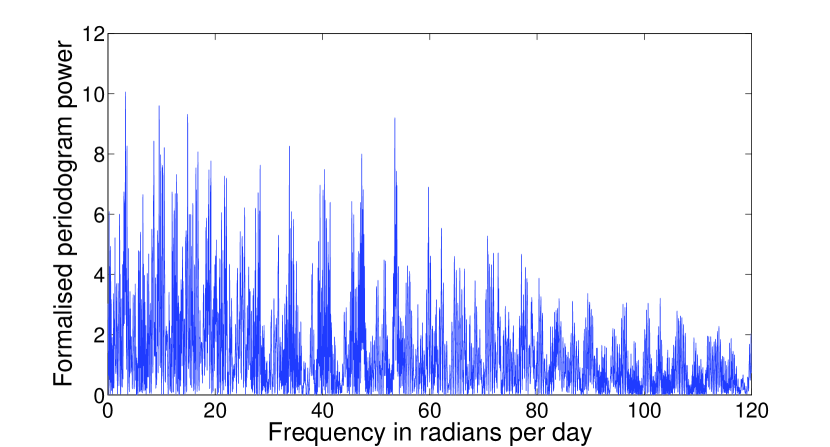
The data set consists of 533 observations of V400 Car (star no. 11 in the designation of Feast (1958) and Turner et al. (1980) for stars in NGC3293) in the Johnson B band, obtained with the 1.0 m telescope at the Sutherland station of the South African Astronomical Observatory (SAAO) during a total timespan of 68 days in 1984. The Lomb-Scargle periodogram of these data, normalised by the variance of the data, is shown in Figure 1.
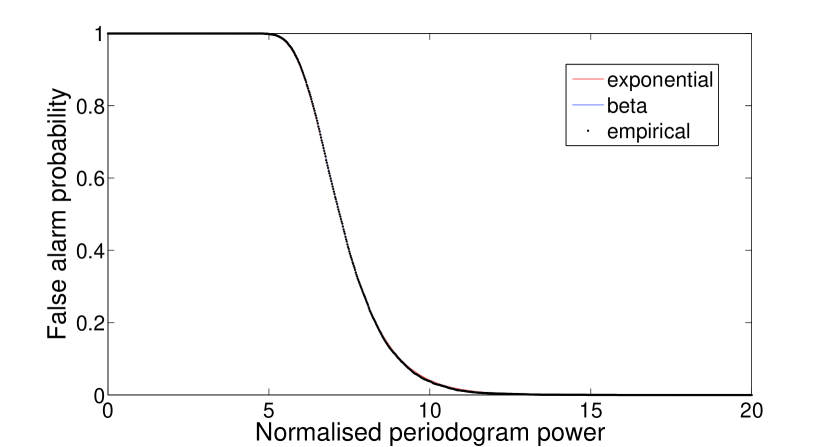
The periodogram was over-sampled by a factor of approximately 25. The limiting empirical CDF computed for the time data, as described in Frescura et al. (2008), is shown in Figure 2.
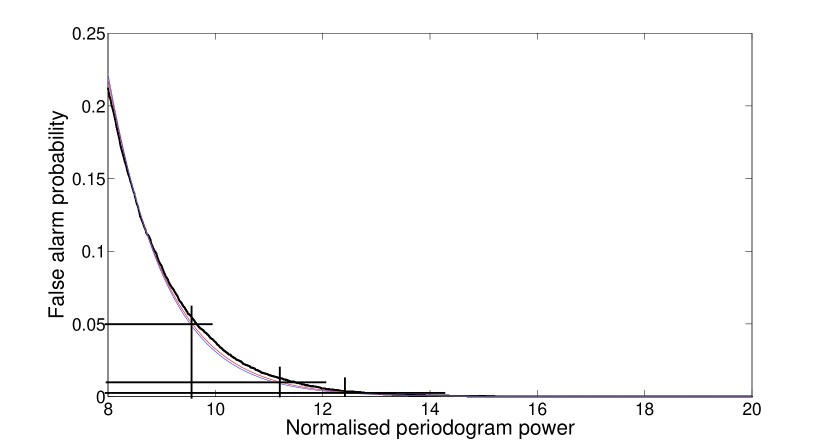
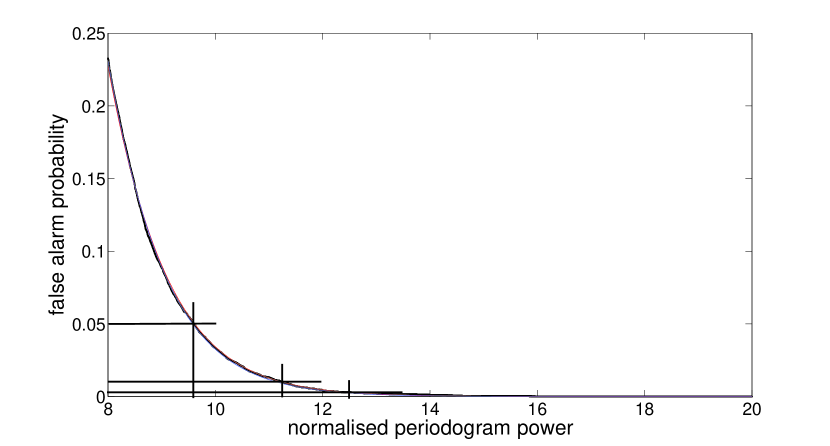
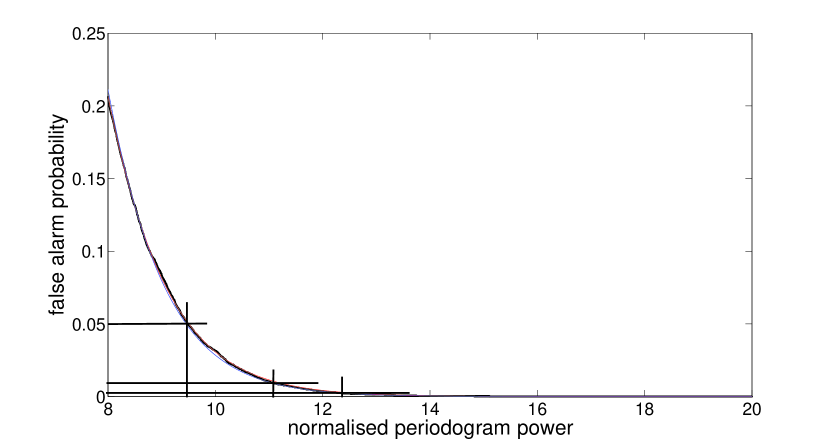
An enlargement of the critical region of this CDF is shown in Figure 3.
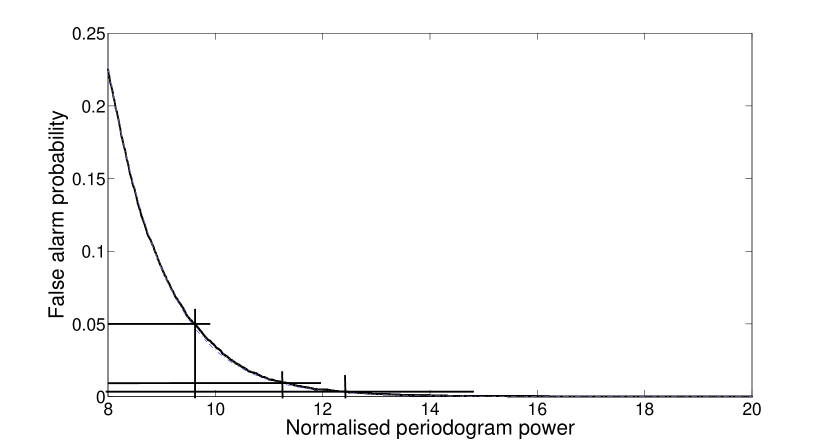
Two theoretical distribution functions were re-fitted to the tail of the empirical CDF shown in the enlargement. These are the exponential distribution function and the incomplete beta function (called simply the beta function in the remainder of this paper). A detailed discussion of this refitting procedure and of these theoretical distribution functions is given in Frescura et al. (2008). Both theoretical distributions fit the empirical CDF’s reasonably well in this region, though not to the same degree. For V400 Car and for V401 Car, the peak significances estimated from the empirical CDF’s were slightly lower (i.e. the false alarm probabilities were higher) than those obtained from the best-fitting theoretical distribution functions. For V403 Car and for V405 Car, the peak significances estimated from the empirical CDF’s lie mostly between those obtained from the best-fits of the two respective theoretical distribution functions. Comparisons of the respective estimates of significance obtained from the empirical CDF’s and from the theoretical distribution functions are displayed in Tables 1, 3, 5, and 7. For all four stars, the peak significances obtained from the best-fitting exponential distribution function are lower than those obtained from the beta function. In each of these four cases, therefore, the best-fitting exponential function provides the most conservative estimate of significance for the detected periodicities, and this is the estimate that we used in the tables that follow. In Figure 3, the horizontal solid lines indicate false alarm probabilities of , and respectively (i.e. peak significances of , and respectively). The periodogram peak values (i.e. normalised power levels) associated with these significances are read off the abscissae where the best-fit exponential function crosses the respective horizontal solid lines. The power levels corresponding to the aforementioned three significance thresholds, for the empirical CDF as well as for both of the theoretical distribution functions, are displayed in Table 1 .
| Significance | Periodogram Power Level | ||
|---|---|---|---|
| empirical | exponential function | beta function | |
| 95 % | 9.61 | 9.60 | 9.56 |
| 99 % | 11.23 | 11.23 | 11.13 |
| 99.7 % | 12.48 | 12.43 | 12.28 |
The significances of peaks appearing in the periodogram of V400 Car were determined by using the exponential function providing the best fit to the tail of the associated empirical CDF. The oversampled, normalised Lomb-Scargle periodogram shown in Figure 1 was subjected to a standard prewhitening procedure, as follows:
-
1.
determine the frequency at which the highest peak occurs in the periodogram;
-
2.
determine the best-fitting amplitude and phase of a sinusoid with this frequency by a least-squares comparison with the data;
-
3.
subtract this sinusoid (including the best-fitting amplitude and phase) from the data;
-
4.
recalculate the oversampled, normalised Lomb-Scargle periodogram for the modified data;
-
5.
repeat step (1) above;
-
6.
determine the respective best-fitting amplitudes and phases of two sinusoids with the frequencies determined in steps (1) and (5) above;
-
7.
iterate steps (4) to (6) above, recalculating the respective best-fitting amplitudes and phases for the entire set of determined frequencies each time.
Prewhitening was continued until a level clearly below the 99.7% (3-sigma) significance level (as established by the best-fit exponential function) of the data set was reached. A full list of the results of the prewhitening procedure for V400 Car appears in Table 2.
| Number | Rad | Cycles | Amp (mmag) | Power | Significance |
|---|---|---|---|---|---|
| 43.11 | 6.86 | 6.4 | 80.1 | % | |
| 42.24 | 6.72 | 4.1 | 50.1 | % | |
| 45.38 | 7.22 | 3.0 | 39.3 | % | |
| 44.36 | 7.06 | 2.9 | 42.1 | % | |
| 41.75 | 6.64 | 2.5 | 26.7 | % | |
| 2.36 | 0.38 | 2.4 | 29.2 | % | |
| 1.40 | 0.22 | 2.1 | 27.2 | % | |
| 3.29 | 0.52 | 1.5 | 18.5 | % | |
| 0.66 | 0.11 | 1.3 | 17.8 | % | |
| 41.40 | 6.59 | 1.2 | 12.9 | % | |
| 12.24 | 1.95 | 1.2 | 13.0 | % | |
| 53.48 | 8.51 | 1.1 | 12.8 | % | |
| 15.05 | 2.40 | 1.1 | 10.0 | % |
For convenience, each frequency is listed in units of radians per day and of cycles per day, along with its best-fit amplitude in millimagnitudes, its respective normalised power in the periodogram, and the associated significance of the normalised power level, as determined from the fitting of the exponential distribution function to the tail of the empirical CDF.
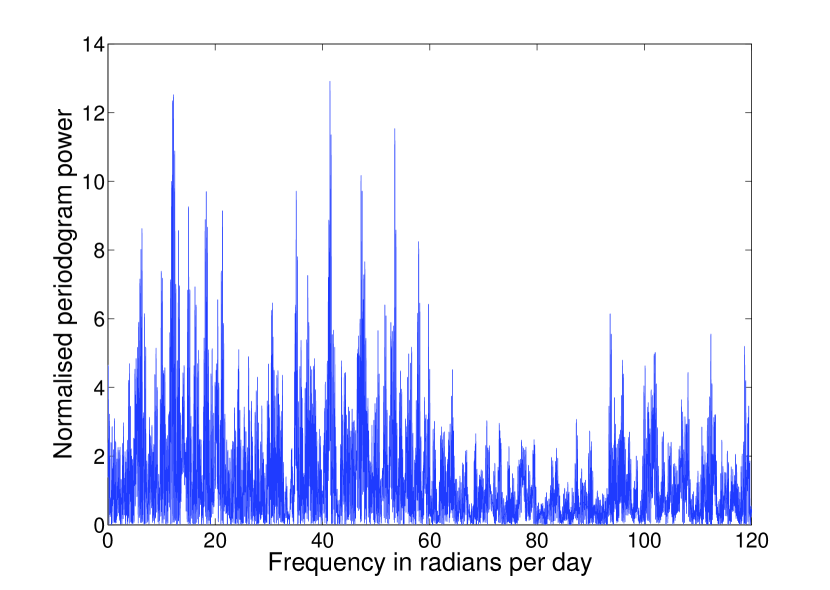
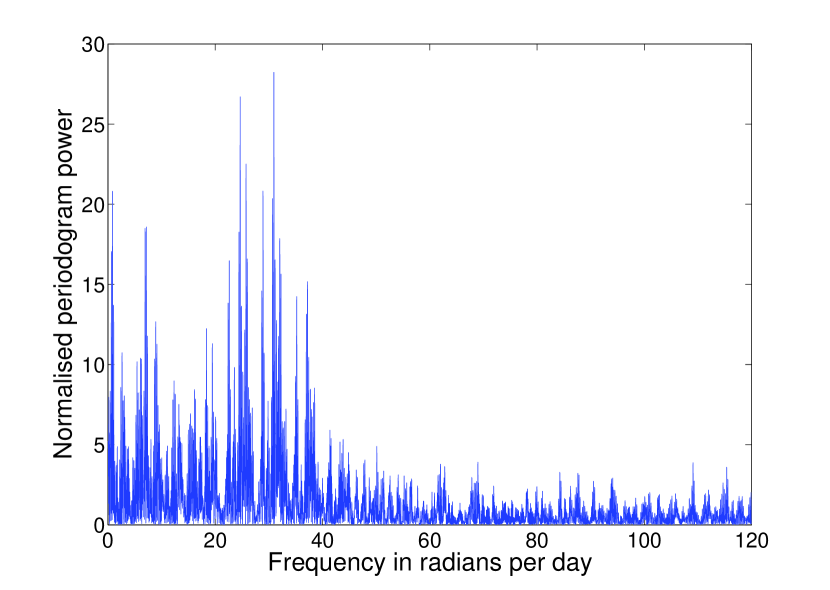
The day-to-day and week-to-week spacings in the observations of V400 Car generate substantial peaks in the low-frequency part of the periodogram. Once the strongest five peaks (determined through the prewhitening procedure outlined above) are removed, the next four strongest periodicities in the data correspond roughly to periods of three days, five days, two days and nine days respectively and are listed as frequencies to . These are probably artifacts of the data spacing rather than real signals present in the varying luminosity of V400 Car. However, given that the maximum possible rotation period of this star is roughly 8 days (based on spectral line broadening measurements by Balona (1975) and radius calculations by Engelbrecht (1986)), one or more of , , and might be related to the rotation period of V400 Car. There are three further frequencies above a significance level of 99.7% that could be interpreted as real periodicities in the luminosity of V400 Car. One of these, , probably corresponds to the mode reported in Heynderickx et al. (1994) with a frequency of 6.61 cycles . The other, , lies comfortably in the range expected for pulsation modes in Beta Cephei stars (see, for example, Pamyatnykh, 2003). We propose that is a newly identified pulsation mode in V400 Car, bringing the total number of detected modes in this star to seven. Heynderickx et al. (1994) suggested that g-modes could be excited in Beta Cephei stars. Model calculations by Pamyatnykh (1999) predict the existence of pulsationally unstable low-order g-modes with eigenfrequencies between approximately 2 and 3 cycles per day for stars within the narrow range of effective temperatures covered by the four stars discussed here. Frequencies and in Table 2 could therefore possibly correspond to g-modes, although the significance of the latter frequency lies below the 3-sigma confidence level. If does indeed correspond to a g-mode, there will be eight detected pulsation modes in V400 Car. The appearance of the periodogram, after prewhitening with 9 and 13 frequencies respectively, is displayed in Figures 4 and 5.
3 Significances of periodicities in V401 Car
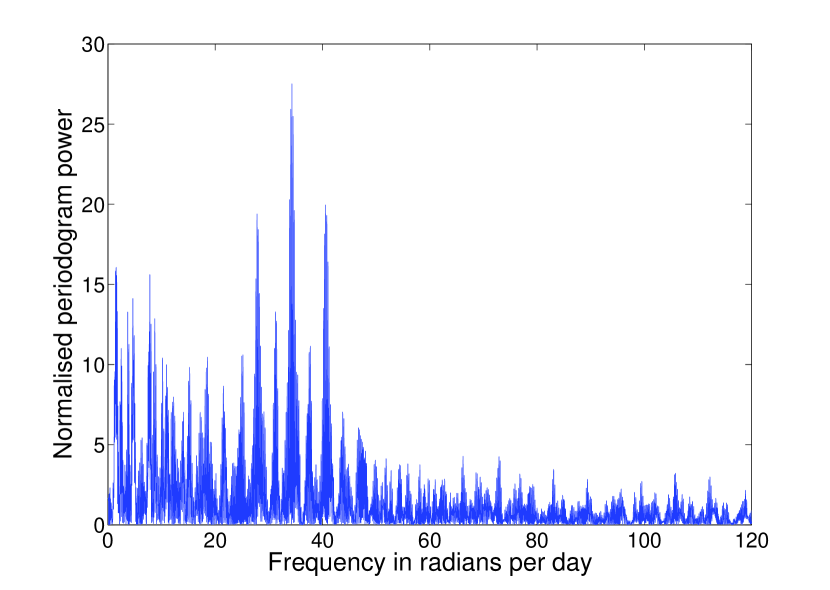
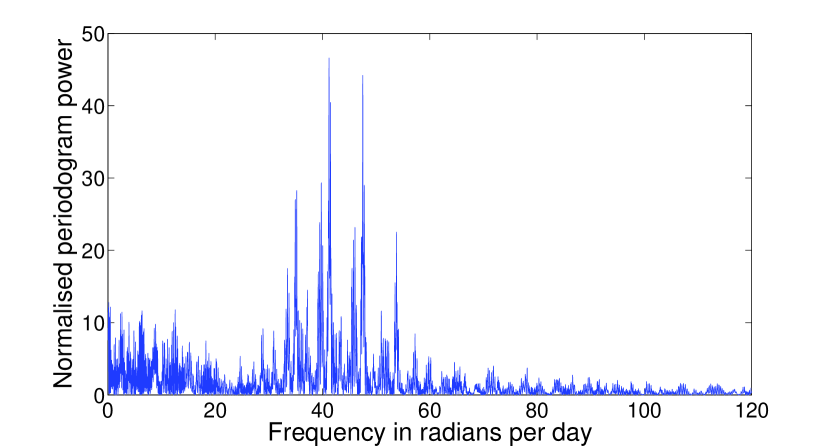
The data set consists of 481 observations of V401 Car (star no. 10 in the Feast (1958) and Turner et al. (1980) designation for NGC3293) in the Johnson B band, obtained with the 1.0 m telescope at the Sutherland station of the SAAO during a total timespan of 65 days in 1984. The Lomb-Scargle periodogram of the data, normalised by the variance of the data, is shown in Figure 6.
The periodogram was over-sampled by a factor of approximately 25. The limiting empirical CDF computed for the time data is very similar to the CDF for V400 Car, shown in Figure 2. An enlargement of the critical region of the CDF for V401 Car is shown in Figure 7.
The horizontal solid lines have the same meaning as in Figure 3. The power levels corresponding to the three specified significance thresholds are displayed in Table 3, in the same fashion as Table 1.
| Significance | Periodogram Power Level | ||
|---|---|---|---|
| empirical | exponential function | beta function | |
| 95 % | 9.65 | 9.57 | 9.53 |
| 99 % | 11.48 | 11.20 | 11.09 |
| 99.7 % | 12.63 | 12.41 | 12.24 |
The significances of peaks appearing in the periodogram of V401 Car were again estimated by using the exponential function providing the best fit to the tail of the associated empirical CDF. The oversampled, normalised Lomb-Scargle periodogram shown in Figure 6 was subjected to the prewhitening procedure described in the previous section. The three observing blocks in the 65-day observing season were zeroed to a common mean. A full list of the results of the prewhitening procedure for V401 Car appears in Table 4.
| Number | Rad | Cycles | Amp (mmag) | Power | Significance |
|---|---|---|---|---|---|
| 37.22 | 5.92 | 9.9 | 87.1 | % | |
| 35.69 | 5.68 | 6.8 | 63.2 | % | |
| 29.89 | 4.76 | 4.7 | 36.8 | % | |
| 32.07 | 5.10 | 3.9 | 34.2 | % | |
| 12.59 | 2.00 | 3.1 | 23.5 | % | |
| 0.87 | 0.14 | 2.8 | 26.6 | % | |
| 34.30 | 5.46 | 3.0 | 27.5 | % | |
| 1.52 | 0.24 | 2.3 | 17.0 | % | |
| 3.70 | 0.59 | 2.3 | 14.0 | % | |
| 31.45 | 5.01 | 2.1 | 14.7 | % | |
| 24.21 | 3.85 | 2.0 | 13.6 | % | |
| 1.14 | 0.18 | 1.7 | 11.7 | % | |
| 41.46 | 6.60 | 1.6 | 11.2 | % |
For convenience, each frequency is listed in units of radians per day and of cycles per day, along with its best-fit amplitude in millimagnitudes, its respective normalised power in the periodogram, and the associated significance of the normalised power level, as determined from the fitting of the exponential distribution function to the tail of the empirical CDF.
As pointed out in the previous section on V400 Car, the day-to-day and week-to-week spacings in the observations of V401 Car generate substantial peaks in the low-frequency part of the periodogram. Once the strongest four peaks (determined through the prewhitening procedure outlined above) have been removed, the next two strongest periodicities in the data are a half-day period and a seven-day period respectively. These are listed as frequencies and , but are probably artifacts due to the data spacing rather than real signals present in the varying luminosity of V401 Car. However, might also be associated with a low-order g-mode, as explained in the previous section. Frequencies and (corresponding to periods of 4 days and 1.6 days respectively) are also likely to be artifacts due to the data spacing. However, since the maximum possible rotation period of this star is roughly 3 days (based on spectral line broadening measurements by Balona (1975) and radius calculations by Engelbrecht (1986)), either or might be related to the rotation period of V401 Car. Aside from , and , we are left with eight frequencies above a significance level of 99.7% that could be interpreted as periodicities related to pulsation modes in V401 Car. Whereas the first six of these frequencies have significances beyond the 4-sigma level (99.993%), the remaining two (5.01 and 3.85 cycles per day respectively) are sufficiently significant that they might also be taken into account in attempts to perform asteroseismology on V401 Car. Frequency lies well below the 3-sigma level at a significance of 98.9%, but its value of 6.60 cycles per day places it well inside the expected range of excited pulsation frequencies. More intensive observation of V401 Car might confirm this as another excited mode. The appearance of the periodogram after prewhitening with 6 and 11 frequencies respectively, is displayed in Figures 8 and 9.
4 Significances of periodicities in V403 Car
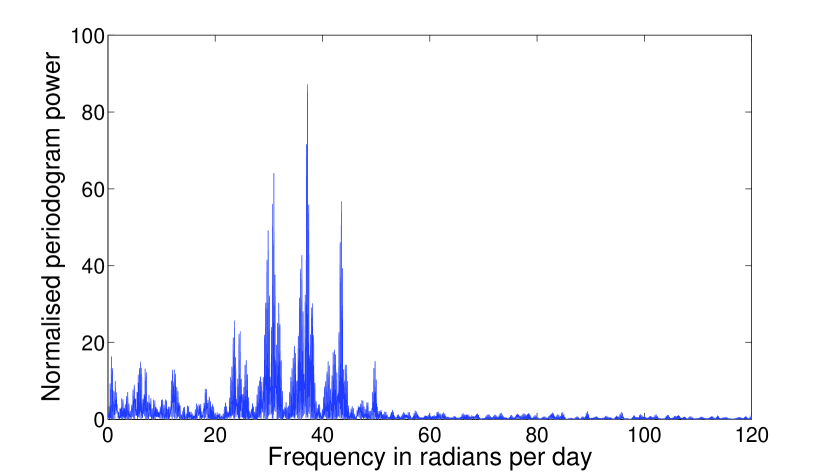
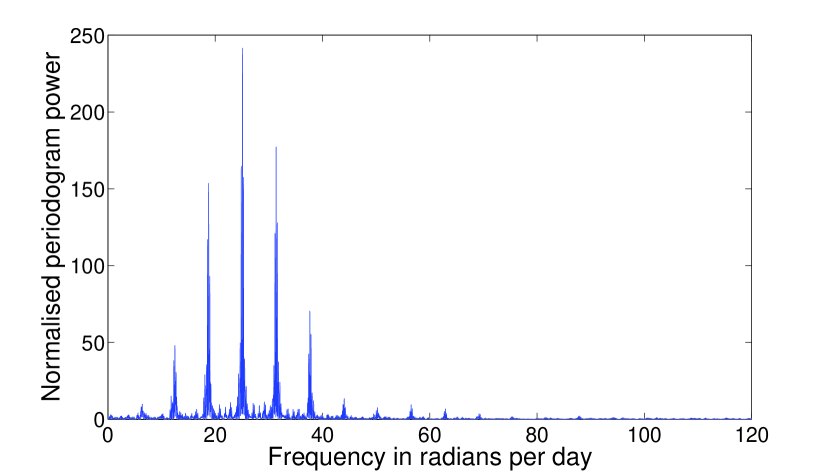
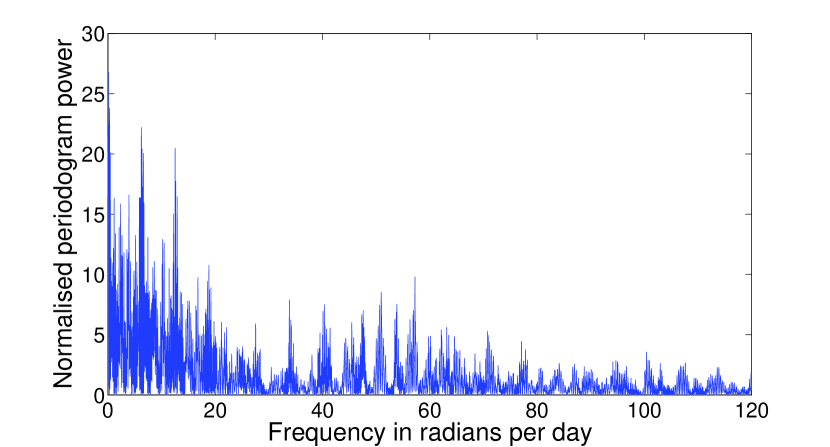
The data set consists of 530 observations of V403 Car (star no. 16 in the Feast (1958) and Turner et al. (1980) designation for NGC3293) in the Johnson B band, obtained with the 1.0 m telescope at the Sutherland station of the SAAO during a total timespan of 68 days in 1984. The Lomb-Scargle periodogram of the data, normalised by the variance of the data, is shown in Figure 10.
The periodogram was over-sampled by a factor of approximately 25. The limiting empirical CDF computed for the time data is very similar to that of V400 Car shown in Figure 2. An enlargement of the critical region of the CDF for V403 Car is shown in Figure 11.
Horizontal solid lines are indicated in the same fashion as was done in Figure 3. The power levels corresponding to the three specified significance thresholds are displayed in Table 5.
| Significance | Periodogram Power Level | ||
|---|---|---|---|
| empirical | exponential function | beta function | |
| 95 % | 9.60 | 9.61 | 9.58 |
| 99 % | 11.27 | 11.24 | 11.14 |
| 99.7 % | 12.37 | 12.45 | 12.30 |
The slight differences between these significances and those appearing in Frescura et al. (2008) arise from the larger number of Monte Carlo trials that produced Figure 11 shown here, compared to the number of trials applied in that paper.
The significances of peaks appearing in the periodogram of V403 Car were again estimated by using the exponential function providing the best fit to the tail of the associated empirical CDF. The oversampled, normalised Lomb-Scargle periodogram shown in Figure 10 was subjected to the prewhitening procedure described previously in this paper. The three observing blocks in the 68-day observing season were zeroed to a common mean. A full list of the results of the prewhitening procedure for V403 Car appears in Table 6.
| Number | Rad | Cycles | Amp (mmag) | Power | Significance |
|---|---|---|---|---|---|
| 25.07 | 3.99 | 26.7 | 241.6 | % | |
| 2.57 | 0.41 | 2.9 | 31.1 | % | |
| 1.37 | 0.22 | 2.5 | 29.6 | % | |
| 30.94 | 4.92 | 2.6 | 28.2 | % | |
| 0.86 | 0.14 | 1.8 | 21.6 | % | |
| 25.74 | 4.10 | 2.0 | 20.4 | % | |
| 8.92 | 1.42 | 1.7 | 16.6 | % | |
| 28.91 | 4.60 | 1.5 | 13.1 | % | |
| 12.32 | 1.96 | 1.2 | 10.1 | % | |
| 23.45 | 3.73 | 1.1 | 10.1 | % |
For convenience, each frequency is listed in units of radians per day and of cycles per day, along with its best-fit amplitude in millimagnitudes, its respective normalised power in the periodogram, and the associated significance of the normalised power level, as determined from the fitting of the exponential distribution function to the tail of the empirical CDF. The slight difference between these results and those appearing in Frescura et al. (2008) are due to an offset of 0.009 mag in the mean of the third block of data for this star (compared to the remainder of the data). This offset was not corrected in the analysis appearing in Frescura et al. (2008).
As pointed out in the previous two sections, the day-to-day and week-to-week spacings in the observations of V403 Car generate substantial peaks in the low-frequency part of the periodogram. Frequencies , and correspond to periods of approximately 2.5 days, 4.5 days and 7 days respectively and are probably artifacts due to the data spacing, rather than real signals present in the varying luminosity of V403 Car. Given that the maximum rotation period of this star is roughly 10 days (based on spectral line broadening measurements by Balona (1975) and radius calculations by Engelbrecht (1986)), any one of these three periodicities might be related to the rotation period of V403 Car. Aside from , , and , we are left with four frequencies above a significance level of 99.7% that could be interpreted as periodicities related to pulsation modes in V403 Car and might be taken into account in attempts to perform asteroseismology on this star. Frequencies and lie below the 3-sigma level at a significance of 97.0%, but their values of 1.96 cycles per day and 3.73 cycles per day place them inside the expected range of excited pulsation frequencies for low-order g-modes and p-modes respectively. More intensive observation of V403 Car might confirm them as excited modes. The appearance of the periodogram after prewhitening with 3 and 8 frequencies respectively, is displayed in Figures 12 and 13.
5 Significances of periodicities in V405 Car
The data set consists of 357 observations of V405 Car (star no. 14 in the Feast (1958) and Turner et al. (1980) designation for NGC3293) in the Johnson B band, obtained with the 0.5 m, 0.75 m and 1.0 m telescopes at the SAAO during a total timespan of 70 days in 1983. The Lomb-Scargle periodogram of the data, normalised by the variance of the data, is shown in Figure 14.
The periodogram was over-sampled by a factor of approximately 25. The limiting empirical CDF computed for the time data is very similar to that of V400 Car shown in Figure 2. An enlargement of the critical region of the CDF for V405 Car is shown in Figure 15.
Horizontal solid lines are indicated in the same fashion as was done in Figure 3. The power levels corresponding to the three specified significance thresholds are displayed in Table 7.
| Significance | Periodogram Power Level | ||
|---|---|---|---|
| empirical | exponential function | beta function | |
| 95 % | 9.49 | 9.51 | 9.46 |
| 99 % | 11.02 | 11.14 | 10.99 |
| 99.7 % | 12.11 | 12.34 | 12.12 |
The significances of peaks appearing in the periodogram of V405 Car were again estimated by using the exponential function providing the best fit to the tail of the associated empirical CDF. The oversampled, normalised Lomb-Scargle periodogram shown in Figure 14 was subjected to the prewhitening procedure described previously in this paper. The three observing blocks in the 70-day observing season were zeroed to a common mean. A full list of the results of the prewhitening procedure for V405 Car appears in Table 8.
| Number | Rad | Cycles | Amp (mmag) | Power | Significance |
|---|---|---|---|---|---|
| 41.22 | 6.56 | 5.0 | 46.6 | % | |
| 39.76 | 6.33 | 3.6 | 31.7 | % | |
| 37.09 | 5.90 | 2.8 | 22.8 | % | |
| 0.16 | 0.03 | 3.7 | 26.8 | % | |
| 2.36 | 0.38 | 2.3 | 19.1 | 99.9997 % | |
| 50.94 | 8.11 | 1.8 | 14.3 | 99.958 % |
For convenience, each frequency is listed in units of radians per day and of cycles per day, along with its best-fit amplitude, its respective normalised power in the periodogram, and the associated significance of that power level, as determined from the fitting of the exponential distribution function to the tail of the empirical CDF.
The appearance of the periodogram after prewhitening with 3 and 6 frequencies respectively, is displayed in Figures 16 and 17.
As pointed out in the previous sections, the day-to-day and week-to-week spacings in the observations of V405 Car generate substantial peaks in the low-frequency part of the periodogram. Frequencies and correspond to periods of approximately 40 days and 3 days respectively and are probably artifacts due to the data spacing rather than to real signals present in the varying luminosity of V405 Car, although might be associated with the rotation period of V405 Car, which has an upper limit of roughly 3 days (based on spectral line broadening measurements by Balona (1975) and radius calculations by Engelbrecht (1986)). Apart from and , we are left with four frequencies above a significance level of 99.7% that might be interpreted as periodicities related to pulsation modes in V405 Car and which could be taken into account in attempts to perform asteroseismology on this star. Frequency has not been reported in the literature before.
6 Discussion
We have used the significance test described in Frescura et al. (2008) to identify six previously unreported periodicities which might correspond to pulsation modes in the Beta Cephei stars V400 Car, V401 Car, V403 Car and V405 Car. The new identifications are listed in Table 9.
| Star | Frequency in Rad | Frequency in Cycles | Amplitude (mmag) |
|---|---|---|---|
| V400 Car | 53.48 | 8.51 | 1.1 |
| V401 Car | 12.59 | 2.00 | 3.1 |
| V401 Car | 31.45 | 5.01 | 2.1 |
| V401 Car | 24.21 | 3.85 | 2.0 |
| V403 Car | 28.91 | 4.60 | 1.5 |
| V405 Car | 50.94 | 8.11 | 1.8 |
The periodograms shown in Figures 1, 6, 10 and 14 all appear to display a rising background noise level below frequencies of about 20 radians per day. This may seem to imply that our data contains what is traditionally described as “red noise”. However, after removal of all significant low frequency components in the prewhitening procedure, the periodograms display a behaviour that is more typical of “white noise” (not shown above). We take this to be an indication that the apparent redness of the original data is an artefact of the presence of a few strong low frequency components rather than a dense noise spectrum, and that the correct noise model to use in the corresponding Monte Carlo simulations is that of white rather than red noise. In any event, our principal interest is in potential pulsation modes, and the data clearly display “flat” noise levels in the frequency ranges predicted for low-order p-modes. Thus the significances listed in Tables 2, 4, 6 and 8 (at least for the p-modes) are very unlikely to be far off the values that would be obtained with a more refined noise model for the Monte Carlo simulations.
We conclude by stating that our data allow a 3-sigma detection of seven probable pulsation modes in V400 Car, another eight in V401 Car, four modes in V403 Car and four modes in V405 Car. One of these modes, in V401 Car, is associated with a frequency value that lies in the expected range of eigenfrequencies of low-order g-modes. This corresponds with suggestions made by Heynderickx et al. (1994) and with the results of model calculations by Dziembowski & Pamyatnykh (1993) and Pamyatnykh (1999, 2003) respectively. Further low-amplitude modes in these stars might well remain to be discovered amongst the noise levels present in our data. The open cluster NGC3293 continues to present itself as a rich source of data with which models of Beta Cephei pulsation may be tested. Continued, intensive observation of the Beta Cephei stars in this cluster appears imperative.
References
- Balona (1975) Balona, L. A., 1975, Mem. Roy. Astr. Soc., 78, 51
- Breger et al. (1993) Breger, M., et al., 1993, A& A, 271, 482
- Dziembowski & Pamyatnykh (1993) Dziembowski, W.A., Pamyatnykh, A.A., 1993, in ”Inside the Stars”, Proc. IAU Coll. 137., Eds. Weiss, W.W., Baglin, A., ASP Conf. Ser., vol. 40, p.721
- Engelbrecht (1986) Engelbrecht, C. A., 1986, MNRAS, 223, 189
- Feast (1958) Feast, M. W., 1958, MNRAS, 118, 618
- Frescura et al. (2008) Frescura, F.A.M., Engelbrecht, C. A., Frank, B.S., 2008, MNRAS, 388, 1693
- Heynderickx et al. (1994) Heynderickx, D., Waelkens, C., Smeyers, P., 1994, A&A Suppl. Ser. 105, 447
- Horne & Baliunas (1986) Horne, J. H., Baliunas, S. L., 1986, ApJ, 302, 757
- Kuschnig et al. (1997) Kuschnig, R., Weiss, W.W., Gruber, R., Bely, P.Y., Jenkner, H., 1997, A& A, 328, 544
- Pamyatnykh (1999) Pamyatnykh, A.A., 1999, Acta Astron., 49, 119
- Pamyatnykh (2003) Pamyatnykh, A.A., 2003, Astrophys. Space Sci., 284, 97
- Pamyatnykh & Ziomek (2007) Pamyatnykh, A.A., Ziomek, W., 2007, ComAst 150, 207
- Miglio et al. (2007) Miglio, A. Montalbán, J., Dupret, M.-A., 2007, ComAst 151, 48
- Smolec & Moskalik (2007) Smolec, R. and Moskalik, P., 2007, MNRAS 377, 645
- Turner et al. (1980) Turner, D. G., Grieve, G. R., Herbst, W., Harris, W. E., 1980, AJ, 85, 1193