Extraction of the Pomeron Trajectory from a Global Fit to Exclusive Meson Photoproduction Data
Abstract
Based on data on elastic photoproduction from the H1, Omega and ZEUS collaborations, a fit has been performed to extract the value of the pomeron trajectory at fixed values of from the dependence of the differential cross section . The data used in the fit cover the range of in centre-of-mass energy and in momentum transfer.
A linear fit to the resulting values of yields for the intercept and for the slope of the pomeron trajectory. The data are also compatible with the Donnachie-Landshoff trajectory at low values and with a constant value of at larger values of .
1 Introduction
The exclusive photoproduction of mesons has been studied in great detail over the last 40 years; this process shows the typical characteristics of a soft diffractive reaction, i.e. a weak increase of the cross section with the photon-proton centre-of-mass energy and an exponential decrease as function of the modulus of the squared momentum transfer .
At sufficiently high centre-of-mass energies , elastic hadron-hadron scattering is well described by the exchange of a single Regge trajectory, the Pomeron, while at lower values of the exchange of additional meson trajectories becomes important. In this high region, the energy dependence of elastic photoproduction at fixed momentum transfer is in diffractive models directly linked to the Pomeron trajectory by
Thus, a measurement of the dependence of elastic photoproduction in bins of determines the Pomeron trajectory , which is often approximated by a linear function .
In the present analysis [1, 2], we combine in a global fit the new H1 measurements [3] with earlier measurements of the H1 [4], Omega [5] and the ZEUS collaborations [6, 7, 8] in order to achieve the best possible accuracy for the determination of the Pomeron trajectory. By including data from other experiments, we can improve the accuracy compared to a fit to the H1 data alone, which was performed earlier [3]. Such a combination was first performed by the ZEUS collaboration [8].
2 Input data sets
2.1 The Omega data set
In 1982, the Omega collaboration published [5] measurements of elastic photoproduction at a tagged photon beam at CERN. The measurements were performed in the kinematic range in three bins of photon energy , corresponding to centre-of-mass energies of , , and , respectively. The measurements were restricted to the di-pion mass range .
Differential cross sections were measured in bins of . Unfortunately, no table of the original cross sections with their errors was published, only the result of the fits. In order to include the data into the fit, the original event numbers were extracted from Figure 3 of the paper. The fit of the dependence given in the paper was repeated, with identical results; however, the statistical errors had to be increased by a factor of in order to obtain reasonable values of these fits.
The factor between number of events and the differential cross section per bin was determined from the published -integrated cross sections, such that the integral of the fitted differential cross section in the range reproduces the published integrated cross section as obtained from a fit using the Ross-Stodolsky line shape [9].
An additional correction factor of was applied in order to correct the cross section to the full di-pion mass range of , which is the cross section definition adopted in this analysis. The error is due to a variation of the skewing parameter in the region , and is treated as an uncorrelated systematic error.
Finally, the data points were grouped according to the binning used for the global fit, corrected to the bin centre in according to the dependence given by the Omega collaboration, and averaged.
A global normalization error, which is assumed to be fully correlated for all data points in a given photon energy interval, is derived from the uncertainty of the integrated cross section as given by the Omega collaboration.
2.2 The H1 data sets
The H1 HERA-1 measurement
The H1 Collaboration has measured elastic photoproduction [4] for at a mean using data taken in 1993. Of the systematic errors listed in Tab. 4 of the paper, the errors from the track fit efficiency, resonance extraction and luminosity as well as half of the error from the trigger efficiency were taken as normalization uncertainty of , while the rest of the errors are treated as uncorrelated, amounting to .
The data points were corrected for the slope according to the measured dependence and averaged where appropriate, treating the systematic error of the averaged data points as fully correlated.
The preliminary H1 HERA-2 measurement
Based on data taken in 2005, the H1 collaboration has released preliminary data [3], covering the range of and for the measurement of the elastic cross section; 60 cross section values have been measured in eight bins of , with ten bins in for and five at larger values of . Ten sources of correlated errors, as described in [3], are taken into account. The normalization uncertainty of this data set amounts to .
These data are sufficient to determine with high accuracy for .
2.3 The ZEUS data sets
The ZEUS LPS measurement
The ZEUS collaboration has used their Leading Proton Spectrometer (LPS) in a measurement of elastic photoproduction [6] using data taken in 1994. Four data points with values in the range were published. The measurement covered a range in photon-proton centre-of-mass energy of , with a mean .
From the list of systematic uncertainties published, we treat the errors from the luminosity, sensitivity to the proton beam angle, cross section extraction, radiative corrections and background from and production as fully correlated, corresponding to an overall normalization error of ; the rest of the errors is treated as an uncorrelated error of .
The published differential cross section values were corrected to the nearest bin centre according to the -dependence observed by ZEUS. The error from this swimming of the data points was evaluated and is treated as a correlated systematic error.
The data points were also corrected from the mass range used in the publication to the full mass range as described above; the correction factor amounts to . Since the published data are already corrected for skewing effects, no additional uncertainty arises here.
The ZEUS low- measurement
Using data taken from the year 1994, the ZEUS collaboration has performed a measurement of elastic photoproduction [7] in the region and , at a mean value of . Differential cross sections were measured in twelve bins.
We have averaged the first three bins and the fourth and fifth bin and corrected the measurements to the binning chosen for this global fit, using the published dependence.
The systematic errors from the luminosity measurement, the cross section extraction and the radiative corrections were assumed to be correlated, resulting in a normalization uncertainty, the rest of the systematic errors are treated as uncorrelated and amount to .
The ZEUS high- measurement
Based on a data set taken in 1995, the ZEUS collaboration has performed a third measurement of elastic photoproduction [8], covering the range .
The seven data points in the range were transferred to the common bin centres of this global analysis if neccessary, using the published dependence.
A global normalization uncertainty of and the published values for the other systematic errors were taken into account; the uncertainty arising from the subtraction of proton dissociation background was considered as a correlated error.
3 Fit Procedure
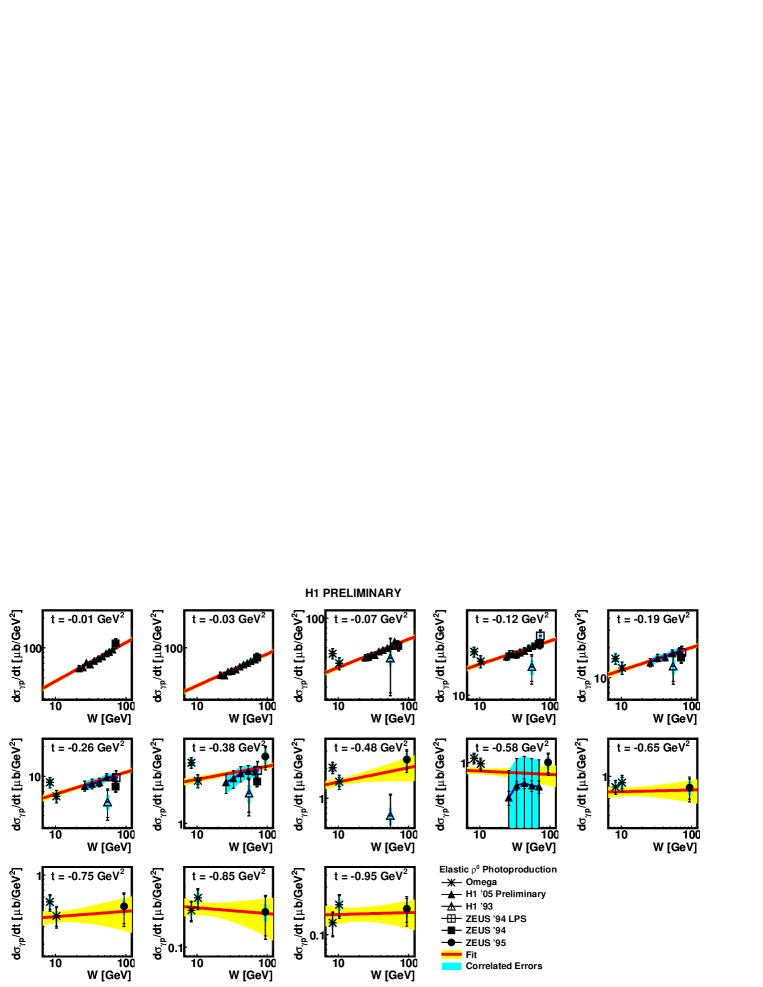
The differential cross sections measured at a particular value of are fitted to a function
| (1) |
with . The parameter is, for elastic production, the value of the pomeron trajectory , and is the differential cross section at the respective value of .
The fit minimizes a expression that takes into account correlated systematic errors and is similar to the method employed in the averaging of inclusive data [10].
Altogether parameters are determined, corresponding to the normalization and the exponent in each of the bins, plus coefficients for the correlated error sources.
It is important to note that the global fit is not based on any assumption about the dependence, i.e. the form factor, of the cross section, but that for each bin the normalization and the exponent are determined individually.
However, because the fit includes all data points together, correlated error sources lead to correlations between the resulting fit parameters across different bins.
Correlated and uncorrelated errors are fully propagated in this fit, so that the full covariance matrix is obtained for the resulting values .
Using the values obtained from the fit to the data and their covariance matrix, it is possible to perform a straight line fit to obtain the intercept and slope of the pomeron trajectory. The of this fit may serve as an indication whether such a straight line is able to describe the data in a satisfactory way.
4 Results
Fig. 1 shows the result of the global fit in all 13 bins. The overall quality of the fit is satisfactory, with a for degrees of freedom (106 data points enter the fit, and 26 free parameters are determined).
All data sets contribute a reasonable amount to the total . However, it is clearly visible that the Omega data at lie systematically above the fit for , which leads to a best value for the normalization of this data set that is significantly shifted; the shift is, however, less than standard deviations.
Since correlated uncertainties, in particular the normalizations, of all data sets are treated consistently across the whole range, the high precision of the H1 data from 2005 at low constrains the normalization of all data sets, which reduces the uncertainty from the correlated errors also at larger values of .
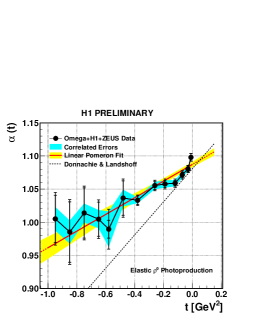
Fig. 2 shows the fitted values as a function of . The values are in excellent agreement with the values obtained from the H1 data alone [3] and with those obtained by the ZEUS collaboration from a combined fit to the Omega, ZEUS, and ’93 H1 data [8].
However, while the values obtained by ZEUS are in perfect agreement with a linear pomeron trajectory of the form , which has a significantly shallower slope than the canonical value [12] for the soft pomeron, the new, more precise result shows that at low values of the data are in very good agreement with a slope of . At larger values , a significant difference between the data and the Donnachie-Landshoff soft pomeron trajectory is found; the data are even compatible with a constant value of in this region.
These observations are in broad agreement with the indications from UA8 data [13] that the pomeron trajectory flattens at large . It is interesting to note that also models based on gauge–string duality [14] predict such a behaviour.
A straight line fit to the observed values yields for the Pomeron trajectory
with a correlation coefficient of between and . This result is in excellent agreement with the measurement from the ZEUS collaboration [8] and the measurement using H1 data alone [3] The linear fit has a reasonable overall , therefore the hypothesis of a linear pomeron trajectory in the range cannot be excluded.
References
-
[1]
Slides:
http://indico.cern.ch/contributionDisplay.py?contribId=161&sessionId=18&confId=53294 -
[2]
H1 Collaboration,
H1prelim-09-016 (2009),
http://www-h1.desy.de/h1/www/publications/htmlsplit/H1prelim-09-016.long.html -
[3]
H1 Collaboration,
H1prelim-06-011 (2006),
http://www-h1.desy.de/publications/htmlsplit/H1prelim-06-011.long.html
R. M. Weber, “Diffractive -photoproduction at H1,” PhD thesis ETH Zurich 2006, DISS-ETH-16709. - [4] S. Aid et al. [H1 Collaboration], Nucl. Phys. B463 3 (1996).
- [5] D. Aston et al., Nucl. Phys. B209 56 (1982).
- [6] M. Derrick et al. [ZEUS Collaboration], Z. Phys. C73 253 (1997).
- [7] J. Breitweg et al. [ZEUS Collaboration], Eur. Phys. J. C2 247 (1998).
- [8] J. Breitweg et al. [ZEUS Collaboration], Eur. Phys. J. C14 213 (2000).
- [9] M. Ross and L. Stodolsky, Phys. Rev. 149 1172 (1966).
- [10] F. D. Aaron et al. [H1 Collaboration], arXiv:0904.0929 [hep-ex] (2009).
- [11] A. Donnachie and P. V. Landshoff, Phys. Lett. B296 227 (1992).
-
[12]
G. A. Jaroszkiewicz and P. V. Landshoff,
Phys. Rev. D10 170 (1974);
P. V. Landshoff, Nucl. Phys. Proc. Suppl. 12 397 (1990). -
[13]
A. Brandt et al. [UA8 Collaboration],
Nucl. Phys. B514 3 (1998);
S. Erhan and P. E. Schlein, Phys. Lett. B481 177 (2000). - [14] R. C. Brower, J. Polchinski, M. J. Strassler and C. I. Tan, JHEP 0712 005 (2007).
