Spontaneous formation of a superconducting and antiferromagnetic hybrid state in SrFe2As2 under high pressure
Abstract
We report a novel superconducting (SC) and antiferromagnetic (AF) hybrid state in SrFe2As2 revealed by 75As nuclear magnetic resonance (NMR) experiments on a single crystal under highly hydrostatic pressure up to 7 GPa. The NMR spectra at 5.4 GPa indicate simultaneous development of the SC and AF orders below 30 K. The nuclear spin-lattice relaxation rate in the SC domains shows a substantial residual density of states, suggesting proximity effects due to spontaneous formation of a nano-scale SC/AF hybrid structure. This entangled behavior is a remarkable example of a self-organized heterogeneous structure in a clean system.
pacs:
74.70.Dd, 74.62.Fj, 76.60.-k, 64.75.YzCompetition between magnetism and superconductivity is ubiquitous in unconventional superconductors such as cuprates and heavy fermionsUemura (2009), as is the case for iron pnictidesUemura (2009); Ishida et al. (2009). Precise determination of the phase diagram, in particular whether the antiferromagnetic (AF) and the superconducting (SC) phases mutually exclude or coexist, is often hampered by compositional and structural inhomogeneity, which are inevitable when the SC state is induced by carrier dopingPark et al. (2009); Pratt et al. (2009).
While this is the case for cuprates, there is another route to the SC state in iron pnictides. SrFe2As2 shows a phase transition from the tetragonal paramagnetic (PM) state into the orthorhombic AF state below 200 K at ambient pressureKaneko et al. (2008); Kitagawa et al. (2009). It is reported to become SC not only by chemical substitutionSasmal et al. (2008); Leithe-Jasper et al. (2008) to change carrier concentration but also by applying sufficiently high pressure to suppress the AF stateAlireza et al. (2009); Kotegawa et al. (2009a); Matsubayashi et al. (2009). The pressure-induced SC state provides an opportunity to unravel intrinsic behavior caused by interplay between the AF and SC order unaffected by disorder. This motivated us to perform high-pressure NMR spectroscopy, a powerful tool to examine coexistence of the SC and AF states.
We developed a new type of opposed-anvil pressure cellKitagawa et al. , which enables NMR experiments in quasi-hydrostatic pressure up to 9.4 GPa by using argon as the pressure transmitting mediumTateiwa and Haga . The cell was mounted on a geared double-axis goniometer allowing precise sample alignment within one degree. The single crystals of SrFe2As2 were prepared by self-flux method. A small piece ( mm3) was cut from the sample used in the study at ambient pressureKitagawa et al. (2009). NMR signals from Sn and Pt foil were used to determine pressures in situKitagawa et al. .
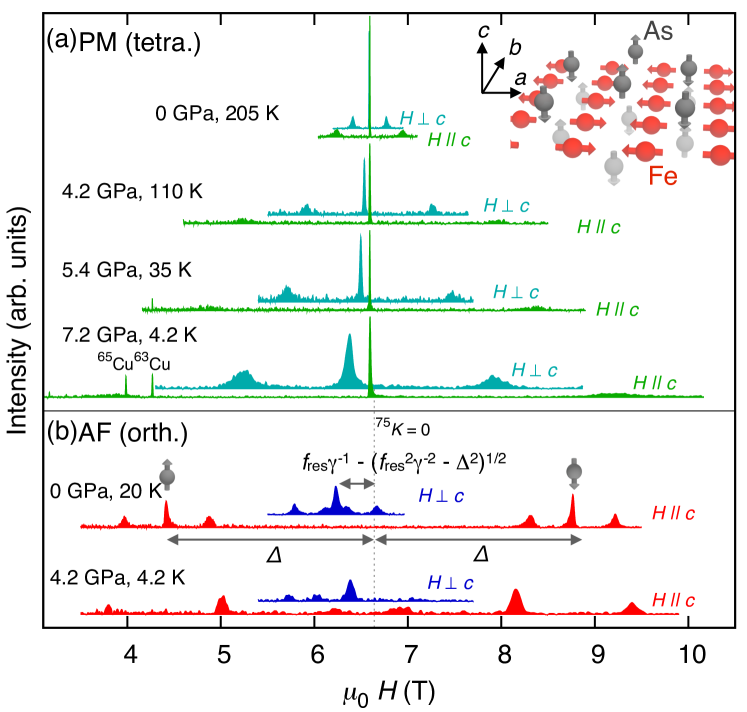
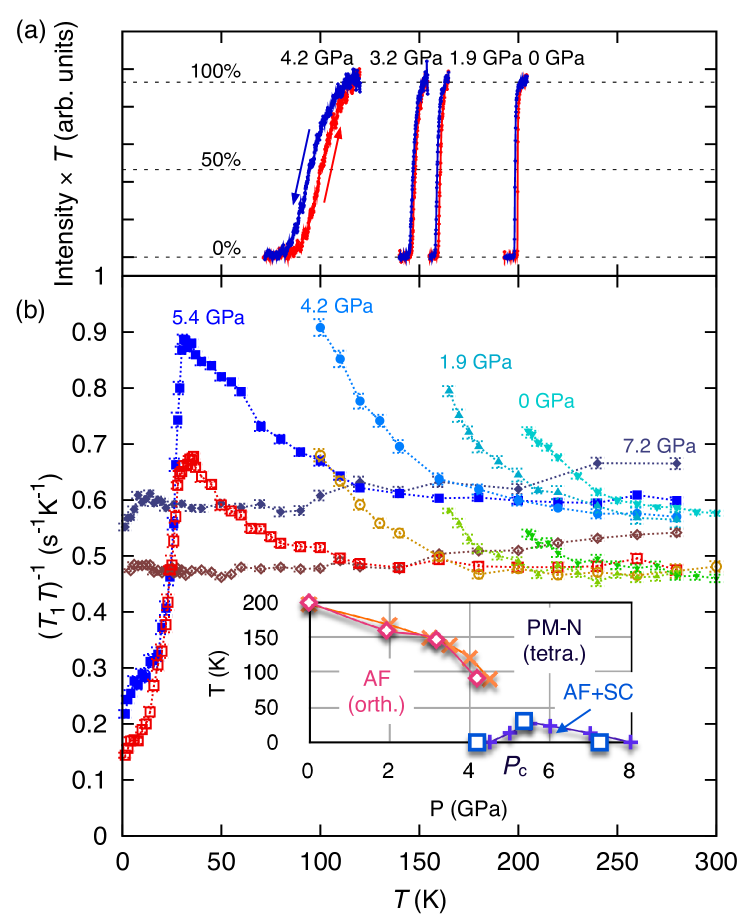
Figure 1 shows the 75As-NMR spectra in the PM and AF states at various . The quadrupole interaction splits the resonance of 75As nuclei with spin into three lines corresponding to the transitions at the frequencies , where MHz/T is the gyromagnetic ratio, is the hyperfine field from the Fe spins, and is proportional to the electric field gradient along the field direction. In the PM state, is uniquely given and proportional to the external field, , where is the Knight shift along the direction. In the AF state the spectra for split symmetrically into two sets of three lines. However, the central line for does not split, indicating that the hyperfine fields are parallel to the -axis, . This is compatible with the commensurate stripe AF structure with and the AF moments parallel to the -axis as previously reportedKitagawa et al. (2009, 2008). Our results prove that the ground state below 4.2 GPa has the stripe-type AF order with the orthorhombic structure.
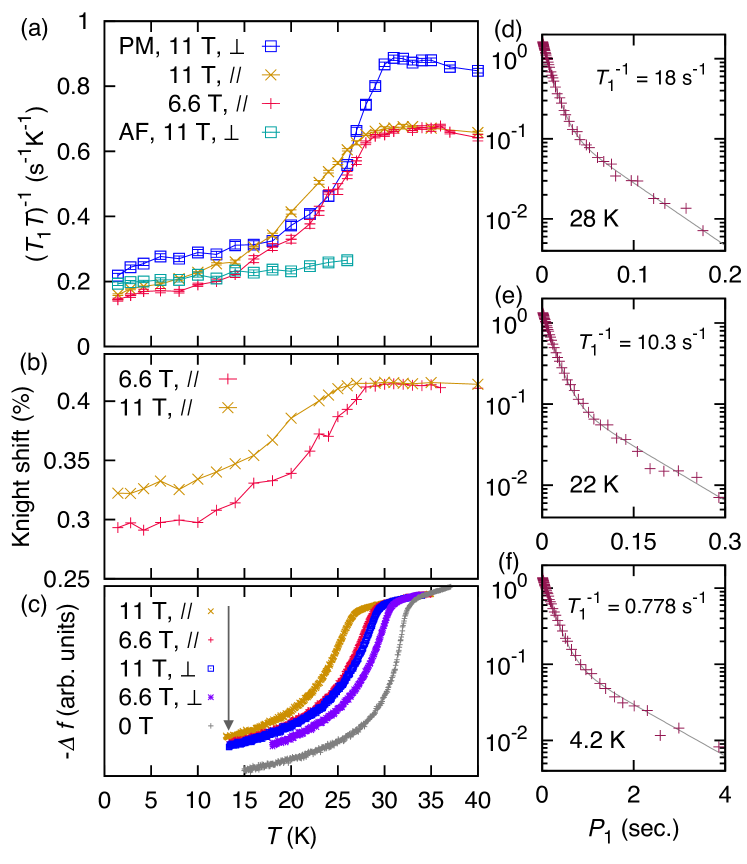
The AF transition temperature can be determined from the vanishing of the PM spectral intensity [Fig. 2(a)]. The hysteresis provides clear evidence for a first-order transition. Below 4.2 GPa, no fraction of the PM state remains at low . Figure 2(b) shows -dependence of the nuclear spin-lattice relaxation rate divided by . shows an upturn as approaches below 4.2 GPa, indicating development of AF spin fluctuations in the PM state even though the transition is first-order. At 5.4 GPa, an increase of is also observed above 30 K, followed by a sudden decrease at lower . As we discuss later, the PM spectrum does not vanish at low at 5.4 GPa and there is sufficient evidence for a bulk SC state. The reduction of is then a consequence of opening of the energy gap in the SC state. When is increased to 7.2 GPa, is nearly independent of , exhibiting neither an SC transition nor development of AF fluctuations.
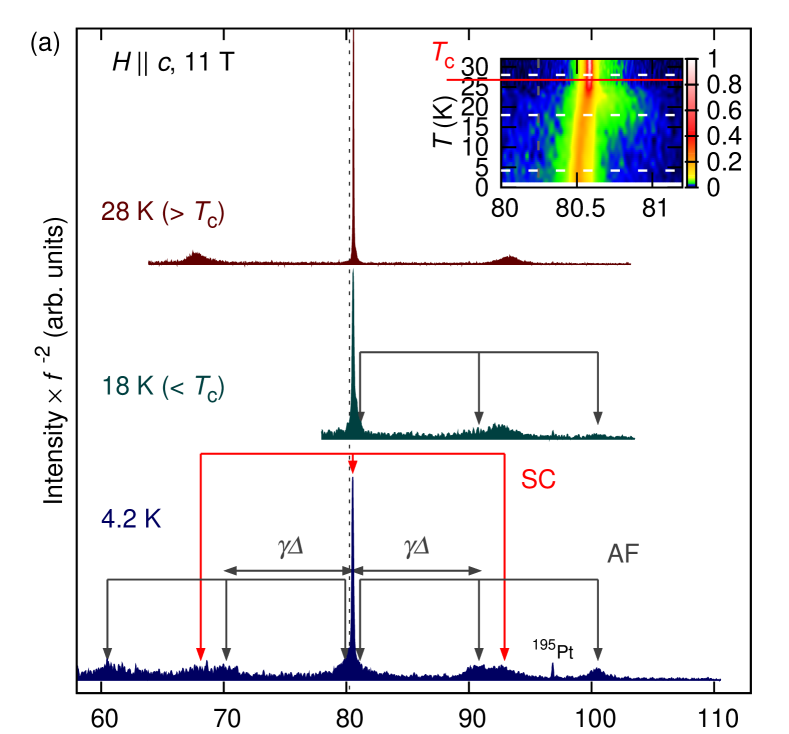
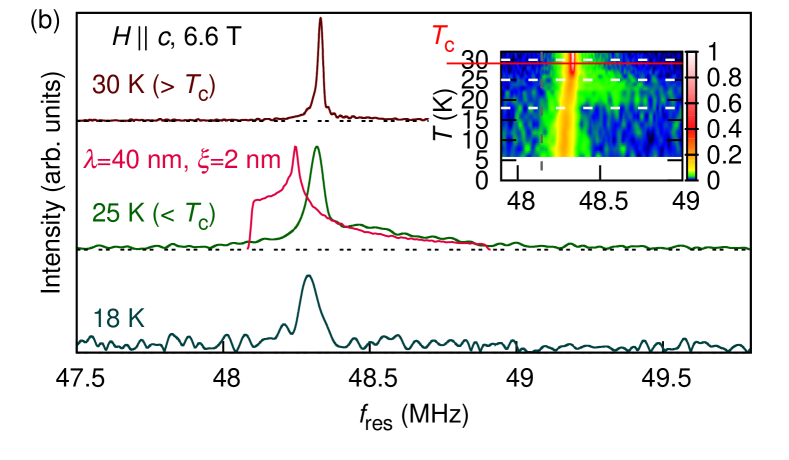
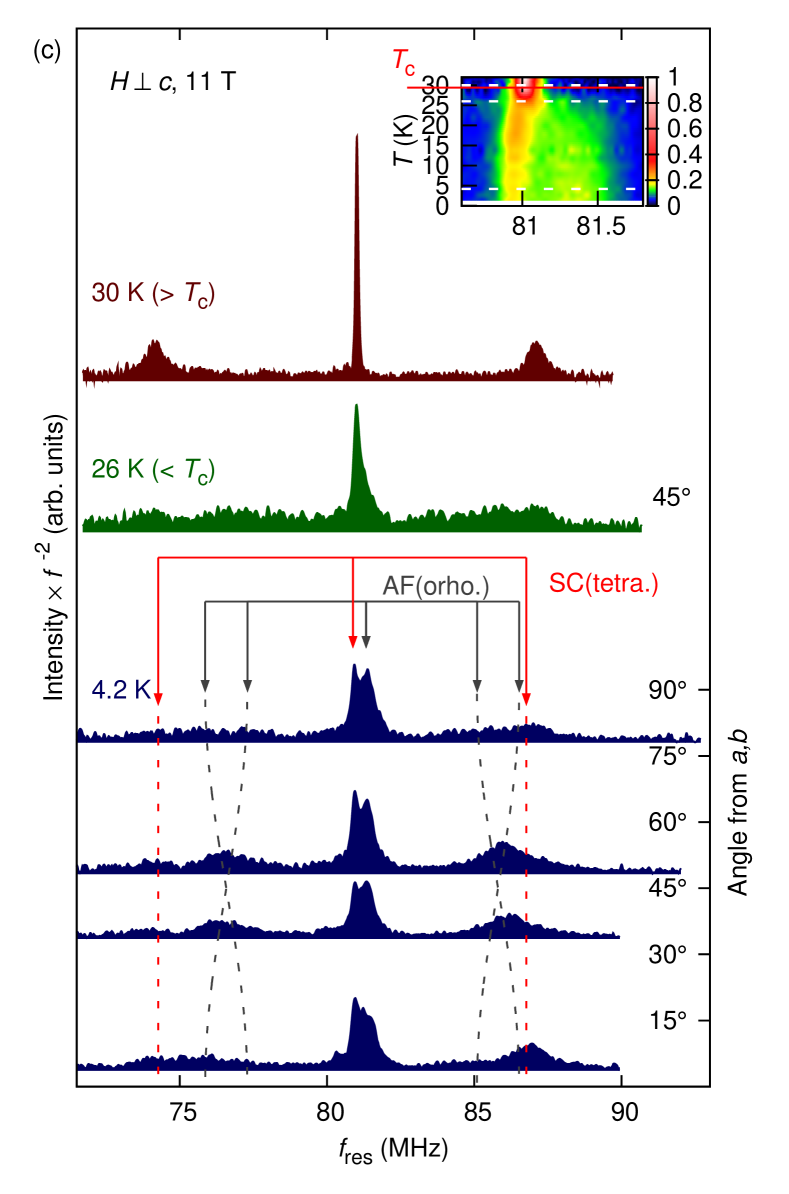
Let us examine the microscopic features of the SC state at 5.4 GPa. Figure 3 shows the NMR spectra obtained by sweeping frequency at fixed fields111 Each Fourier spectrum of an echo is summed while the frequency is being swept [Fourier-step-summing (FSS)]. To take spectrum over a very wide frequency range, we superpose the FSS power spectra by shifting the center frequency by 1 MHz and readjusting the electric circuit and transmitting power.. The spectra immediately above the SC transition temperature show identical features to those at 35 K [Fig. 1(a)], and hence belong to the PM and normal (N) state. The central line for broadens suddenly below [see the insets and Fig. 3(b)] due to field distribution in the SC mixed state. At 4.2 K, the spectra clearly show coexistence of the tetragonal PM-SC and the orthorhombic AF domains with comparable volume fractions as indicated in Figs. 3(a) and (c). The broad asymmetric central line for at 26 K [Fig. 3(c)] indicates that the AF domains appear immediately below . Thus only one phase transition from the N-PM state to the SC/AF coexisting state occurs over the entire sample. This would not be possible if the coexistence were due to inhomogeneity. Instead, the results strongly suggest formation of a self-organized SC/AF hybrid structure.
The -dependence of and the Knight shifts were measured at 5.4 GPa [Figs. 4(a) and (b)]. Both exhibit sudden decrease due to opening of the SC gap with spin-singlet pairing below K, depending slightly on the field values. The values of agree well with the onset of the diamagnetic response [Fig. 4(c)]. These results provide definitive evidence for the bulk SC state. What is anomalous though is that approaches a finite value towards 0 K, indicating a finite density of state (DOS), i.e. gapless superconductivity. Moreover, the SC and AF domains show nearly the same value of at low . To demonstrate good electronic homogeneity, the recovery curves in the relaxation measurements are shown in Figs. 4(d)–(f) at several . All curves are fit extremely well by assuming a single value of . Since even minor disorder often causes significant distribution in , this is a stringent proof for good homogeneity. Therefore, the coexistence of SC/AF domains and the residual DOS in the SC domains are intrinsic and free from material inhomogeneity. The origin of the residual DOS should be one of the following: (i) pair breaking due to disorder or magnetic field, (ii) existence of gapless Fermi surfaces not involved in the SC pairing, or (iii) proximity effect from nearby AF domains. We can exclude the case (i) based on the nearly field-independent and uniform behaviour of . Since the gapless behaviour persists down to 1.5 K, orders of magnitude smaller than , the case (ii) alone is also unlikely. Nevertheless, proximity effects from the AF domains (case iii) can squeeze small gaps on parts of the Fermi surfaces. Note that the size of SC domains must be sufficiently small in order for proximity to be effective. This suggests spontaneous formation of nano-scale periodic structure of alternating SC and AF domains.
We now add the SC phase boundary to the - phase diagram in the inset of Fig. 2(b). The SC/AF hybrid state appears only in a very narrow -region over 5 GPa. It is reported that improved hydrostaticity results in higher critical pressure for the appearance of the SC stateKotegawa et al. (2009b). Our value GPa is higher than the previous results, indicating good hydrostaticity of argon medium. The narrow -range of the SC state is in marked contrast to the stable pure SC state obtained by chemical dopingKamihara et al. (2008); Rotter et al. (2008); Sasmal et al. (2008); Leithe-Jasper et al. (2008), and points to a rather fragile nature of the SC/AF hybrid state. Note that the equal numbers of electrons and holes are preserved under pressure but not by doping.
Next, we focus on the -dependence of the spectra at 5.4 GPa immediately below . We first discuss the spectra from the AF domains. For , the spectral intensity from the commensurate AF domains is reduced with increasing and only weakly visible at 18 K [Fig. 3(a)]. On the other hand, for , the AF spectra do not lose intensity but broaden near . The asymmetric broadening of the central line and the much wider satellites of the spectrum at 26 K [Fig. 3(c)] indicate incommensurate modulation in both the AF moments and the structure. Since even the second order effect of for causes substantial broadening, the first order effects should easily wipe out the AF spectra for , explaining the loss of intensity. Our results then suggest a crossover at K from the low- stripe AF state with a uniform magnitude of moments to the high- modulated (incommensurate) structure.
In the same region , we observed anomalous spectral shape as shown in Fig. 3(b). The central line at 25 K for consists of a moderately broadened line on top of a much broader tail. While the former persists to low , the latter disappears below . Since similar values of are obtained on and off the main peak, they both belong to the SC-PM domain. Note that for the AF domain is smaller by a factor of three at 25 K [Fig. 4(a)]. The width of the broad tail decreases slightly with increasing field, indicating that the origin is related to the SC diamagnetic current. Nevertheless, the entire line shape cannot be explained by standard vortex lattices with any choice of parameters (see the red line). The puzzling line shape above indicates anomalous modulation of the SC diamagnetic current with a much shorter length scale than the penetration depth, where modulation of the AF moments also appears.
Coexistence of AF and SC states has been observed in some heavy fermion compounds. For example, CeRhIn5 under pressure shows microscopic coexistence of the AF and SC orders, which are spatially indistinguishableCurro (2009); Kawasaki et al. (2003). In CeIn3 the AF and SC orders occur in different spatial region at different transition temperaturesCurro (2009); Kawasaki et al. (2004). The case of SrFe2As2 differs from any of examples known to date in that the SC and AF orders are spatially distinguished but occur simultaneously forming a spontaneous SC/AF hybrid structure.
Acknowledgements.
We thank M. Ogata, Y. Yanase, K. Ishida, M. Yoshida, K. Matsubayashi and A. Yamada for their help and discussions. This work supported by the Grant-in-Aid for Scientific Research (B) (No. 21340093) from JSPS and by the GCOE program from MEXT. K.K. is supported as a JSPS research fellow.References
- Uemura (2009) Y. J. Uemura, Nature Mat. 8, 253 (2009).
- Ishida et al. (2009) K. Ishida et al., J. Phys. Soc. Jpn. 78, 062001 (2009).
- Park et al. (2009) J. T. Park et al., Phys. Rev. Lett. 102, 117006 (2009).
- Pratt et al. (2009) D. K. Pratt et al., Phys. Rev. Lett. 103, 087001 (2009).
- Kaneko et al. (2008) K. Kaneko et al., Phys. Rev. B 78, 212502 (2008).
- Kitagawa et al. (2009) K. Kitagawa et al., J. Phys. Soc. Jpn. 78, 063706 (2009).
- Sasmal et al. (2008) K. Sasmal et al., Phys. Rev. Lett. 101, 107007 (2008).
- Leithe-Jasper et al. (2008) A. Leithe-Jasper et al., Phys. Rev. Lett. 101, 207004 (2008).
- Alireza et al. (2009) P. L. Alireza et al., J. Phys.: Condens. Matter 21, 012208 (2009).
- Kotegawa et al. (2009a) H. Kotegawa et al., J. Phys. Soc. Jpn. 78, 013709 (2009a).
- Matsubayashi et al. (2009) K. Matsubayashi et al., J. Phys. Soc. Jpn. 78, 073706 (2009).
- (12) K. Kitagawa et al., arXiv.org:0910.1767v1.
- (13) N. Tateiwa and Y. Haga, Rev. Sci. Instrum., in press.
- Kitagawa et al. (2008) K. Kitagawa et al., J. Phys. Soc. Jpn. 77, 114709 (2008).
- Yaouanc et al. (1997) A. Yaouanc et al., Phys. Rev. B 55, 11107 (1997).
- Nakai et al. (2008) Y. Nakai et al., J. Phys. Soc. Jpn. 77, Suppl. A, 333 (2008).
- Curro (2009) N. J. Curro, Rep. Prog. Phys. 72, 026502 (2009).
- Kotegawa et al. (2009b) H. Kotegawa et al., J. Phys. Soc. Jpn 78, 083702 (2009b).
- Kamihara et al. (2008) Y. Kamihara et al., J. Am. Chem. Soc. 130, 3296 (2008).
- Rotter et al. (2008) M. Rotter et al., Phys. Rev. Lett. 101, 107006 (2008).
- Kawasaki et al. (2003) S. Kawasaki et al., Phys. Rev. Lett. 91, 137001 (2003).
- Kawasaki et al. (2004) S. Kawasaki et al., J. Phys. Soc. Jpn. 73, 1647 (2004).