Post-AGB stars with hot circumstellar dust: binarity of the low-amplitude pulsators. ††thanks: based on observations collected with the Flemish 1.2m Mercator telescope at Roque de los Muchachos (Spain), the Swiss 1.2m Euler telescope at La Silla (Chile) and the 0.5m and 0.75m telescopes at SAAO (South-Africa).
Abstract
Context. The influence of binarity on the late stages of stellar evolution.
Aims. While the first binary post-AGB stars were serendipitously discovered, the distinct characteristics of their Spectral Energy Distribution (SED) allowed us to launch a more systematic search for binaries. We selected post-AGB objects which show a broad dust excess often starting already at H or K, pointing to the presence of a gravitationally bound dusty disc in the system. We started a very extensive multi-wavelength study of those systems and here we report on our radial velocity and photometric monitoring results for six stars of early F type, which are pulsators of small amplitude.
Methods. To determine the radial velocity of low signal-to-noise time-series, we constructed dedicated auto-correlation masks based on high signal-to-noise spectra, used in our published chemical studies. The radial velocity variations were subjected to detailed analysis to differentiate between pulsational variability and variability due to orbital motion. When available, the photometric monitoring data were used to complement the time series of radial velocity data and to establish the nature of the pulsation. Finally orbital minimalisation was performed to constrain the orbital elements.
Results. All of the six objects are binaries, with orbital periods ranging from 120 to 1800 days. Five systems have non-circular orbits. The mass functions range from 0.004 to 0.57 M⊙ and the companions are likely unevolved objects of (very) low initial mass. We argue that these binaries must have been subject to severe binary interaction when the primary was a cool supergiant. Although the origin of the circumstellar disc is not well understood, the disc is generally believed to be formed during this strong interaction phase. The eccentric orbits of these highly evolved objects remain poorly understood. In one object the line-of-sight is grazing the edge of the puffed-up inner rim of the disc.
Conclusions. These results corroborate our earlier statement that evolved objects in binary stars create a Keplerian dusty circumbinary disc. With the measured orbits and mass functions we conclude that the circumbinary discs seem to have a major impact on the evolution of a significant fraction of binary systems.
Key Words.:
Stars: AGB and post-AGB - Stars: binaries: general - Stars: binaries: spectroscopic - Stars: chemically peculiar- Stars: evolution1 Introduction
Post-AGB stars are low- and intermediate-mass stars that evolve rapidly from the Asymptotic Giant Branch (AGB) toward the Planetary Nebulae phase (PNe), before cooling down as a white dwarf. The processes which govern the transition between the symmetry in the AGB outflows and the observed large variety in geometries of proto-PNe and PNe, are still badly understood (Balick & Frank 2002; Sahai et al. 2007, and references therein). During the transition time, the star and its circumstellar envelope must be subject to fundamental and rapid changes in structure, mass-loss mode and geometry. It is now generally acknowledged that binary interaction in these evolved stars could be responsible for a large fraction of the observed asymmetric nebular morphologies, but the direct observational evidence for binarity in PNe is weak (Moe & De Marco 2006; Zijlstra 2007). A recent analysis of the lightcurves obtained by the OGLE microlensing survey towards the Galactic Bulge, revealed a close binary fraction of 12-21 % (Miszalski et al. 2009). These data are only sensitive to the detection of systems which were subject to a strong orbital decrease during interaction.
Testing of the (wide) binary hypothesis is severely hampered by the lack of observational information on binarity in PNe and the often very obscured proto planetary nebulae (PPNe), and also by our poor theoretical understanding of AGB evolution in binary systems. A major shortcoming is that detailed studies of individual, often spectacular, evolved objects prevail and systematic studies of a homogeneous sample are lacking. To study late stellar evolution in binary systems, optically bright, less obscured post-AGB stars are ideal candidates and in recent years it has become clear that binarity is indeed very common (Van Winckel 2007).
The first binary post-AGB stars were serendipitously discovered and turned out to have distinct observational characteristics, which include broad dust excesses often starting already at H or K, pointing to the presence of both hot and cool dust around the system. It was postulated that this indicates the presence of gravitationally-bound circumstellar material in the system (Van Winckel 2003, and references therein). The most famous example is the Red Rectangle, for which the Keplerian kinematics have been resolved by interferometric CO measurements (Bujarrabal et al. 2005).
These characteristics of their SEDs allowed us to launch a more systematic search for candidate binaries. In de Ruyter et al. (2006) we presented 51 objects and the number of known examples has increased since. The total sample is now a fair proportion of the 326 “very likely post-AGB stars” known in the Galaxy (Szczerba et al. 2007). Our selection criteria were focused on the infrared colours and resulted in including the RV Tauri stars with a dust excess detected by IRAS, the known binary post-AGB stars and the newly characterised objects which were selected by Lloyd Evans (1999) for their position in the ’RV Tauri’ box in the IRAS , two-color diagram (see also Maas et al. 2003).
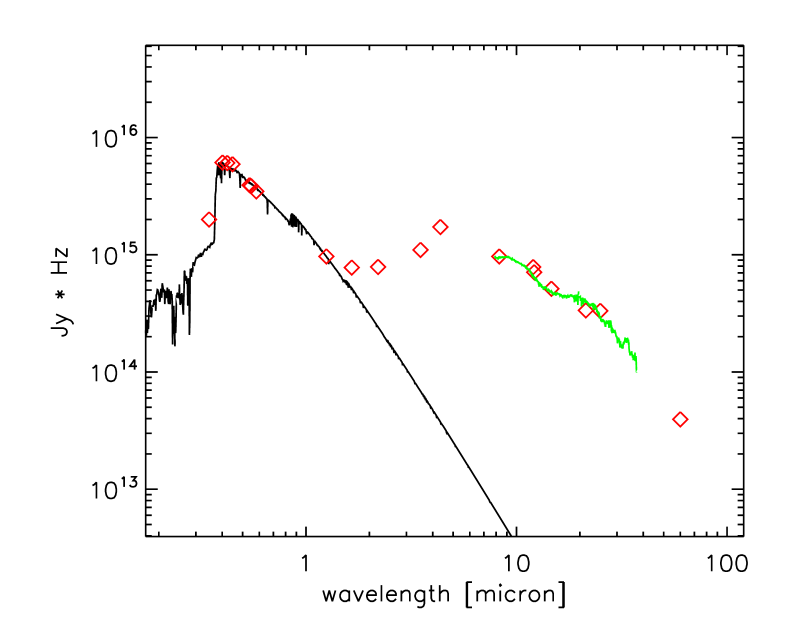
A typical spectral energy distribution is shown in Fig. 1. The stellar flux reprocessed into the infrared is about 50 % for this star. The interested reader is referred to de Ruyter et al. (2006) for the SEDs of the complete sample. In all objects of the sample, the dust excess starts at, or very near to, dust sublimation temperature and this irrespective of the spectral type of the central star. With a typical luminosity of a post-AGB star, this sublimation temperature edge is at a distance smaller than 10 AU from the central source. We therefore inferred (e.g. Van Winckel 2003) that part of the dust must be gravitationally bound: any typical AGB outflow velocity would bring the dust to cooler regions within years. This is much shorter than the likely evolutionary timescale of the central object. We argued that the same inner geometry, found in the resolved system HD 44179 (Men’shchikov et al. 2002; Cohen et al. 2004; Bujarrabal et al. 2005), applies to the whole sample: the objects seem to be surrounded by Keplerian discs of dust.
Our recent interferometric studies confirm the very compact nature of the circumstellar material (Deroo et al. 2006, 2007). Our Spitzer and ground-based N-band spectroscopic data show that dust grain processing is strong, with oxygen-rich dust dominated by, considerably larger, crystalline silicates (Gielen et al. 2008). Sub-mm bolometric data, available for a few sources only, show the presence of large grains in the circumstellar environment (De Ruyter et al. 2005). These large grains have relatively small dust settling times, probably causing the disc to be inhomogeneous, consisting of small hot grains in the surface layer of the disc and a cooler midplane of mainly large grains (Gielen et al. 2007).
The actual structure of those discs, let alone their formation, stability and evolution are not well understood. We therefore started a very extensive multi-wavelength study of those systems. In this contribution we report upon our detailed radial velocity monitoring programme on the 1.2m Swiss Euler telescope. The complementary photometric monitoring was performed at SAAO and on the 1.2m Flemish Mercator telescope. The main aim of this programme is to investigate the link between binarity and the presence of gravitationally bound material and to gain insight into the final evolution of what appears to be a significant population of binary stars.
We organised the paper as follows: In the next section we introduce the sample stars as well as the specific criteria which were used to define the sub selection of objects discussed in this paper. In Section 3 we sketch the data gathering procedure as well as the reduction methods. In Section 4 we focus on the radial velocity determination and in Section 5 we report on the analyses of the sample stars individually. In Section 6 we discuss the binary frequency of the sample and the analyses of the orbital elements. We place our results in a broader context of stellar evolution.
2 Sample
The total sample resulting from our specific selection criteria is described in detail in de Ruyter et al. (2006).
In this paper we restrict ourselves to the stars in our radial velocity programme with spectral type F, five in total, which show only small amplitude photometric variability with a peak-to-peak amplitude of up to 0.25 magnitudes in the V-band and which are accessible from the southern hemisphere. Additionally, we included HD 131356 (EN TrA ), which was recognised as of RV Tauri type by Pel (1976) and found to have a large excess at L by Lloyd Evans (1985), despite the higher peak-to-peak pulsational amplitude. The main reason for its inclusion is that, thanks to the longer time baseline of our velocity monitoring, we could confirm the binary nature and update the period estimate of Van Winckel et al. (1999). It shares the early F spectral type of the other stars discussed here, and in the 2001/2 season the V amplitude was only 0.3 magnitudes.
The spectral types are from objective prism work (Houk et al. 1976; MacConnell & Bidelman 1976; Kwok et al. 1997) in the case of IRAS 12222-4652 and EN TrA . The four remaining stars, which were all initially selected for their large infrared excesses (Lloyd Evans 1999), were classified by Lloyd Evans on blue light spectra of resolution 7 Å, using only the higher Balmer lines as being relatively unaffected by emission, since intrinsic metal deficiency and subsequent depletion weaken the metallic lines and vitiate the usual classification criteria. Luminosity class Ib was assumed as being broadly consistent with both the sharpness of the hydrogen lines and with the similarity of the other properties of these stars to Type II Cepheids. Published spectral types of B7III for IRAS 19125+0343 (Kwok et al. 1997) and B9Ib or B1III for IRAS 19157-0247 (Kwok et al. 1997; Parthasarathy et al. 2000; Gauba et al. 2003) may be discounted, as red spectra show strong lines of the CaII triplet, which have an excited lower state and so do not appear as interstellar absorption lines, whereas H and K lines of interstellar origin may be quite strong.
Cooler objects of the whole sample of de Ruyter et al. (2006) lie in the Population II Cepheid instability strip and have photospheric pulsations of much larger amplitude. These stars have typical hydrogen line spectral types of G0 (Lloyd Evans 1999). In many of those, the pulsations show substantial cycle-to-cycle variability. These pulsations often show the defining alternating deep and shallow minima of RV Tauri stars. The detection of orbital motion in those objects is very difficult, because of confusion with the radial velocity variations induced by the photospheric pulsations (Maas et al. 2002; Van Winckel et al. 1998, 1999).
In Table 1 the programme stars for this contribution are listed with their spectral type, the equatorial coordinates, the galactic coordinates and the visual mean magnitude.
| IRAS | HD | sp. type | l | b | m(v) | Teff(K) | g | [Fe/H] | reference | ||
|---|---|---|---|---|---|---|---|---|---|---|---|
| 085444431 | V390 Vel | F3 | 08 56 14.18 | 44 43 10.7 | 265.51 | +0.39 | 9.13 | 7250 | 1.5 | 0.5 | Maas et al. (2005) |
| 122224652 | HD 108015 | F3Ib | 12 24 53.50 | 47 09 07.5 | 298.25 | +15.48 | 7.95 | 7000 | 1.5 | 0.1 | Van Winckel (1997) |
| NSV 5601 | |||||||||||
| 145246838 | HD 131356 | F2Ib | 14 57 00.69 | 68 50 22.9 | 313.90 | -8.68 | 8.77 | 6000 | 1.0 | 0.7 | Van Winckel (1997) |
| EN TrA | |||||||||||
| 154695311 | F3 | 15 50 43.80 | 53 20 43.3 | 327.82 | +0.63 | 10.56 | 7500 | 1.5 | 0.0 | Maas et al. (2005) | |
| 191250343 | F2 | 19 15 01.17 | 03 48 42.7 | 39.02 | -3.49 | 10.16 | 7750 | 1.0 | 0.5 | Maas et al. (2005) | |
| 191570247 | F3 | 19 18 22.71 | 02 42 10.8 | 33.59 | -7.22 | 10.70 | 7750 | 1.0 | 0.4 | Maas et al. (2005) |
3 Data and Data reduction
In the framework of the cooperation between the Geneva Observatory and the Institute of Astronomy in Leuven (Belgium), the twin 1.2m telescopes Euler (La Silla) and Mercator (La Palma) were constructed. Within this framework, the observers of Leuven have regular access to the Swiss Euler telescope operated by the Geneva observatory and the observers of the Geneva Observatory have regular access to the Flemish Mercator telescope operated by the Institute in Leuven. During the Leuven telescope time on Euler, typically 3 runs of 10-14 days every semester, the programme stars were monitored in radial velocity with the spectrograph CORALIE (Queloz et al. 1999). We started this campaign at the end of November 1998. In Table 2 we list the main characteristics of the observational data.
The CORALIE spectrograph is a fibre-fed spectrograph which samples the visual spectrum in 68 spectral orders ranging from 388 nm to 682 nm. The resolving power () is 50000 at 500 nm, with a 3 pixel sampling. The fibre diameter is 2 arcsec on the sky. We used the on-line data-reduction system (Queloz et al. 1999) which includes all standard steps in echelle reduction.
Older radial velocity data of IRAS 12222-4652 and EN TrA are also included. These data were obtained with the CES spectrograph mounted on the CAT telescope at La Silla (ESO) as well as with the CORAVEL instrument mounted on the 1.5m Danish telescope also on La Silla. CORAVEL is a spectrophotometer by which the radial velocity was obtained by cross-correlation of the stellar spectrum with a hardware mask built from the spectrum of the K2 III star Arcturus (Baranne et al. 1979). EN TrA has stronger lines than the other stars observed, so that clear correlation profiles are obtained from these data. The zero-point of the system was regularly assessed during the night by measuring CORAVEL radial velocity standards. These calibrations were performed at intervals of about 1-2 hours. All the CORAVEL observations, including ours, are held in a database that is maintained by the owners of the CORAVELs in Geneva.
The stars accessible from La Palma were included in the long-term photometric monitoring programme performed with the 1.2m Mercator telescope using the refurbished Geneva 7-band dual-beam photometer (Raskin et al. 2004). This resulted in 47 high quality absolute photometric measurements for IRAS 19125+0343 but only 6 for IRAS 19157-0247 . The seven bands are measured quasi simultaneously using a filter wheel that cycles through all seven filters four times per second alternating as well between the sky and the object channel (Golay 1980). The same instrument was previously attached to the now decommissioned 0.7m Swiss telescope at La Silla. During that period, we obtained many measurements for the Southern stars, IRAS 12222-4652 and EN TrA .
The photometric observations in the Cousins UBVRI system were obtained from SAAO with the Modular Photometer on the 0.5m telescope and subsequently with a very similar photometer on the 0.75m Automatic Photoelectric Telescope (Martinez et al. 2002). These observations were made with reference to the Cousins standards in the E-regions (Menzies et al. 1989). The data are contained in Table S1, except for EN TrA for which the observations were made by Berdnikov & Turner (1995) and Caldwell et al. (2001).
Since such monitoring programmes require the dedicated efforts of many people, the observers responsible for the data acquisition for this project are included as co-authors in alphabetical order.
We complemented our own observations with the V-band data available from the All Sky Automated Survey (Pojmanski 2002). These data were obtained with the ASAS-3 configuration using the wide field (8.8∘x8.8∘) CCD camera with a sampling of 15”/pix. The critical PSF sampling is not reached and the pipe-line reduction approximates aperture photometry with 5 circular apertures from 2 to 6 pixels in diameter. The ASAS guidelines foresee a preferred aperture for every magnitude bin and we limited our analysis to measurements with quality flag A, according to the less rigorous classification applied to the re-reduced data on the ASAS website. The recommended apertures were used, except that for IRAS 19125+0343 we used aperture 4, MAG-3, rather than aperture 1, MAG-2, to ensure full inclusion of the M star at an angular distance of 9.9 arcsec. We applied corrections for the small offsets between the magnitudes of the same star observed with different cameras and for the offsets between the original and later reductions of early observations, many of which were not included in the re-reduced data on the ASAS website after recovery from the data storage crash. The photometric zero-point is tied to the Hipparcos catalogue, as in every frame a few hundred Hipparcos stars are located. These were used in the zero-point definition (Pojmanski 2002). Near simultaneity of some of our observations with ASAS data enabled determination of zero point differences and error estimates. The offsets (ASAS-other), standard deviation (s.d.) of the single observations, the number of data points and the source of comparison data are: IRAS 08544-4431 , +0.043 mag, 0.010 mag, 14, SAAO; IRAS 12222-4652 , +0.009, 0.015, 44, SAAO; IRAS 19125+0343 , -0.057, 0.022, 18, P7; IRAS 19157-0247 , +0.043, 0.023, 3, P7. These differences have been allowed for in combining the relevant datasets. Additionally, from non-overlapping datasets, we have offsets for IRAS 15469-5311 , -0.030, SAAO; IRAS 19125+0343 , +0.045, SAAO; IRAS 19157-0247 , +0.070, SAAO. The SAAO magnitudes of IRAS 19125+0343 are 0.09 mag brighter than the P7 observations, because of the inclusion of the M star in the aperture used at SAAO. These last values will include any actual changes in brightness between the two epochs.
The shift between SAAO and P7 for IRAS 19125+0343 is attributable to the inclusion or exclusion of the nearby M type star. The reason for offsets for other stars is not known. The s.d. obtained by direct comparison of photometries are smaller than the errors ascribed to individual observations in ASAS, which must be more precise than was previously recognised. Intercomparison of three independent subsets within the ASAS data for IRAS 08544-4431 gives values in the range 0.011 to 0.024 mag, confirming the typical values above.
The ASAS data proved very valuable to compensate for the poorer sampling of our own multi-colour measurements in the search for the long periods expected. ASAS data were used by Kiss et al. (2007) in their study of the pulsations of these and similar stars, but the continuation of the ASAS project has doubled the timespan of the observations, which now extend from 2001 or 2002 to the end of the 2008 season. Moreover, the re-reduction of much lost ASAS data has filled the gap around JD 245 3500 seen in the plots by Kiss et al. (2007) for these stars. The more extensive data facilitate the characterisation of the noisy small amplitude oscillations of these stars.
In Table 3 we list the main characteristics of the raw photometric data sets for all objects.
| Object | Ntot | Nused | Vrad | ||
|---|---|---|---|---|---|
| IRAS | km s-1 | ||||
| 085444431 | 181 | 161 | 51147-54487 | 22.1 | 0.25 |
| 122224652 | 83 | 82 | 45397-53833 | 13.5 | 0.23 |
| 145246838 | 75 | 63 | 48313-53904 | 45.7 | 0.81 |
| 154695311 | 175 | 161 | 51278-54680 | 28.2 | 0.25 |
| 191250343 | 103 | 90 | 51278-54331 | 29.6 | 0.19 |
| 191570247 | 137 | 111 | 51279-54680 | 24.2 | 0.23 |
| Object | P7 | SAAO | ASAS |
|---|---|---|---|
| IRAS 08544-4431 | 91 (50858-52060) | 830 (51868-54843) | |
| IRAS 12222-4652 | 120 (47258-47824) | 166 (51625-53195) | 576 (52441-54711) |
| EN TrA | 61 (47608-49853) | 58 (43979-49564) | 633 (51905-54743) |
| IRAS 15469-5311 | 49 (48803-51712) | 550 (51925-54743) | |
| IRAS 19125+0343 | 47 (52415-53606) | 30 (49485-51819) | 362 (52442-54772) |
| IRAS 19157-0247 | 6 (52446-52561) | 50 (48404-51819) | 386 (51979-54777) |
4 Radial velocity determination
To obtain accurate radial velocity information based on low S/N spectra, we determined cross-correlation profiles for all individual measurements. The standard spectral mask includes a large set of well defined spectral lines for the given spectral type. Our chemical analysis, based on high signal-to-noise optical spectra, showed that for most stars several elements, including iron, are under-abundant (Maas et al. 2005). By eliminating, from the standard spectral mask, those lines not detected in our high-quality spectrum, we determined an appropriate spectral mask for every individual star. Moreover, we selected only single lines with clear symmetric profiles.

In Fig. 2 we compare the cross-correlation profile obtained by the standard mask with the one obtained by the specific mask, constructed on the basis of the high signal-to-noise spectrum for IRAS 19157-0247 . No accurate velocity can be derived on the basis of the standard mask generated profile, while a Gaussian fit of the profile, obtained by the specified mask for IRAS 19157-0247, gives a good estimate of the radial velocity.
The radial velocity is computed using the mean of a 50-point bisector of the cross-correlation function. An initial Gaussian fit was used to determine the bisector points which are defined on an equidistant velocity grid centred on the velocity minimum of the Gaussian fit. The grid spans twice the Gaussian width (). The internal uncertainty of a radial velocity measurement is estimated by the rms of these 50 bisector values. We eliminated those cross-correlation profiles for which the rms is larger than 1 km s-1. Several spectra were obtained under very poor weather conditions and/or failed due to guiding failure. These measurements were eliminated in this step of the analysis. Despite the fact that the objects do not have a large pulsational amplitude, some objects do show asymmetries in the cross-correlation profiles at particular phases in the pulsation cycle. These profiles are also eliminated at this point since we focus on the detection of orbital motion. The number of radial velocity measurements which passed our critical quality assessment test is give in Table 2. The individual datapoints of all objects are given in Table 4 which is available at CDS.
5 Variability study of individual stars
The main goal of our programme was to look for evidence of binary motion in the radial velocity data and, if found, determine the orbital elements. Although for this paper we selected objects with a small pulsational amplitude in V, they all show some photometric variability which could be present in the radial velocity data as well.
Luminous stars on the blue side of the population II Cepheid instability strip are, however, far from regular mono-periodic pulsators and often show a very complex pulsational behaviour. One example is HD 56126 (Barthès et al. 2000; Fokin et al. 2001) where the main pulsation mode is shown to generate shocks provoking a complex asynchronous motion in the outer layers. Another example is HR 7671 (HD 190390) where the main period of 28.6 days is accompanied by a beating behaviour either due to a stable pulsation triplet or due to an unstable main period. Consequently the description of the pulsation in radial velocity, modelled as a simple harmonic, fails to reproduce the complete dataset which shows a peak-to-peak difference of 8.2 km s-1(Reyniers & Cuypers 2005), as well as a corresponding light amplitude of 0.36 mag. In neither object is there evidence for binary motion. Since the programme stars of this project are also on the hot side of the instability strip, we investigated the photometric dataset in parallel with the radial velocity data as to confront radial velocity variability with photometric behaviour.
For the variability study we used phase dispersion minimization PDM (Stellingwerf 1978) and, for the photometric data, the Lomb-Scargle method to search for periodicities. The orbital solutions were then computed using an altered version of the Fortran code VCURVE (Bertiau & Grobben 1969) as well as the minimisation code FOTEL (Hadrava 2004). The weights of the individual velocity points were based on the rms values of the bisector analyses. All errors quoted in the individual orbital elements are rms errors of these elements calculated from the covariance matrix. Plots of the photometry of single seasons were used to look at the individual cycles in some cases. The individual photometric datapoints of all stars are given in Table 5 and Table 6 available at CDS.
5.1 IRAS 08544-4431
We have already shown that this object is a spectroscopic binary in Maas et al. (2003). We continued our monitoring of this object to refine the orbital elements. We have gathered a total of 161 good radial velocity measurements sampling more than 6 orbital periods. The resulting radial velocity variations are shown in Fig. 3. An orbital period of 508 days and an eccentricity of 0.25 were found. All orbital elements are listed in Table 7.

Our previous pulsational analysis of photometry from SAAO (Maas et al. 2003) has shown that low-amplitude pulsations are present, but that the cycle-to-cycle variability is large. Periods of 72.3 and 89.9 d were reported. Kiss et al. (2007) confirmed the shorter period and obtained two new periods, 68.9 d and 133 d, from ASAS data which extended to JD 245 3900, with a break 245 3200 - 245 3750.
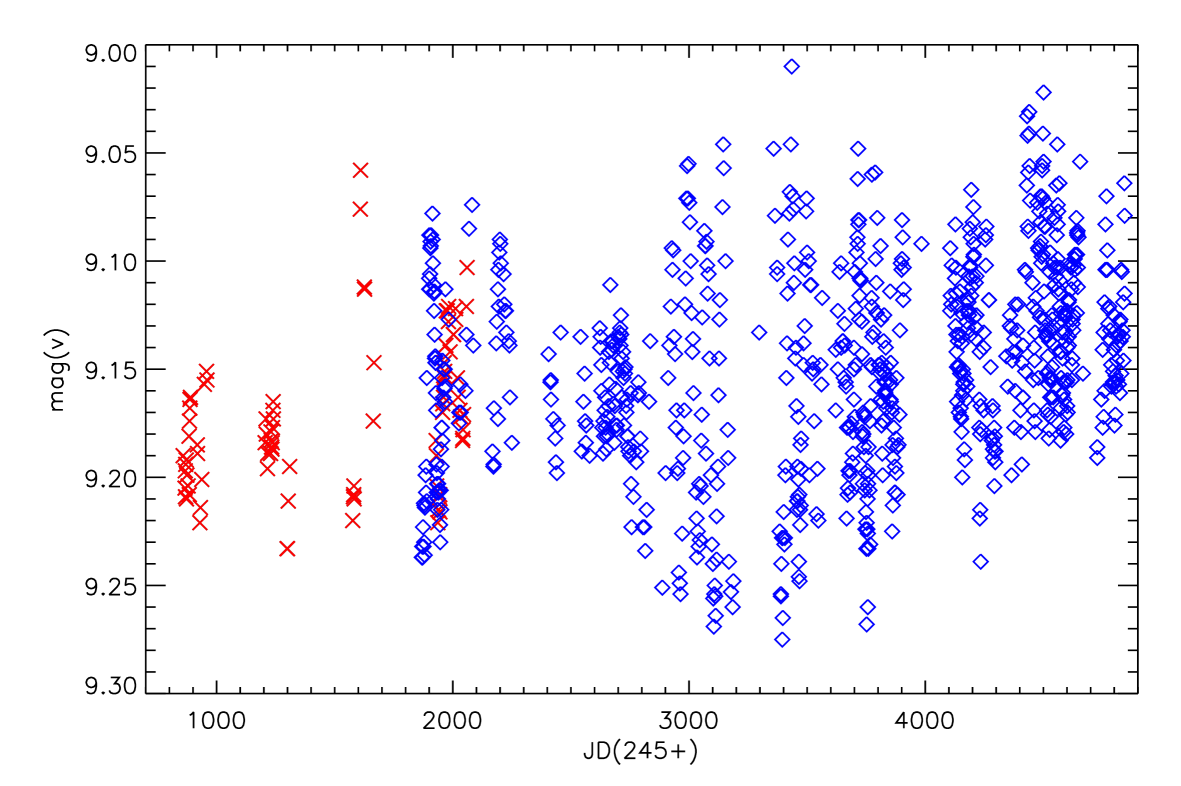
We combined the SAAO and the best current ASAS dataset (see Table 3) and analysed the total V-band time-series. In Fig. 4 the total dataset is shown and a beating pattern with a clear amplitude modulation is present, as well as a slow brightening. The dominant period of 71.7 0.4 d gives in a harmonic fit an amplitude of 0.03 mag and a variance reduction of 21 %.
The amplitude was greatest, at 0.20 mag, in the interval JD 245 2850 to 245 3500. Fig. 5 shows these data, phased on the double period 143.6 d. The alternate minima are of different depth and the alternate maxima are of unequal height, though the differences are quite small. The behaviour was maintained for almost 2 years and is reminiscent of the typical RV Tauri lightcurves, albeit with a much smaller amplitude. Much of the small scatter may be attributed to the observational error of about 0.02 mag. Corresponding plots for the two intervals of small amplitude, represented by SAAO data from JD 245 0850 to 245 1500 and ASAS data from JD 245 2400 to 245 2750 show amplitudes of 0.08 mag and 0.06 mag respectively, while the curves are less well defined. The separation of these intervals, at least 1400 d, is less than that to be expected from a beat between the two principal periods, 2800 d, as suggested by Kiss et al. (2007), but the next interval of small amplitude had not occurred by early 2009, JD 245 4840, and may yet fit the prediction.

There is no evidence for the orbital period in the ASAS photometry (Kiss et al. 2007) nor in our extended multicolour photometry. Given the complex atmospheric pulsations, we did not attempt to clean the low amplitude irregular pulsational variability from the radial velocity dataset.
5.2 IRAS 12222-4652
IRAS 12222-4652 also shows a complex pulsational pattern with a significant amplitude modulation and with a smaller amplitude at earlier times. (see Fig. 6). ASAS data for the period before JD 245 2300 were highly erratic, in contrast to contemporaneous SAAO data, and have been rejected. Our Geneva photometry is poorly sampled over many years, while the SAAO and ASAS photometry combine well to give a larger dataset. We find a dominant period of 60.5 0.11 d and a second period of 55.3 0.2 d, in agreement with (Kiss et al. 2007). A combined harmonic fit gives a fractional variance reduction of 52 %. Plots of the V magnitude against time show continuous variability in the amplitudes and lengths of successive cycles, from 0.11 to 0.20 mag and 48 to 76 days. The longer cycles tend to have amplitudes which are below average. The PDM analysis also yields an additional period of 120.6 1.0 d, or twice the principal period. IRAS 12222-4652 is clearly another star with a complex dynamical photosphere which complicates the interpretation of radial velocity variations.
The total radial velocity dataset of IRAS 12222-4652 includes older data, measured on high-quality spectra obtained to study the chemical composition (Van Winckel 1997). Our total timespan is therefore more than 23 years. The dataset gives a significant initial period of 917 4 days, which we interpret as due to orbital motion. A circular orbit gives a fractional variance reduction of 65 %. After cleaning of this first circular model, we retrieve the dominant photometric period of 60.5 d in our -statistic with an amplitude of 1.4 km s-1. Our final orbital solution (see Fig. 7) is then obtained after cleaning the original dataset with the harmonic fit of the dominant photospheric pulsation mode. The small eccentricity is not significantly different from zero, so our final solution gives a circular orbit of 914 4 days. The fractional variance reduction is 75%. The orbital period is not present, either in the magnitudes or in the colours.

5.3 EN TrA
HD 131356 (EN TrA) was discovered to be variable by Miss Leavitt (Pickering 1907). The binary nature and preliminary orbital elements were given in Van Winckel et al. (1999). We have since accumulated more data using the CORALIE spectrograph in order to improve the orbital solution.
The object is catalogued in the GCVS as a small amplitude Cepheid with a published pulsation period of 36.54 d (Grayzeck 1978), based on a limited dataset covering part of two pulsational cycles, with poor coverage in phase. Pel (1976) obtained a continuous time-series of 44 measurements on the Walraven photometric system. The object showed at that time (JD 2440990-2441171) a substantial V-band amplitude, with a maximum of V=8.55, a deep minimum of 9.2 and a shallow minimum of 8.8. The Hipparcos catalogue (HIP 73152) list a period of 37.10 days (Perryman & ESA 1997).
Our Geneva photometry is poorly sampled and no periodicity could be determined. Two sets of observations obtained at SAAO on the UBVRI system are available, comprising 42 observations (JD 2443979-2445155) by Caldwell et al. (2001) and 16 observations (JD 2449522-2449564) by Berdnikov & Turner (1995). Both indicate a range of V=8.5-9.05, with little difference between deep and shallow minima. A short dataset by Eggen (1986) gives V=8.55-8.96, without full coverage of the extrema. The first season of ASAS data, 2001-2002, shows a variable amplitude of up to 0.3 mag, similar to the other stars (see Fig. 10).
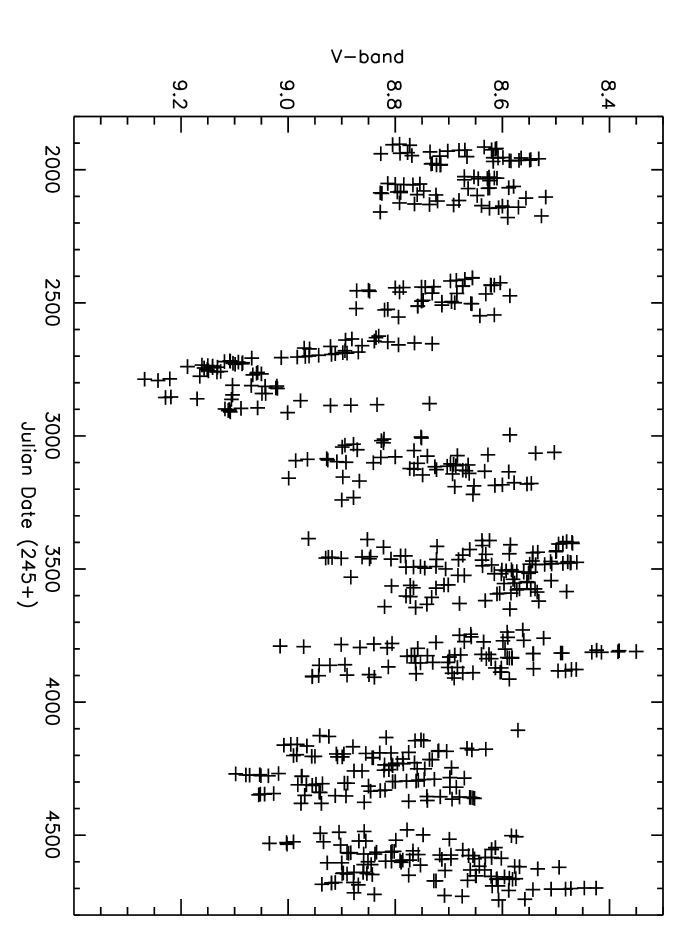
EN TrA fades by some 0.5 mag near JD 245 2800 and again, by about 0.1 mag, near JD 245 4300 (see Fig. 8). Outside of these intervals, the mean magnitude is fairly constant but the amplitude is variable. Period analysis gives a single period P = 37.04 0.03 d and a double period 74.1 0.1 d. Aliases correspond to the orbital period and the calendar year. The magnitudes at maximum and minimum light are both very variable from cycle to cycle and from year to year. The deep and shallow minima, and bright and faint maxima, generally retain the same relative phasing within a given season, but they sometimes interchange in successive years. These phenomena are well known in RV Tauri stars.
Thanks to the very long baseline of our radial velocity data, we could sample about 3.7 orbital cycles. In a first iteration, after the removal of the orbital solution, the residuals showed a very clear periodicity with a period of 36.70 d, which we link to the pulsation timescale found in the photometry. A harmonic fit gave a radial velocity amplitude of 4 km s-1and we cleaned the original data with this mean pulsation model. The final solution gives an orbit with a period of 1493 10 days and a large eccentricity of 0.31 0.05. (see Fig. 9, Table 7).
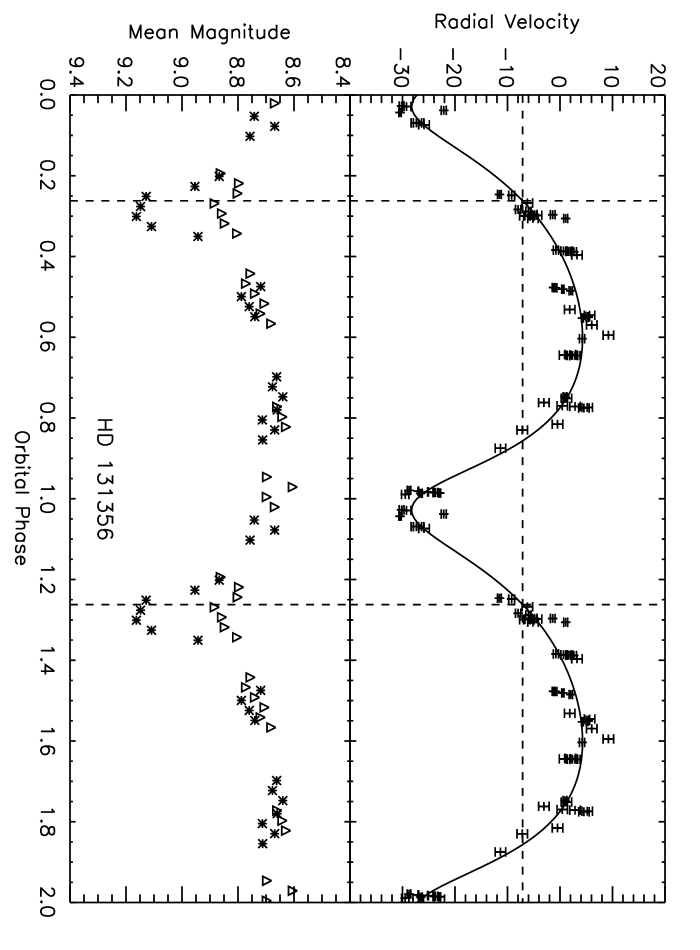
To investigate the secular variations in the mean magnitude we selected only those pulsation cycles for which 6 or more data points are available. We then cleaned for the pulsation amplitude and reduced the pulsation cycle to the mean magnitude alone. This mean magnitude is around 8.6 but there is a significant drop when the object enters the conjunction phase (see Fig. 9). The minimum (mean magnitude of 9.1) is obtained exactly at inferior conjunction and EN TrA then slowly recovers to its nominal mean values about 0.3 in orbital phase later. There are shallower fadings at the same orbital phase: three orbits earlier, near JD 244 8350 (P7 data) and JD 245 4300 (ASAS data). The corresponding orbital phase is not covered by any of the other datasets. The most natural explanation for the secular variability is that the star suffers from variable circumstellar reddening during orbital motion. The minimum is reached when the object suffers from a maximal reddening of circumstellar material in the line-of-sight, which would occur when the star is at inferior conjunction if there is a circumbinary disk.

5.4 IRAS 15469-5311
IRAS 15469-5311 is another low-amplitude pulsator which is little studied in the literature. The mean magnitude varies, with a fairly abrupt brightening of 0.045 mag after JD 245 4000, as well as smaller variations on a time scale greater than 1000 days. We combined the ASAS and SAAO photometric V-band measurements for the pulsation study. The main period is 54.5 0.3 d, consistent with 54.4 1 d found by Kiss et al. (2007), and a harmonic fit gives a fractional variance reduction of 21 % with an amplitude of only 0.028 mag. The extended dataset did not confirm the second pulsation period of 49.1 days given by Kiss et al. (2007); this might be a one year alias of the primary period. The cleaned data yield the next possible period of 56.6 0.3 d. but the variance reduction is limited. Possible other periods of 164 and 77 days may be spurious as well, as they also appear in the windowed data. Plots of magnitude against JD for 20 well observed cycles in four seasons give lengths of 32 to 77 days, with a mean of 54.0 days. The amplitude varies from 0.02 mag to 0.15 mag. The mean amplitude quoted above is an underestimate of the true variability, as the mean light curve is blurred by variability in both amplitude and length of period. The double period also emerges from the PDM analysis and a plot of V against 109.2 days shows a weak tendency towards alternate deep and shallow minima, as well as bright and faint maxima.
We have 160 good radial velocity measurements for IRAS 15469-5311 over a time range of 3402 days. The orbit of 390 days is very well defined (see Fig. 11). The classical Lucy and Sweeney test (Lucy & Sweeney 1971) shows that the orbit has a small but significant eccentricity of 0.09. In Table 7 all other orbital parameters are given. There is an indication of the orbital period in the photometric data, for which Kiss et al. (2007) give a period of 384 50 days, but the phase diagram is not convincing. The residual velocity variations have a peak-to-peak amplitude of 10 km s-1(standard deviation of 2.1 km s-1) but there is no clear indication of the main pulsation period nor could we discover a clear periodicity in the residuals.

5.5 IRAS 19125+0343
IRAS 19125+0343 is also a poorly studied object, despite the fact that it combines rather bright IRAS fluxes with a significant visual flux of m(v)=10.16. The LRS-IRAS spectrum is featureless (Kwok et al. 1997) and the source was not detected in the OH survey of Le Squeren et al. (1992). The object was rediscovered by Lloyd Evans (1999) in the search for new RV Tauri stars.
The photometric variability is small: the SAAO and P7 datasets give ranges of 0.11 and 0.07 mag, respectively, in the V-band. Kiss et al. (2007) found a possible long period of 2300 d; the more extensive ASAS data available now are consistent with this, with an amplitude of about 0.03 mag, but instead a step change of 0.03 mag fainter after JD 245 3400 is a possibility.

Application of the period search algorithms to the complete dataset yielded several periods between 34 and 43 days: 42.3 and 38.9 days were the strongest. Phase plots against any of these periods showed much greater scatter than can be attributed to observational errors. The light curves (Fig. 12) for individual seasons were inspected, and the times between identifiable features, generally near the mean magnitude on the ascending or declining branches of the light curve, were estimated for successive cycles. There were insufficient data in 2006, and variations were small and/or erratic in 2004, 2005 and 2007. Estimates of the period could be made for 1994, from SAAO data, for 2002, from P7 and ASAS data, and for 2003 and 2008 from ASAS data. The values for 15 cycles ranged from 29 to 51 days, with a mean of 38.2 days. On two occasions an incipient decline after maximum was reversed to give a second maximum and an unusually long interval between mid-decline points. This occurred in 2002, turning a tentative 32 day interval into 47 days, and in 2003, turning a 39 day interval into 51 days. The 519 d orbital period is not present in the photometry.

We have 91 good radial velocity measurements over a time range of 3389 days. We found a clear periodicity of 519 days and the peak-to-peak velocity amplitude is no less than 29.5 km s-1. Given the period and amplitude, we interpret this variability as due to orbital motion. We obtained orbital elements with a significant eccentricity of 0.26 0.03. We sampled in total 6.5 orbital cycles. Fig. 13 shows the radial velocities folded on this period. The full line represents the best Keplerian orbital solution (see Table 7).
The strongest peak in both the PDM and Scargle periodograms for the residual velocity variations corresponds to 43 days, which leads to a variance reduction of 39 , and is fairly close to the mean of the cycle lengths found in the photometry. The orbital period is much shorter than the possible long photometric period (Kiss et al. 2007) in the ASAS data.
5.6 IRAS 19157-0247
The SAAO and ASAS photometry show that IRAS 19157-0247 varies with an amplitude of up to 0.15 mag but there is no long term trend, although there is possible modulation in the amplitude. The ASAS photometry, whether taken as a whole or subdivided into shorter intervals, or supplemented by the SAAO and P7 data, consistently indicates periods of 22.5 to 22.8 days, but with low significance. This period does not give a satisfactory light curve for any of these datasets, even for the data obtained in a single season: there is only a weak tendency to a variation with phase in the derived period. Detailed examination of the time series for individual seasons shows great variability in both amplitude and length of successive cycles. The data are undersampled for this star, making delineation of the variability hard. Kiss et al. (2007) found an irregular variation, with a possible periodicity of 25 days.
We have 111 radial velocity measurements over a time range of 3397 days. Both PDM and a Fourier analysis indicate that the 120 day period is significant. This period in radial velocity is not present in the photometry and we interpret this as the orbital period. The non-pulsational origin of the 120 day period is corroborated by two arguments. First, 120 days is a very long pulsational period for an F-type post-AGB star, and in any case it is not found in the photometric analysis. Secondly, the peak-to-peak variations in V for IRAS 19157-0247 average 0.13 mag at most, so it is very doubtful that the radial velocity variations with a peak-to-peak amplitude of 24 km s-1are only due to pulsations. Interpreting the velocity curve as due to pulsations of the photosphere, the integrated velocity would yield a radius increase of about half the initial radius. Such a pulsation would clearly not go unnoticed in the photometry. We therefore interpret the velocity variations as due to orbital motion. This is a very short orbital period with a high eccentricity which puts strong constraints on the evolutionary history of the star !
Fig. 14 shows the radial velocities and the residuals folded on this period. We found an eccentricity of 0.31. The other orbital elements are shown in Table 7. The non-zero eccentricity was tested with the classical Lucy and Sweeney test (Lucy & Sweeney 1971). The is 14% larger for a circular fit. This, together with the many cycles sampled, shows that the eccentricity is significant. The periodograms for the residual velocities show several peaks between 9 and 20 days, probably related to the timescale of the pulsations. None of them lead to a significant variance reduction, however.

| IRAS 08544 | IRAS 12222 | EN Tra | IRAS 15469 | IRAS 19125 | IRAS 19157 | |||||||
| Period (days) | 507.8 | 1.5 | 913.8 | 4.3 | 1493. | 7. | 389.9 | 0.5 | 519.6 | 2 | 119.5 | 0.2 |
| K (km s-1) | 8.6 | 0.3 | 3.5 | 0.5 | 16.3 | 0.6 | 11.9 | 0.3 | 12.6 | 0.5 | 7.3 | 0.7 |
| e | 0.24 | 0.02 | 0.00 | 0.0 | 0.32 | 0.04 | 0.09 | 0.02 | 0.25 | 0.03 | 0.31 | 0.07 |
| (∘) | 47. | 7. | 160. | 6. | 133. | 16. | 242. | 6. | 80. | 14. | ||
| T0 (periastron) (JD24+) | 51482. | 10. | 538535. | 22. | 51491. | 17 | 53061. | 8. | 51849. | 5. | ||
| (km s-1) | 61.98 | 0.16 | 3.65 | 0.17 | 7.1 | 0.4 | 14.9 | 0.2 | 67.0 | 0.3 | 33.1 | 0.3 |
| r.m.s. (km s-1) | 1.88 | 1.47 | 2.42 | 2.1 | 1.98 | 3.31 | ||||||
| (AU) | 0.39 | 0.01 | 0.29 | 0.04 | 2.12 | 0.08 | 0.42 | 0.01 | 0.58 | 0.02 | 0.08 | 0.01 |
| F(M) (M⊙) | 0.0304 | 0.0033 | 0.0042 | 0.0017 | 0.57 | 0.06 | 0.068 | 0.006 | 0.097 | 0.012 | 0.0041 | 0.0012 |
| N | 161 | 82 | 63 | 161 | 90 | 111 | ||||||
| (cycles) | 6.6 | 9.2 | 3.8 | 8.7 | 5.9 | 28.4 | ||||||
| 0.25 | 0.23 | 0.81 | 0.25 | 0.19 | 0.23 | |||||||
6 Discussion
6.1 Orbits
The most important conclusion of this extensive monitoring effort is that we have proven that all the programme stars are binaries. Not surprisingly, given the high luminosities of the primaries, they are single-lined spectroscopic binaries, as in none of the spectra have we found evidence of a flux contribution from the companion.
The orbital elements cover a wide range of periods, from 120 to 1500 days, with a range in mass functions of 0.004 to 0.57 M⊙. The semi-major axes of the orbits of the primaries around the centre of mass cover the range = 0.08 to 2.1 A.U. These are rather small orbits compared to the dimensions of a single AGB star. With their present estimated luminosity, these stars were too large while on the AGB to fit in their orbits and they must have been subject to severe binary interaction.
The physical interpretation of the orbital elements is hampered by the unknown inclination. Provided the evolved component has a canonical 0.6 M⊙ left, the minimal masses of the companions are given in Table 8.
It is, however, very unlikely we observe the objects nearly edge-on. To quantify the impact of the inclination on the observed SED and observed line-of-sight reddening, we used the detailed radiative transfer model of the disc around IRAS 08544-4431 (Deroo et al. 2007) and assume that a similar model applies to all programme stars. The inner hole is dust free as we assume that dust grains cannot exist above the sublimation temperature. The presence of this inner gap allows the existence of a vertical boundary directly irradiated by the central star, creating a puffed-up geometry (Deroo et al. 2007). The scale height of the disc must be significant in all objects because of the very significant near infrared luminosity in the whole sample (de Ruyter et al. 2006). The temperature, density and scale height of the disc are calculated based on the condition of hydrostatic equilibrium, and iterated to obtain the convergent structure. The constraints of the model parameters of the disc around IRAS 08544-4431 came from spectrally resolved interferometric data in both the near-IR and the N-band (Deroo et al. 2007).
| Star | Mass of the companion | |
|---|---|---|
| i = 90∘ | i = 65∘ | |
| IRAS 08544-4431 | 0.29 | 0.33 |
| IRAS 12222-4652 | 0.13 | 0.15 |
| EN TrA | 1.25 | 1.50 |
| IRAS 15469-5311 | 0.41 | 0.47 |
| IRAS 19125+0343 | 0.49 | 0.56 |
| IRAS 19157-0247 | 0.13 | 0.15 |
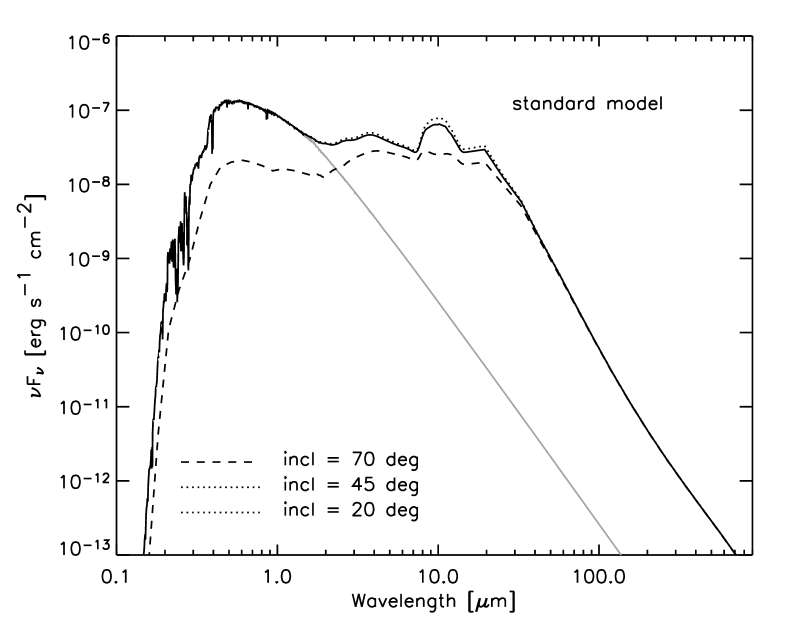
In Fig 15 we show the impact on the SED of different inclinations. The figure illustrates that around an inclination of 70∘, the line-of-sight towards the central object will graze the disc. This will strongly affect the circumstellar reddening. The line-of-sight circumstellar reddening in the 70∘ model is about E(B-V) = 0.8. Edge-on, the discs are strongly opaque and no direct visible light of the central star will reach us. The objects with the largest reddening are IRAS 08544-4431 , IRAS 15469-5311 and IRAS 19125+0343 with E(B-V) = 1.5 0.3, 1.5 0.3 and 1.2 0.3 respectively (de Ruyter et al. 2006). The low galactic latitudes and the strong interstellar DIBs in their spectra (Fig. 3 of Maas et al. 2005) indicate that the greater part is of interstellar origin, however. We conclude that in all six objects, the inclination of the is orbit is very likely to be less than or equal to 65∘ and the corresponding lower limits of the mass estimates are also given in Table 8. EN TrA is the only object for which we have direct evidence that the companion is too massive to be a white dwarf. Note that also for the other objects, there is no evidence of a hot white dwarf, neither in the energetics nor in the lack of spectroscopic evidence of symbiotic activity. The companion stars are likely to be unevolved main-sequence stars, which do not contribute significantly to the energy budget of the systems.
6.2 Chemical Composition
A surprising effect of the presence of a disc is that the photospheric chemical content can be strongly affected by depletion (Van Winckel et al. 1992; Waters et al. 1992). The observed chemical pattern in the photospheres is the result of gas-dust separation followed by re-accretion of only the gas, which is poor in refractory elements. The photospheres are then deficient in refractories (like Fe and Ca and the s-process elements), while the non-refractories are not affected. Photospheric depletion is surprisingly common in evolved objects (Giridhar et al. 2005; Maas et al. 2005, 2007, and references therein). Recently we found that depletion is also present in the LMC (Reyniers & van Winckel 2007), again around objects where the presence of a gravitationally bound disc is suspected.
Here we strengthen the link between the efficiency of the depletion process and the binary nature of the object. IRAS 08544-4431 , IRAS 15469-5311 , IRAS 19125+0343 and, to a much lesser extent, IRAS 19157-0247 are affected by photospheric depletion (Maas et al. 2005). EN TrA is iron deficient but the signature of depletion is less clear while IRAS 12222-4652 has mainly solar abundances (Van Winckel 1997). The depletion process will mask third dredge-up chemical enrichment as the s-process elements are strongly refractory (Lodders 2003). In none of the objects is there any evidence for AGB nucleosynthetic enrichment.
Recent infrared spectra of EN TrA , IRAS 19125+0343 , IRAS 19157-0247 were presented by Gielen et al. (2008), for IRAS 08544-4431 by Deroo et al. (2007). In all objects the dustfeatures are dominated by silicates and characterised by a very strong degree of processing both in grainsize and in crystallinity. The dust disc creation occurred when the envelope was O-rich. This is a general characteristic of the whole sample (Van Winckel 2003) and the chemical evidence both of the photospheres and of the circumstellar material show that the AGB evolution of those binaries was cut short by the phase of strong binary interaction.
6.3 Binary evolution
Calculations from Schuerman (1972) show that, when one takes into account the radiation pressure of the AGB-star in a close binary system, the critical Roche potential degenerates into a surface containing the inner Lagrangian point L1 and the outer Lagrangian point L2 for a critical ratio of the radiation pressure force to the gravitational attraction. For this critical ratio, material lost by the AGB star flows through the L1 point and can settle itself through the L2 point in a circumbinary disc (see also Frankowski & Jorissen 2007).
Recent population synthesis experiments (Bonačić Marinović et al. 2008) account for tidally enhanced mass-loss (Tout & Eggleton 1988) during AGB evolution and balance the eccentricity pumping mechanisms induced by a prescription of the mass-loss which is orbital phase related, so that at periastron passage, mass loss is enhanced (Soker 2000). The conclusion of Bonačić Marinović et al. (2008) was that the eccentricity enhancement process is in balance with the circularisation for objects which do not enter the common envelope phase and are expected to leave the AGB in orbits around 1000 days or longer. The eccentric orbits with shorter periods (those of IRAS 08544-4431 , IRAS 15469-5311 , IRAS 19125+0343 and especially IRAS 19157-0247 ) are still not accounted for. In these systems, additional eccentricity pumping mechanisms should be at work which may be linked to the presence of the circumbinary disc (Waelkens et al. 1996; Artymowicz et al. 1991). Similar but less pronounced excess eccentricities with respect to theory are found in related objects (e.g. Jorissen et al. 2009). Despite the phase of strong binary interaction, there is no evidence that the mass transfer towards the undetected companion has been very efficient: the mass functions implying rather low minimal masses of the secondary (see Table 8).
The global picture that emerges from our radial velocity monitoring is that the post-AGB stars evolved in a system which is too small to accommodate a peak AGB star. During a badly understood phase of strong interaction, which in view of the small orbits was probably a common envelope phase, a circumbinary dusty disc was formed, but the binary system did not suffer dramatic decrease in orbital radius. What we observe now is an F-G supergiant in a binary system, which is surrounded by a circumbinary dusty disc in a bound orbit. Although not yet proven, the fact that we found a 100 % binarity rate for our subsample of objects with low pulsational amplitude strongly favours the binary nature of all post-AGB stars with a hot dust component.
The formation, structure and evolution of the disc are far from being understood, but do appear to be key ingredients in our understanding of the late evolution of a very significant binary population.
6.4 Variability
These six stars show a wide range of properties, in particular as regards the amplitude and more especially the regularity of variation. The first three stars, IRAS 08544-4431 , IRAS 12222-4652 and EN TrA , have periodograms with peaks which stand out strongly from the noise, while IRAS 15469-5311 has a much weaker peak and IRAS 19125+0343 and IRAS 19157-0247 have only a confused scatter, with minor peaks on a noisy background. IRAS 08544-4431 is the only one of the six to exhibit well defined, coherent variations for as long as one or two years. IRAS 12222-4652 and EN TrA have better defined peaks in the periodogram than IRAS 08544-4431 , with a single period in the case of EN TrA , but their amplitudes and, in the case of IRAS 12222-4652 , the lengths of individual cycles change continuously. The variations of IRAS 15469-5311 and IRAS 19125+0343 exhibit cycles of very variable amplitude and length, with evidence of changes of direction of pulsation within a given cycle for IRAS 19125+0343 , while the data for IRAS 19157-0247 are inadequate to elucidate the nature of the variations, which are probably even more irregular and of relatively short period.
These stars are of earlier spectral type and so are hotter than classical RV Tauri stars (Lloyd Evans 1999) and appear therefore to lie to the blue of the Cepheid instability strip. This raises the question of the nature of the pulsation. The ratio of the two principal periods is 0.96 for IRAS 08544-4431 and 0.91 for IRAS 12222-4652 , whereas the ratio of the first overtone to the fundamental, P1/P0, is always close to 0.705 in classical Cepheids (Stobie 1977). Two high overtones might have the period ratios which we observe, but it seems implausible that these would be dominant, and the periods of these two stars are quite long, implying very long fundamental periods and a correspondingly high luminosity. This suggests that the pulsations of these stars are non-radial. EN TrA, which has a single, shorter, period and a larger amplitude, is probably a radial pulsator, however. The apparently abrupt turn round in the direction of change of V magnitude, leading to a second maximum and a consequent lengthening of individual cycles in IRAS 19125+0343 , recalls the suggestion that shockwaves may be involved in the complex motions of the outer atmosphere of the post-AGB star HD 56126 (Barthès et al. 2000).
The four stars of largest amplitude showed indications of the classical RV Tauri feature of alternating deep and shallow minima, but with equally large alternation of the magnitude at successive maxima.
Multicolour observations may be used to compare light and colour curves, which follow a similar phase relationship in classical Cepheids but which differ in Type II Cepheids, for which an atmospheric shock wave leads to a bluer colour on the rise to maximum light, with wide loops in two-colour diagrams, whereas classical Cepheids have very narrow loops. The amount by which the B curve leads the V curve, in terms of relative phase in the single period, is: IRAS 08544-4431 , 0.00:, IRAS 12222-4652 , 0.04, EN TrA , 0.17. The scattered data and small amplitudes preclude any finding for the remaining stars. It is unfortunate that the SAAO observations of IRAS 08544-4431 were made when the amplitude was relatively small. It is only for EN TrA , the star of largest amplitude, that the phase shift typical of Type II Cepheids is clearly seen.
7 Conclusions
The summary of the main conclusions of this contribution is that:
-
•
Our radial velocity monitoring show that post-AGB stars which combine a hot dust component (and hence have a disc) and a low photospheric pulsational amplitude (de Ruyter et al. 2006) are binaries. Even in these objects, the amplitude of the radial velocity variations induced by the pulsation is a significant fraction of the orbital velocity. It is an observational challenge to prove the binary nature of all post-AGB objects with a hot dust component, as in many systems large amplitude pulsations are present. Nevertheless the fact that 100 % of our low amplitude pulsator programme stars are binaries is a significant indication that binarity is a prerequisite for disc formation.
-
•
We confirm and strengthen the conclusion of Kiss et al. (2007) that complex multi-periodic but low-amplitude pulsational behaviour is present at the blue side of the Type II Cepheid instability strip.
-
•
The evolution of the binaries in the resulting period-eccentricity parameter space is not understood using standard binary evolution channels. Recent theoretical efforts include enhanced mass-loss and an efficient eccentricity pumping mechanism induced by modulation of the mass-loss in the orbital period. Nevertheless the high eccentricity of IRAS 08544-4431 , IRAS 19125+0343 and especially IRAS 19157-0247 (with a period of 120 days and a significant non-zero eccentricity) are detected in systems that are very likely post-common envelope systems and in these systems, the high eccentricity remains very poorly understood. The on average small mass functions imply that mass transfer to the companion has been limited.
-
•
In all systems found so far, the dust in the disc is O-rich. The AGB evolution was likely cut short by the binary interaction event and with the orbital elements found in this work, the systems should be seen as post-interacting binaries rather than canonical post-AGB stars.
-
•
The wide range of orbits and mass function detected here show that the creation of a circumbinary gravitationally bound disc is the final evolutionary product of a wide range of binaries.
Acknowledgements.
The authors want to acknowledge the Geneva Observatory and its staff for the generous time allocation on the Swiss Euler telescope. The IvS acknowledges support from the Fund for Scientific Research of Flanders (FWO) under the grants G.0178.02., G.0703.08, G.0332.06 and G.0470.07. This research was made possible thanks to support from the Research Council of K.U.Leuven under grant GOA/2008/04. We would like to express our appreciation to Grzegorz Pojmanski for his efforts to provide and maintain the ASAS data in a form accessible to the astronomical community.References
- Artymowicz et al. (1991) Artymowicz, P., Clarke, C. J., Lubow, S. H., & Pringle, J. E. 1991, ApJ, 370, L35
- Balick & Frank (2002) Balick, B. & Frank, A. 2002, ARA&A, 40, 439
- Baranne et al. (1979) Baranne, A., Mayor, M., & Poncet, J. L. 1979, Vistas in Astronomy, 23, 279
- Barthès et al. (2000) Barthès, D., Lèbre, A., Gillet, D., & Mauron, N. 2000, A&A, 359, 168
- Berdnikov & Turner (1995) Berdnikov, L. N. & Turner, D. G. 1995, Pis’ma Astronomicheskii Zhurnal, 21, 603
- Bertiau & Grobben (1969) Bertiau, F. C. & Grobben, J. 1969, Ricerche Astronomiche, 8, 1
- Bonačić Marinović et al. (2008) Bonačić Marinović, A. A., Glebbeek, E., & Pols, O. R. 2008, A&A, 480, 797
- Bujarrabal et al. (2005) Bujarrabal, V., Castro-Carrizo, A., Alcolea, J., & Neri, R. 2005, A&A, 441, 1031
- Caldwell et al. (2001) Caldwell, J. A. R., Coulson, I. M., Dean, J. F., & Berdnikov, L. N. 2001, Journal of Astronomical Data, 7, 4
- Cohen et al. (2004) Cohen, M., Van Winckel, H., Bond, H. E., & Gull, T. R. 2004, AJ, 127, 2362
- De Ruyter et al. (2005) De Ruyter, S., Van Winckel, H., Dominik, C., Waters, L. B. F. M., & Dejonghe, H. 2005, A&A, 435, 161
- de Ruyter et al. (2006) de Ruyter, S., van Winckel, H., Maas, T., et al. 2006, A&A, 448, 641
- Deroo et al. (2007) Deroo, P., Acke, B., Verhoelst, T., et al. 2007, A&A, 474, L45
- Deroo et al. (2006) Deroo, P., van Winckel, H., Min, M., et al. 2006, A&A, 00, in press
- Eggen (1986) Eggen, O. J. 1986, AJ, 91, 890
- Fokin et al. (2001) Fokin, A. B., Lèbre, A., Le Coroller, H., & Gillet, D. 2001, A&A, 378, 546
- Frankowski & Jorissen (2007) Frankowski, A. & Jorissen, A. 2007, Baltic Astronomy, 16, 104
- Gauba et al. (2003) Gauba, G., Parthasarathy, M., Kumar, B., Yadav, R. K. S., & Sagar, R. 2003, A&A, 404, 305
- Gielen et al. (2008) Gielen, C., van Winckel, H., Min, M., Waters, L. B. F. M., & Lloyd Evans, T. 2008, A&A, 000, 0000
- Gielen et al. (2007) Gielen, C., van Winckel, H., Waters, L. B. F. M., Min, M., & Dominik, C. 2007, A&A, 475, 629
- Giridhar et al. (2005) Giridhar, S., Lambert, D. L., Reddy, B. E., Gonzalez, G., & Yong, D. 2005, ApJ, 627, 432
- Golay (1980) Golay, M. 1980, Vistas in Astronomy, 24, 141
- Grayzeck (1978) Grayzeck, E. J. 1978, AJ, 83, 1397
- Hadrava (2004) Hadrava, P. 2004, Publications of the Astronomical Institute of the Czechoslovak Academy of Sciences, 92, 1
- Houk et al. (1976) Houk, N., Hartoog, M. R., & Cowley, A. P. 1976, AJ, 81, 116
- Jorissen et al. (2009) Jorissen, A., Frankowski, A., Famaey, B., & Van Eck, S. 2009, ArXiv e-prints
- Kiss et al. (2007) Kiss, L. L., Derekas, A., Szabó, G. M., Bedding, T. R., & Szabados, L. 2007, MNRAS, 375, 1338
- Kwok et al. (1997) Kwok, S., Volk, K., & Bidelman, W. P. 1997, ApJS, 112, 557+
- Le Squeren et al. (1992) Le Squeren, A. M., Sivagnanam, P., Dennefeld, M., & David, P. 1992, A&A, 254, 133
- Lloyd Evans (1985) Lloyd Evans, T. 1985, MNRAS, 217, 493
- Lloyd Evans (1999) Lloyd Evans, T. 1999, in IAU Symp. 191: Asymptotic Giant Branch Stars, Vol. 191, 453+
- Lodders (2003) Lodders, K. 2003, ApJ, 591, 1220
- Lucy & Sweeney (1971) Lucy, L. B. & Sweeney, M. A. 1971, AJ, 76, 544
- Maas et al. (2007) Maas, T., Giridhar, S., & Lambert, D. L. 2007, ApJ, 666, 378
- Maas et al. (2005) Maas, T., Van Winckel, H., & Lloyd Evans, T. 2005, A&A, 429, 297
- Maas et al. (2003) Maas, T., Van Winckel, H., Lloyd Evans, T., et al. 2003, A&A, 405, 271
- Maas et al. (2002) Maas, T., Van Winckel, H., & Waelkens, C. 2002, A&A, 386, 504
- MacConnell & Bidelman (1976) MacConnell, D. J. & Bidelman, W. P. 1976, AJ, 81, 225
- Martinez et al. (2002) Martinez, P., Kilkenny, D. M., Cox, G., et al. 2002, Monthly Notes of the Astronomical Society of South Africa, 61, 102
- Men’shchikov et al. (2002) Men’shchikov, A. B., Schertl, D., Tuthill, P. G., Weigelt, G., & Yungelson, L. R. 2002, A&A, 393, 867
- Menzies et al. (1989) Menzies, J. W., Cousins, A. W. J., Banfield, R. M., & Laing, J. D. 1989, South African Astronomical Observatory Circular, 13, 1
- Miszalski et al. (2009) Miszalski, B., Acker, A., Moffat, A. F. J., Parker, Q. A., & Udalski, A. 2009, A&A, 496, 813
- Moe & De Marco (2006) Moe, M. & De Marco, O. 2006, ApJ, 650, 916
- Parthasarathy et al. (2000) Parthasarathy, M., Vijapurkar, J., & Drilling, J. S. 2000, A&AS, 145, 269
- Pel (1976) Pel, J. W. 1976, A&AS, 24, 413
- Perryman & ESA (1997) Perryman, M. A. C. & ESA, eds. 1997, ESA Special Publication, Vol. 1200, The HIPPARCOS and TYCHO catalogues. Astrometric and photometric star catalogues derived from the ESA HIPPARCOS Space Astrometry Mission
- Pickering (1907) Pickering, E. C. 1907, Astronomische Nachrichten, 175, 333
- Pojmanski (2002) Pojmanski, G. 2002, Acta Astronomica, 52, 397
- Queloz et al. (1999) Queloz, D., Casse, M., & Mayor, M. 1999, in ASP Conf. Ser. 185: IAU Colloq. 170: Precise Stellar Radial Velocities, ed. J. B. Hearnshaw & C. D. Scarfe, 13–+
- Raskin et al. (2004) Raskin, G., Burki, G., Burnet, M., et al. 2004, in Society of Photo-Optical Instrumentation Engineers (SPIE) Conference Series, Vol. 5492, , 830–840
- Reyniers & Cuypers (2005) Reyniers, M. & Cuypers, J. 2005, A&A, 432, 595
- Reyniers & van Winckel (2007) Reyniers, M. & van Winckel, H. 2007, A&A, 463, L1
- Sahai et al. (2007) Sahai, R., Morris, M., Sánchez Contreras, C., & Claussen, M. 2007, AJ, 134, 2200
- Schuerman (1972) Schuerman, D. W. 1972, Ap&SS, 19, 351
- Soker (2000) Soker, N. 2000, A&A, 357, 557
- Stellingwerf (1978) Stellingwerf, R. F. 1978, ApJ, 224, 953
- Stobie (1977) Stobie, R. S. 1977, MNRAS, 180, 631
- Szczerba et al. (2007) Szczerba, R., Siódmiak, N., Stasińska, G., & Borkowski, J. 2007, A&A, 469, 799
- Tout & Eggleton (1988) Tout, C. A. & Eggleton, P. P. 1988, MNRAS, 231, 823
- Van Winckel (1997) Van Winckel, H. 1997, A&A, 319, 561
- Van Winckel (2003) Van Winckel, H. 2003, ARA&A, 41, 391
- Van Winckel (2007) Van Winckel, H. 2007, Baltic Astronomy, 16, 112
- Van Winckel et al. (1992) Van Winckel, H., Mathis, J. S., & Waelkens, C. 1992, Nature, 356, 500
- Van Winckel et al. (1999) Van Winckel, H., Waelkens, C., Fernie, J. D., & Waters, L. B. F. M. 1999, A&A, 343, 202
- Van Winckel et al. (1998) Van Winckel, H., Waelkens, C., Waters, L. B. F. M., et al. 1998, A&A, 336, L17
- Waelkens et al. (1996) Waelkens, C., Van Winckel, H., Waters, L. B. F. M., & Bakker, E. J. 1996, A&A, 314, L17
- Waters et al. (1992) Waters, L. B. F. M., Trams, N. R., & Waelkens, C. 1992, A&A, 262, L37
- Zijlstra (2007) Zijlstra, A. A. 2007, Baltic Astronomy, 16, 79