Protein folding on rugged energy landscapes: Conformational diffusion on fractal networks
Abstract
We employ simulations of model proteins to study folding on rugged energy landscapes. We construct “first-passage” networks as the system transitions from unfolded to native states. The nodes and bonds in these networks correspond to basins and transitions between them in the energy landscape. We find power-laws between the folding time and number of nodes and bonds. We show that these scalings are determined by the fractal properties of first-passage networks. Reliable folding is possible in systems with rugged energy landscapes because first passage networks have small fractal dimension.
Understanding how proteins reliably fold to their native conformations despite frustration in the form of non-native interactions between residues is an important, open question. Advances in experimental techniques, such as single-molecule fluorescence eatonscience and fast thermal quenching methods fastfolding , have enabled a quantitative characterization of the dynamics that occur during folding of single proteins. For example, we now know that a large number of metastable conformations are sampled during the folding and unfolding processes, as observed in folding stability tertiary and mechanical denaturation pulling studies.
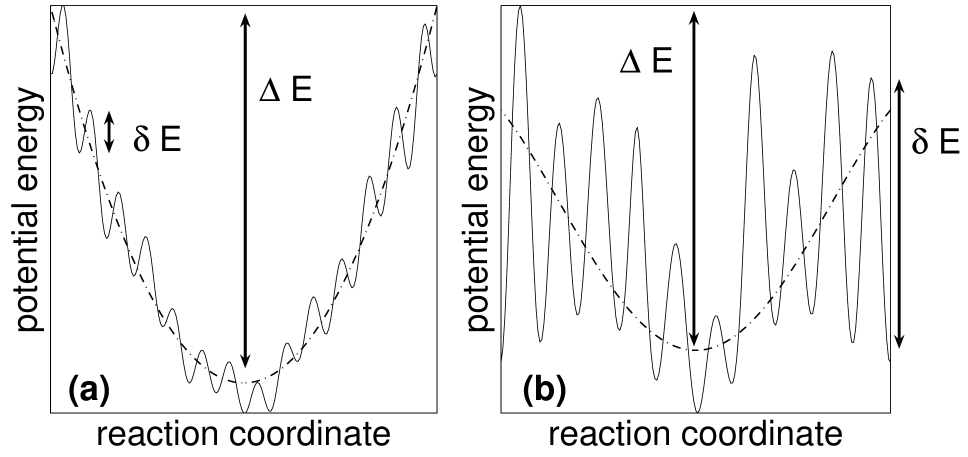
How does a protein fold reliably to its native conformation even though a large number of metastable states exist? For over twenty years the answer to this question has been the principle of minimal frustration minimalfrustration . Within this framework, one recognizes that metastable states are present, but assumes that the barriers separating local energy minima are sufficiently low that there is still a large thermodynamic force driving folding to the native state funnel . This idea is illustrated by the funneled energy landscape in Fig. 1 (a), where the roughness scale is much smaller than depth of the energy minimum that drives folding (). While the funneled energy landscape may explain how some proteins fold reliably bryngelson , a different picture, i.e. rugged energy landscapes may describe folding in metastable metastablefold and intrinsically disordered pappu proteins, as well as misfolding csoto . Rugged energy landscapes, as shown in Fig. 1 (b), possess a roughness scale that is comparable to that of the smooth funnel . In this limit, the thermodynamic drive to fold is absent on biological timescales, and protein conformational dynamics proceed via activation over energy barriers with only local knowledge of the landscape.
What physical observables differentiate proteins with funneled versus rugged landscapes? This is a difficult question to answer since, although funneled energy landscapes have been studied extensively, virtually no research has focused on reliable folding in proteins with rugged energy landscapes. We make a crucial first step in answering this question by studying the properties of a model protein that reliably folds to its native state on a rugged energy landscape with distinct basins sampled during folding. (A basin is a region of configuration space, or collection of conformations, that relaxes to a single local energy minimum when thermal fluctuations are suppressed stillinger .) Instead of discrete pathways through the energy landscape, we find a statistical ensemble of pathways with large fluctuations in folding times. The folding time and number of distinct basins sampled during folding scale as a power-law, which suggests that reliable folding on rugged landscapes can be described as conformational diffusion on a fractal network of basins.
Heteropolymer model: To study proteins with rugged energy landscapes, simulation models should possess three key features: (1) unique native state, (2) many metastable, local energy minima, and (3) large energy barriers that separate local minima so that . Further, we must be able to search configuration space in a reasonable amount of computer time, which excludes all-atom simulations. In these studies, we will focus on a model heteropolymer that exhibits features (1)-(3).
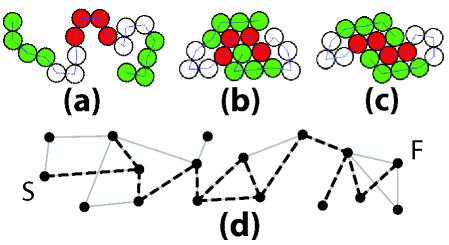
We model proteins as heteropolymers composed of equal-sized spherical monomers with hydrophobic and hydrophilic interactions thirumalai . The model includes hydrophilic monomers (white) and two types of hydrophobic monomers (red and green) as shown in Fig. 2. Green and red monomers interact via an attractive Lennard-Jones potential with minimum energy , except the green monomers on both ends of the chain that interact with minimum energy . All other monomer-monomer interactions are purely repulsive ferp . We also include a FENE potential fenepotential between adjacent monomers to maintain the polymer constraint. We simulate the sequence ggggwwwrrrrwwwgggg, where g,w and r represent green, white and red monomers, respectively. This model displays a complex energy landscape with distinct local energy minima. For simplicity, local minima are defined by the list of contacting green and red monomers footnote2 . The native conformation of this heteropolymer is given by the particular set of green-red contacts shown in Fig. 2 (c).
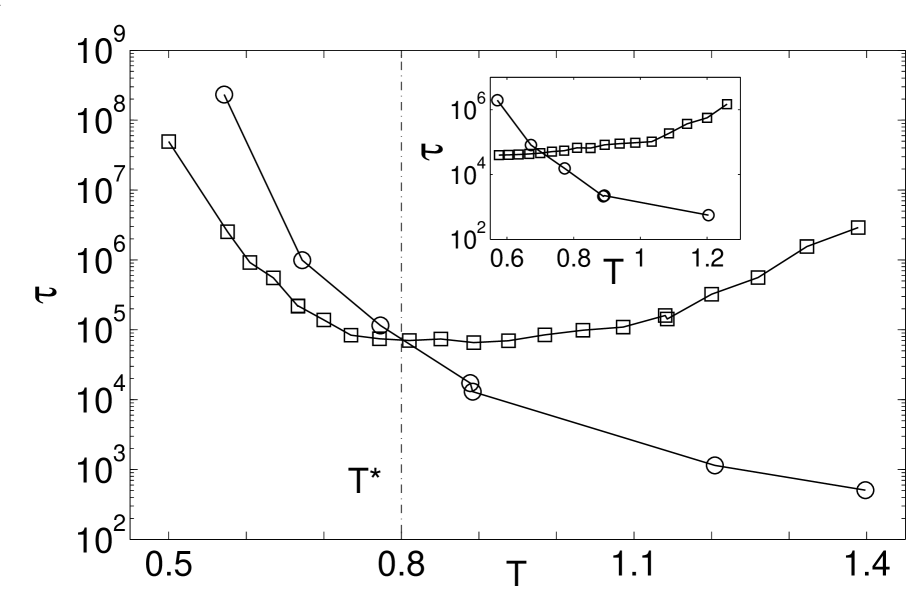
Thermal fluctuations of the heteropolymer are studied using Brownian dynamics, where the temperature is reported in units of the attractive energy, e.g. corresponds to thermal energy . To compare results for rugged and funneled energy landscapes, we also simulated the same heteropolymer with Go-interactions gomodel , where attractive interactions are only included between monomers that form contacts in the native state. The simplest measures of kinetics are the folding and unfolding times shown in Fig. 3. The folding time is calculated by preparing the heteropolymer in an ensemble of extended states and measuring the average folding time to the native state. is the average unfolding time from the native state to any extended state with zero red-green contacts. For temperature , , and the extended conformation is significantly less stable than the native state. The increase in as decreases, as shown in Fig. 3, has been observed in experimental studies of proteins segawa and is a general feature of materials quenched below the glass transition upglass when energy barriers become large compared to . An important feature of the heteropolymer model is that folding only occurs for temperatures where . In contrast, folding simulations of the Go-model yield for all , as shown in the inset to Fig. 3.
First-passage networks: For each heteropolymer conformation, we can determine the list of contacting green and red monomers and uniquely associate this list of contacts with a basin that surrounds the associated local energy minimum. For rugged landscapes, the system will sample a large number of basins as folding proceeds from the extended to the native state. The trajectory of the model protein as it folds can be viewed as a network of connected nodes in configuration space. The nodes represent the basin of a local energy minimum sampled by the system, and bonds that join two nodes represent transitions from one basin to another. These networks are termed “first-passage networks” since they are formed as the protein makes its first passage from an initial to the native conformation. Note that each first-passage network is a subset of all basins and transitions between them, as illustrated in Fig. 2 (d).
We compiled first-passage networks originating from the non-native conformation in Fig. 2 (b) and ending at the native state over a range of . We map the conformation of the heteropolymer to its associated basin every time steps to construct first-passage networks. We assume that the features of the first-passage networks depend on but are independent of the initial state since the first-passage networks are composed of a large number of nodes.
The simplest properties of first-passage networks are the number of distinct basins sampled (nodes) and bonds . Nodes and bonds are only counted once, even if multiple transitions are made between a given set of basins. We also measure the total number of transitions . Fig. 4 shows raw data for the number of bonds and transitions plotted versus the number of nodes using . There are data points for each temperature, each taken from a distinct first-passage network. For all the number of sampled basins, , fluctuates between and , which indicates that the model protein adopts a large number of conformations before arriving at the native state. The wide range of indicates that there is not a single folding pathway, but rather a statistical ensemble of pathways.
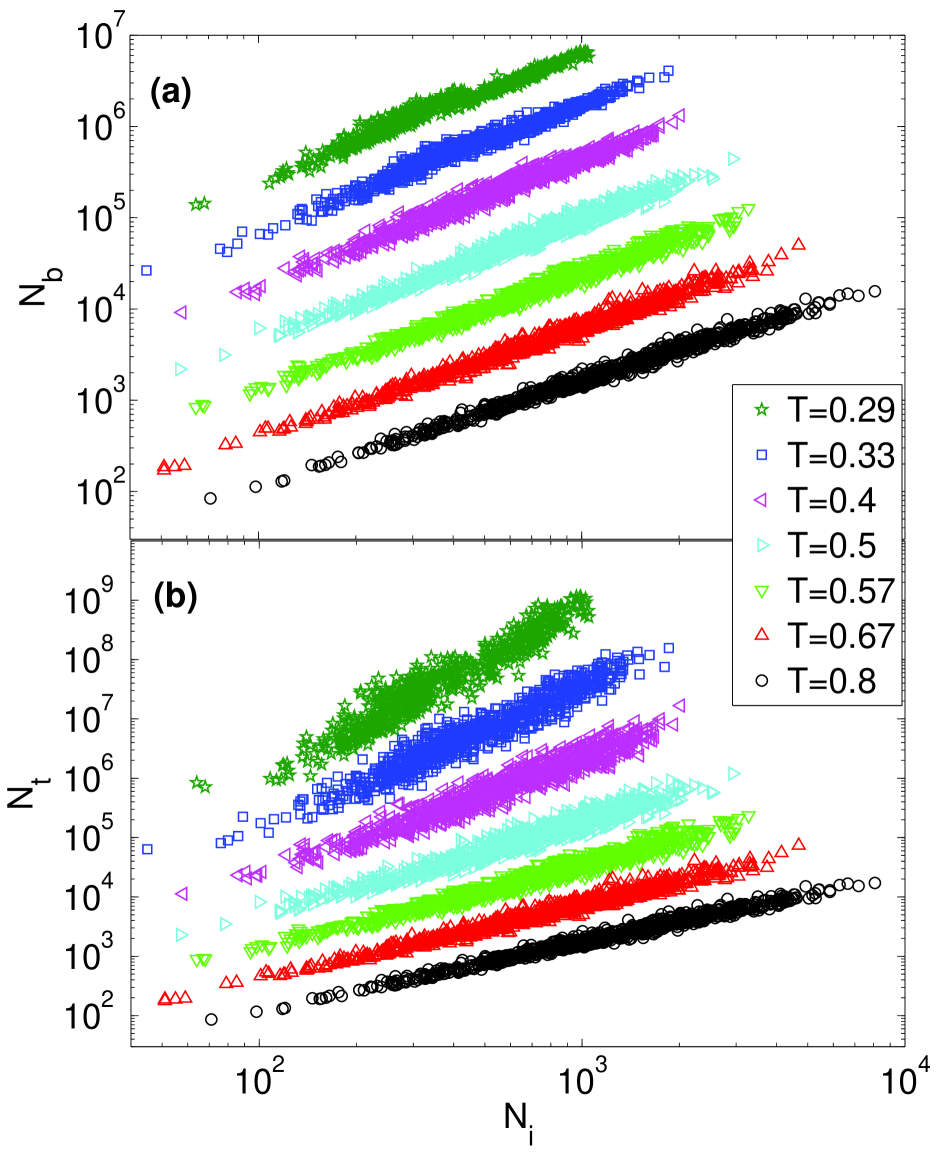
In Fig. 4, , and show strong fluctuations from one realization to the next; however, the fluctuations obey power-law scaling:
| (1) |
This correlation is non-trivial and depends on global properties of first-passage networks. We find that distributions of local features of the network, such as single-jump activation times and distances, and the number of bonds per node, are exponential. Thus, local properties of first-passage networks cannot be responsible for the power-law scaling.
In Fig. 5, we plot the scaling exponents and at different temperatures . While reaches a plateau at at small , continues to increase with decreasing . The increase of is a signature of temperature-dependent exploration of configuration space in systems with rugged landscapes. A system with a rugged energy landscape at energy only samples a small temperature-dependent fraction of conformations at that energy due to large activation barriers. In contrast, at all for the same heteropolymer model with Go-interactions. In systems with funneled energy landscapes (i.e. the Go model), a protein with energy samples conformations with that energy more uniformly.
The data shown in Fig. 4 are obtained by identifying basins every time steps. We have also performed simulations in the range and observe that the exponents and are independent of . These results further indicate that first-passage networks are self-similar and fractal.
Origin of power laws: If we assume that first-passage networks are fractal, we can predict the exponent from the fractal scaling exponents of the network. This assumption will be verified a posteriori.
On any network we can define the chemical distance given by the shortest path between two nodes of the network. This distance is useful because it depends only on network connectivity and is independent of the embedding space footnote1 . For a fractal network, we expect dfractal
| (2) | |||||
| (3) |
where is the number of distinct basins sampled within chemical distance and time interval , is the chemical fractal dimension, and the exponent characterizes the scaling of chemical distance with time.
Given these relations, the correlation between and can be explained as follows. A single first-passage network is formed over folding time , during which the system explores average chemical distance (Eq. 2). Moreover, for a given chemical distance , the number of sampled basins on the first passage network scales as (Eq. 3). Thus, both and are related to , and we find , or
| (4) |
The prediction for relies on the first-passage networks being fractal. In Fig. 6 (a), we test Eq. 2 and observe that grows as a power law at large for all temperatures studied. We average over first-passage networks and only include for each realization. The exponent decreases with , which implies that colder systems explore chemical distance more slowly.
In Fig. 6 (b) we test Eq. 3 and find that, over the limited range of chemical distance accessible to our small heteropolymer, the chemical fractal dimension is well-defined and depends linearly on temperature. is computed by including all sampled basins in different first-passage networks at each . While power-law scaling of only holds for , the average chemical distance explored on a first-passage network is always smaller than . Therefore, the prediction for based on power-law scaling should hold during the folding process. In Fig. 5, we find excellent agreement between the folding-time exponent and our prediction .
We have studied first-passage networks formed by the folding trajectories of a heteropolymer and observed power-law scaling between the folding time () and number of nodes and bonds in first-passage networks. We have also demonstrated that the folding-time exponent can be obtained by measuring the fractal exponents that characterize the structure of first-passage networks in configuration space.
Our results do not describe properties of the complete network of basins in the energy landscape. However, as far as folding is concerned, our results suggest that this network is not relevant. Just as normal diffusion will trace out a two-dimensional fractal network of sampled nodes, no matter how large the dimension of the underlying space is, proteins with rugged energy landscapes also trace out fractal networks that are independent of the complete network. This behavior is not peculiar to proteins with rugged energy landscapes, but is also expected in glass-forming materials at low temperature gppglass . Moreover, decreases with temperature, and is always much smaller than the dimension of configuration space , which implies that . This provides a mechanism by which systems with rugged energy landscapes can fold reliably without kinetic pathways and offers a novel resolution to Levinthal’s paradox levinthal .
Financial support from NSF grant numbers CBET-0348175 (GL,JB), DMS-0835742 (CSO), and DMR-0448838 (CSO), and Yale’s Institute for Nanoscience and Quantum Engineering (GL) is acknowledged.
References
- (1) E. A. Lipman, B. Schuler, O. Bakajin and W. A. Eaton, Science 301, 1233 (2003).
- (2) W. A. Eaton, V. Munoz, P. A. Thompson, C.-K. Chan and J. Hofrichter, Curr. Opin. Struct. Biol. 7, 10 (1997).
- (3) H. Yang, G. Luo, P. Karnchanaphanurach, T.-M. Louie, I. Rech, S. Cova, L. Xun and X. S. Xie, Science 302, 262 (2003); J. Bredenbeck, J. Helbing, J. R. Kumita, G. A. Woolley and P. Hamm, Proc. Natl. Acad. Sci. USA 1̱02, 2379 (2005).
- (4) J. Brujic, R. I. Hermans Z., K. A. Walther and J. M. Fernandez, Nature Physics 2, 282 (2006).
- (5) J. D. Bryngelson and P. G. Wolynes, Proc. Natl. Acad. Sci. USA 84, 7524 (1987).
- (6) J. N. Onuchic, Z. Luthey-Schulten and P. G. Wolynes, Annu. Rev. Phys. Chem. 48, 545 (1997).
- (7) J. D. Bryngelson, J. N. Onuchic, N. D. Socci and P. G. Wolynes, Proteins 21, 167 (1995).
- (8) D. Baker and D. A. Agard, Biochemistry 33, 7505 (1994); J. C. Whisstock and S. P. Bottomley, Curr. Opin. Struct. Bio. 16, 761 (2006).
- (9) A. Vitalis, X. Wang and R. V. Pappu, Biophys. J. 93, 1923 (2007).
- (10) C. Soto, Nature Rev. Neuroscience 4, 49 (2003).
- (11) F. H. Stillinger and T. A. Weber, Phys. Rev. A 25, 978 (1982).
- (12) J. D. Honeycutt and D. Thirumalai, Biopolymers 32, 695 (1992).
- (13) G. Lois, J. Blawzdziewicz and C. S. O’Hern, Biophys. J. 95, 2692 (2008).
- (14) R. M. Jendrejack, M. D. Graham and J. J. de Pablo (2000) J. Chem. Phys. 7, 2894-2900.
- (15) A contact is defined when the distance between two monomers is less than the separation at which the concavity of the Lennard-Jones potential changes sign.
- (16) H. Taketomi, Y. Ueda and N. Go, Int. J. Pept. Protein Res. 7, 445 (1975).
- (17) S.-I. Segawa and M. Sugihara Biopolymers 23, 2473-2488 (1984).
- (18) W. H. Wang, W. Utsumi and X.-L. Wang, Europhys. Lett. 71, 611 (2005).
- (19) We use because the Euclidean distance between basins in configuration space is not uniquely defined.
- (20) R. Orbach, Science 231, 814 (1986); T. Nakayama and K. Yakubo, Rev. Mod. Phys. 66, 381 (1994).
- (21) G. Lois, J. Blawzdziewicz and C. S. O’Hern, Phys. Rev. Lett. 102, 015702 (2009).
- (22) R. Zwanzig, A. Szabo and B. Bagchi, Proc. Natl. Acad. Sci. USA 89, 20 (1992).