Valence Fluctuations Revealed by Magnetic Field and Pressure Scans: Comparison with Experiments in YbXCu4 (X=In, Ag, Cd) and CeYIn5 (Y=Ir, Rh)
Abstract
The mechanism of how critical end points of the first-order valence transition (FOVT) are controlled by a magnetic field is discussed. We demonstrate that critical temperature is suppressed to be a quantum critical point (QCP) by a magnetic field. This results explain the field dependence of the isostructural FOVT observed in Ce metal and . Magnetic field scan can make the system reenter in a critical valence fluctuation region. Even in intermediate-valence materials, the QCP is induced by applying a magnetic field, at which magnetic susceptibility also diverges. The driving force of the field-induced QCP is shown to be a cooperative phenomenon of the Zeeman effect and the Kondo effect, which creates a distinct energy scale from the Kondo temperature. The key concept is that the closeness to the QCP of the FOVT is vital in understanding Ce- and Yb-based heavy-fermions. This explains the peculiar magnetic and transport responses in (Y=Ir, Rh) and metamagnetic transition in for X=In as well as the sharp contrast between X=Ag and Cd.
1 Introduction
Quantum critical phenomena in itinerant fermion systems with strong correlations have attracted much attention in condensed matter physics. When the continuous transition temperature of the magnetically ordered phase is suppressed by controlling material parameters and reaches absolute zero, the quantum critical point (QCP) emerges. In the paramagnetic metal phase near the QCP, enhanced spin fluctuations cause non-Fermi liquid behaviors in physical quantities exhibiting quantum criticalities [1, 2, 3], and even trigger other instabilities such as unconventional superconductivity. So far, the magnetic QCP and the role of spin fluctuations have been extensively discussed from both theoretical [1, 2, 3] and experimental sides [4].
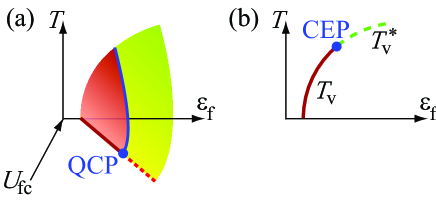
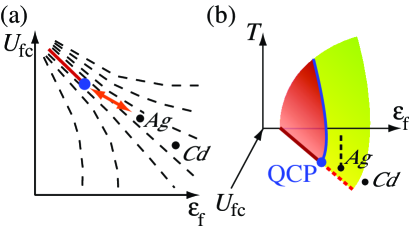
Recently, critical phenomena associated with charge degrees of freedom have attracted attention. In particular, valence instability and its critical fluctuations have attracted much attention as a possible origin of anomalies in Ce- and Yb-based heavy-fermion systems [5, 6]. Valence transition phenomena were closely studied four decades ago under the label of intermediate valence. Evidence of its occurrence comes from the - transition of Ce metal [7] six decades ago (see Fig. 1(a)) with first-order valence transition (FOVT), which in the (temperature , pressure ) plane starts at K and terminates at the critical end point (CEP) ( K, GPa) [8]. As the intercept of the line of the FOVT is rather high at , no quantum criticality was discovered [9]. For many anomalous Ce compounds, no FOVT has been detected despite the fact that their valence deviates from three where the occupation number of the 4f shell is unity; the conditions are such that the system is always in a valence crossover regime, i.e., the system escapes from the CEP but, as will be stressed later, can feel its proximity.
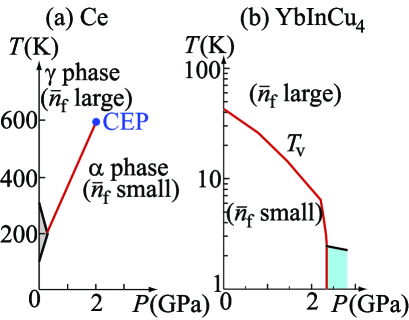
An excellent example of FOVT for Yb systems was reported for YbInCu4 (see Fig. 1(b)) [10, 11, 12, 13, 14], and the Yb case can be regarded as the hole analog of Ce; being the hole occupation number of the 4f shell (14 for Yb2+ and 13 for Yb3+ where ). Although YbInCu4 as well as Ce metal is a prototypical example that shows the FOVT, most Ce- and Yb-based heavy-fermions seem to be in a valence-crossover regime. When the CEP is suppressed by tuning material parameters and enters the Fermi-degeneracy regime, diverging valence fluctuations are considered to be coupled with Fermi-surface instability. This multiple instability seems to give the key mechanism that dominates the low-temperature properties of materials including valence-fluctuating ions such as Ce and Yb. It may play a dominant role in heavy-fermion quantum instabilities.
In Fig. 1(b), with increasing , decreases and even becomes sufficiently low such that FOVT reaches the magnetic boundary [14, 13] clearly in a narrow window. The interplay between valence transition and magnetic transition can be strong. Looking carefully into the disappearance under pressure of long range magnetism in Ce- and Yb-based heavy-fermion systems, this interplay is often strong [9]. There are only a few material series like the [15, 16, 17, 18, 19] series and [9] series where the magnetic QCP at is not coupled with valence fluctuation. Thus, discriminating between valence and spin quantum criticality is often difficult.
The proof of valence fluctuations in the quantum degeneracy regime seems to be supported by evidence of the two-superconductivity mechanism in the - series where GPa [15, 16, 17, 18, 19]. A marked increase in the superconducting transition temperature is observed at a pressure where the valence of Ce changes sharply in [15], [16, 17], and [18, 19]. The importance of quantum criticality is shown above by the observation of non-Fermi liquid -linear resistivity in wide temperature region. The -linear resistivity has been observed in a variety of Ce- and Yb-based heavy-fermion systems [6].
Theoretically, the possibility of the valence-fluctuation-mediated superconductivity in the - phase diagram of CeCu2Ge2 was pointed out in ref. \citenMNO. It was shown that the -linear resistivity emerges in a wide temperature range near the QCP of the valence transition [16]. Residual resistivity was also shown to be markedly enhanced when the system is tuned to approach the QCP by controlling and/or the concentration of the chemical doping [20]. Near the QCP, the superconducting transition temperature was shown to be enhanced by valence fluctuations on the basis of the slave-boson mean-field theory taking account of its Gaussian fluctuations [21]. The stability and lattice-structure dependence of density-fluctuation-mediated superconductivity were argued phenomenologically [22].
Recent numerical studies have revealed the significance of valence fluctuations near the QCP of the FOVT [23] and clarified its new aspects: The emergence of unconventional superconductivity due to an anomalous increase in the coherence of quasiparticles near the QCP, and the absence of phase separation as well as non diverging total charge compressibility even at the QCP at least in electronic origin due to the non conserving order parameter of the valence transition [23].
In phase diagrams of heavy-fermion systems, magnetic, valence, and superconductivity boundaries can seriously cause interference. This suggests the idea that this interplay also occurs in the (, magnetic field ) plane for close to near the QEP. Valence fluctuations are essentially relative charge fluctuations between f and conduction electrons. Hence, it is highly nontrivial how magnetic field affects the valence QCP as well as QEP. To resolve these fundamental issues, we have theoretically studied the magnetic field dependence of the critical points of the FOVT [24].
In this paper, we report the mechanism of how the QCP as well as the CEP of the FOVT is controlled by a magnetic field in great detail. We discuss how this newly clarified mechanism gives an explanation of unresolved observations in Ce- and Yb-based systems. First, we show how critical end temperature is suppressed to absolute zero by applying a magnetic field, which explains the field dependence of the isostructural FOVT temperature observed in Ce metal and YbInCu4. Our results also explain the peculiar magnetic response in CeIrIn5, where the first-order transition line emerges in the temperature-magnetic field phase diagram, giving rise to the increase in residual resistivity as well as the appearance of the -linear resistivity. The differences in the location of the material with respect to CEP explains the sharp contrast between YbAgCu4 and YbCdCu4 in their magnetization curves in spite of the fact that both have nearly the same Kondo temperatures. Our results indicate that the QCP as well as the FOVT is induced even in moderately intermediate valence materials by applying a magnetic field, which causes various anomalies such as non-Fermi liquid behavior in the resistivity, the increase in the residual resisitivity, and diverging magnetic susceptibility. We discuss the significance of the proximity to the critical points of the FOVT to understand unresolved phenomena in Ce- and Yb-based heavy-fermions. The key concept is the closeness to the QCP of the FOVT.
2 First-Order Valence Transition under Magnetic Field at Finite Temperature
To give a quantitative outlook of the field dependence of the valence transition, let us consider the Claudius-Clapeyron relation for the FOVT temperature :
| (1) |
where and denote the magnetization and entropy, respectively, and denotes the magnetic field. Here, K indicates the Kondo regime where the f-electron (hole) density per site is close to 1 in the Ce (Yb)-based system, i.e., and , and MV indicates the “mixed-valence” regime with [25]. Since the magnetization as well as the entropy in the Kondo regime is larger than those in the MV regime, as observed in the specific heat and the uniform susceptibility, it turns out that is suppressed by applying (see Fig. 2(a)). Then, the critical end point is eventually suppressed to K by .
Furthermore, the field dependence of in the zero-temperature limit is also derived using the above relation: For , the entropy shows the -linear behavior in both the Kondo and MV regimes so that is approximated to be proportional to in the case where is smaller than the characteristic energy scales in the Kondo and MV regimes. Noting that is temperature-independent for , we have , leading to with constants , which explains well the observed behavior in the Ce metal [26] and [27] (see Fig. 2(b)). We stress here that our analysis not only provides a firm ground for small- behavior by considering the coherence of electrons essential for low temperature, but also interpolates the high satisfying the relation [29, 26, 27, 28] to zero temperature, since this relation was derived by assuming an isolated atomic entropy [26], which is justified only in the high-temperature regime. Although the above discussion is about the FOVT temperature, it turns out that the critical end temperature is also suppressed, as shown in Figs. 2(a) and 2(b).
According to the Maxwell relation, the volume variation with is related to the pressure derivative of the magnetization proportional to the Pauli susceptibility in this paramagnetic state, and thus inversely proportional to its Kondo temperature. For Ce, decreases under as ; thus, is positive and the system enters in the trivalent state upon increasing . The same occurs for Yb because, now, increases with ; thus, : is negative. The phenomenological dependence of as reported in Fig. 2(a) was derived in agreement with this picture [29].
3 Extended Periodic Anderson Model
Although we have shown that the dependence of the critical temperature can be understood from the viewpoint of the free-energy gain induced by the larger entropy in the Kondo regime, it is highly nontrivial how the QCP of the FOVT is controlled by at . To proceed with our analysis, we introduce a minimal model that describes the essential part of Ce- and Yb-based systems [30, 31, 32, 33, 34, 35, 36]:
| (2) | |||||
where is the annihilation (creation) operator of the conduction electron at the -th site with a spin , and is that of the f electron. The number operator is defined by and for and c. Here, denotes the energy dispersion for conduction electrons. is the f level and is the hybridization between the f and conduction electrons. The effect of applying pressure is to increase both the hybridization and the f-level relatively to the Fermi level, the latter of which plays a more crucial role in the valence transition than the former in Ce and Yb compounds. In other words, the increase in pressure is parameterized essentially by that in .
The on-site Coulomb repulsion for f electrons is given by the term. The term is the Coulomb repulsion between the f and conduction electrons, which is considered to play an important role in the valence transition [30, 31, 32, 33, 34, 35, 36, 21, 23]. Namely, the periodic Anderson model without cannot explain a sharp or discontinuous valence transition as discussed in refs. \citenOM and \citenWIM. For example, in the case of Ce metal that exhibits the - transition, the 4f- and 5d-electron bands are located at the Fermi level [37]. Since both 4f and 5d orbitals are located on the same Ce site, this term cannot be neglected. In Yb systems, is regarded as the annihilation (creation) operator of the f hole and hence denotes the f-hole level. For , a considerable magnitude of the In 5p and Yb 4f hybridization was pointed out by the band-structure calculation [38] and recent high-resolution photoemission spectra have detected a remarkable increase in the magnitude of the p-f hybridization at the FOVT [39]. These results suggest the importance of both and .
The reason why the critical-end temperature is so high, that is as much as 600 K, in Ce metal in contrast to that in can be understood in terms of the difference in the magnitude of . In , originates from the intersite interaction, which should be smaller than that of Ce metal. This view also gives the reason why most Ce and Yb compounds only show valence crossover, but not FOVT. Namely, most of the compounds seem to have a moderate owing to its intersite origin, which is smaller than the critical value for causing a discontinuous jump of the valence. However, even in the valence-crossover regime, underlying effect of valence instability causes intriguing phenomena, as shown below. It should be noted that the importance of the term in playing a crucial role in the isostructural FOVT in in the hole picture of eq. (2) was pointed out in refs. \citenZlatic and \citenGolstev. The last term in eq. (2) is the Zeeman term with being the magnetic field including the g factors.
3.1 Slave-boson mean field theory
We apply the slave-boson-mean-field theory [40, 21] to the Hamiltonian eq. (2) at where the slave-boson-mean-field theory is a reasonable approximation. To describe the state for , we consider instead of in eq. (2) by introducing the slave-boson operator at the -th site to describe the state and require the constraint by the method of the Lagrange multiplier For in eq. (2), we employ mean-field decoupling as By approximating mean fields as uniform ones, i.e., and , the set of mean-field equations is obtained by and as follows:
| (3) | |||||
| (4) | |||||
and the following equation holds for the total electron number:
| (5) |
Here, is the Fermi distribution function and are the lower and upper hybridized bands for a quasiparticle with spin , respectively:
| (6) |
where , , and are defined by , and . The dispersion of the conduction electrons is taken as with being set as the bottom of the conduction band and the density of states is set to satisfy the normalization condition, per spin in three dimension (see inset of Fig. 3). We take as the energy unit and show the results for and the total filling below.
3.2 Properties at zero magnetic field
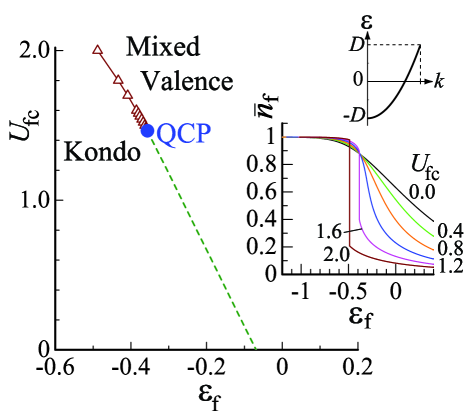
When is deep, the Kondo state with is realized. As increases, electrons move from the f level into the conduction band via hybridization, giving rise to the MV state. Hence, decreases gradually for as shown in the inset of Fig. 3, as calculated using the slave-boson mean-field theory in model (2). As increases, decreases sharply as a function of . For large , shows a discontinuous jump, which indicates the level crossing of the ground states between the Kondo state and the MV state [21, 23, 24]. (see and 2.0 in the inset of Fig. 3). The first-order transition is caused by , since a large forces the electrons to pour into either the f level or the conduction band [23, 24].
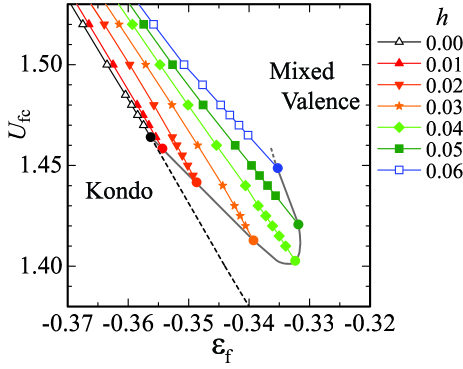
The ground-state phase diagram at a zero magnetic field determined by the slave-boson mean-field theory is shown in Fig. 3. The FOVT line represented by the solid line with open triangles in Fig. 3 satisfies the relation with being the chemical potential [21, 23, 6] in the mean-field framework [41]. This implies that the state with the energy and the state with a conduction electron at the Fermi level with the energy are degenerate, giving rise to the valence transition [21]. The FOVT line terminates at the QCP. The QCP in the - plane is identified to be , at which the jump in disappears and the valence susceptibility
| (7) |
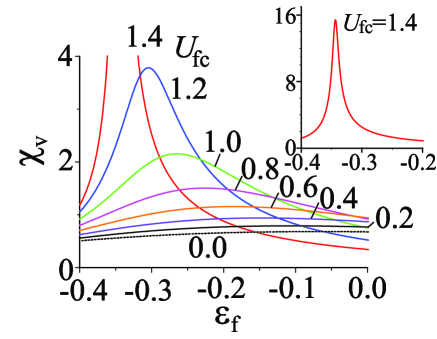
diverges. Namely, valence fluctuations diverge at the QCP. Even for , enhanced valence fluctuations remain [24, 42], as shown by the dashed line in Fig. 3, where has a maximum as a function of for each (see Fig. 4). The valence-crossover line with enhanced regarded as a straight extension of the FOVT line to the regime implies that the valence fluctuations are a result of the degeneracy of the and states, as mentioned above. The characteristic energy scale of the system, the so-called Kondo temperature, which is defined as , is estimated to be at the QCP.
Note that the large Fermi surface is realized in both the Kondo and MV states: Namely, the number of f electrons is always included in the total Fermi volume while keeping the hybridization between f and conduction electrons, as confirmed by the DMRG calculation [23]. This is consistent with the existence of the QCP in the ground-state phase diagram, since by detouring around the QCP, the Kondo and MV states can be adiabatically connected, with Luttinger’s sum rule satisfied.
Note that when the hybridization is decreased (increased), the QCP is shifted to a larger (smaller) and position in Fig. 3, as confirmed by the DMRG calculation as well as the slave-boson mean-field theory [23]. When pressure is applied to the Ce-based compounds such as and , the anion approaches the 4f electron at the Ce site, which makes the f-electron level increase. Since the interorbital Coulomb repulsion and the hybridization also increase under pressure, applying pressure is considered to draw a trajectory line from the left and bottom position to the right and top position in Fig. 3. On the other hand, when pressure is applied to Ce metal, it is expected that the increase in the hybridization will be prominent rather than , because of the monoelemental constitution of the metal. Hence, applying pressure is considered to draw a trajectory line from the left and bottom position to the right and top position in the - plane, instead of in the - plane in Fig. 3. This is consistent with the estimation of model parameters for the - transition in Ce metal based on the analysis of photoemission spectra using the single-impurity Anderson model [43]. The surface of FOVT exists in the parameter space of , , and for the ground state. A trajectory line is drawn in the space for the corresponding experimental parameter, such as pressure in Fig. 2.
In Ce metal, the X-ray edge absorption spectra led to the conclusion that the Ce valence jumps between Ce+3.03 ( phase) and Ce+3.14 ( phase) at K [44]. One may think that the valence change seems to be too small in comparison with our theoretical result shown in the inset of Fig. 3. First, we should note that the above measurement was performed at a rather high temperature (see Fig. 1(a)), and hence the magnitude of the jump at in the inset of Fig. 3 should be markedly reduced by thermal fluctuation effects. While, for qualitatively accurate comparison, it is necessary to use realistic band structures for the f and conduction bands, the momentum dependence of the hybridization, and the Coulomb interactions and in the model (2), it should be noted that when the symmetry of the wave function of hybridized conduction electrons is the same as that of f electrons, the X-ray absorption measurement detects the spectra as it comes from f electrons. Hence, there is a tendency that this type of measurement underestimates the magnitude of the valence jump.
A key parameter for describing valence instabilities is the interorbital Coulomb repulsion , as mentioned above. For Ce metal, the onsite has a considerable value giving [45] and hence the FOVT is considered to occur at a very high critical end temperature of about 600 K. In the Ce-based compounds such as , , and , originates from its intersite Coulomb repulsion and hence is reduced from the onsite value, which seems to comparable to . Namely, these compounds seem to be located in the valence crossover regime (although the sharp peak of the residual resistivity and the sharp drop of the coefficient in the resistivity under pressure suggest that these are rather close to the QCP [15, 16, 18, 19]).
Here, we should also comment on the magnetically ordered phase, which can appear in the ground-state phase diagram in Fig. 3 depending on the strength of . Although we focus on the nature of the FOVT line with the QCP and hence the magnetically ordered phase is not shown in Fig. 3, the magnetically ordered phase is considered to be realized in the Kondo regime, which is basically located in the small- region in Fig. 3. Then, in the valence-crossover regime for , as increases, the magnetic order is suppressed and the paramagnetic metal phase appears. In the paramagnetic metal phase, as further increases, the Kondo state is changed to the MV state at the valence-crossover point represented by the dashed line in Fig. 3. We note that in the Kondo regime near the QCP in Fig. 3, the superconducting correlation is enhanced, which was shown by the slave-boson mean field theory taking into account the Gaussian fluctuations [21] and the DMRG calculation [23] applied to eq. (2). This seems to correspond to the - phase diagrams of CeCu2Ge2 [15], [16], and [18, 19], where with application, the antiferromagnetic (AF) order is suppressed and in the narrow pressure range just before a sharp valence increase of Ce, the superconducting transition temperature is enhanced. We also note that the reason why the superconducting correlation is enhanced was clarified by the unbiased calculation [23]: The coherence of electrons with large valence fluctuations is enhanced in the Kondo regime near the QCP, giving rise to an enhanced pairing correlation (see ref. \citenWIM for details).
We also note that the nontrivial result has been obtained by the DMRG calculation on the model (2): Total charge compressibility is defined by
| (8) |
with being the total filling and not diverging even at the QCP [23, 42]. This is in sharp contrast to the mean-field result where the phase separation is accompanied by the FOVT in the ground-state phase diagram, giving rise to diverging . In the mean field framework, the valence fluctuation, i.e., relative charge fluctuation diverges at the valence QCP, which triggers the total charge instability as well. However, when quantum fluctuations and electron correlations are taken into account correctly, diverges at the valence QCP, but remains finite [23, 42]. This has been clarified to be due to the fact that the order parameter of the valence transition is not a conserving quantity; [23]. The system can be unstable with respect to the relative charge fluctuation while keeping the total charge stable (see ref. \citenWIM for details). Hence, it is predicted that, when the material parameters could be experimentally tuned close to the valence QCP, the compressibility is
| (9) |
with being the total electron number not showing divergence at least in electronic origin.
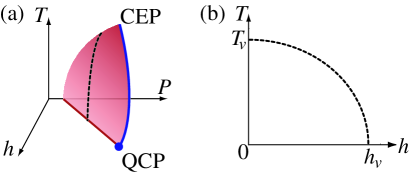
When we add a temperature axis to Fig. 3 at , the phase diagram of the -- space is shown schematically in Fig. 5(a). The first-order transition surface continues to the valence crossover surface. The boundary between the two surfaces forms a critical end line, which reaches K, forming the QCP. At the critical end line as well as at the QCP, the valence susceptibility (7) diverges, i.e., . Note that, even at the valence-crossover surface, valence fluctuations develop well as shown in Fig. 4. Figure 5(b) shows a two-dimensional cut of Fig. 5(a) for a certain : The FOVT line (a solid line) terminates at the critical end point (a filled circle), which continues to the valence crossover line (a dashed line). The reason why is an increasing function of can be understood from the Claudius-Clapeyron relation
| (10) |
where and denote the number of f electrons (or f holes) per site and the entropy, respectively. Note here that the increase in parameterizes that of pressure in our model. We have , since and are satisfied at least in the deep first-order transition region for . Namely, to achieve the free-energy gain caused by the larger entropy, the Kondo phase is realized on the higher- side. Owing to the thermodynamic third law, the first-order transition temperature should be perpendicular to for as understood from eq. (10), which was shown in general cases in ref. \citenWI_thermo.
Valence instability is considered to be coupled to volume variation. Hence, in our model (2), the effect of the hybridization also plays an important role, which might share common aspects with the Kondo-volume-collapse scenario for Ce metal [47]. However, note that the Kondo-volume-collapse scenario assumes a special volume dependence on the Kondo coupling to realize the first-order transition, whose validity should be carefully examined. Actually, it has been pointed out that the Kondo-volume-collapse scenario is not consistent with the isostructural FOVT in by Sarrao [48]: The measured Grüneisen parameter leads to the conclusion that the difference in at the first-order transition should be K for the measured volume change, , which is much less than the measured one K ( and denote the Kondo temperature and volume, respectively). Thus, the volume change is too small to explain the change. In our approach (2), the parameters for each material determine whether they show the FOVT, or the valence crossover, when or pressure (or chemical composition) is changed. Our scenario does not need to assume the special volume dependence on Kondo coupling to cause an FOVT differently from that in the Kondo-volume-collapse scenario.
3.3 Effects of magnetic field
3.3.1 Results by slave-boson mean-field theory
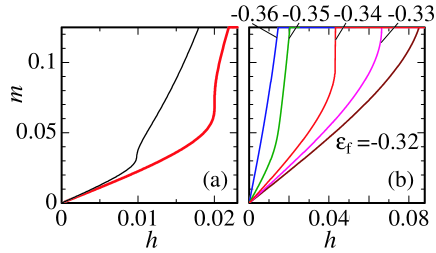
When we apply a magnetic field to the Hamiltonian eq. (2) we find a remarkable result in the valence-crossover regime for . Figure 6(a) shows the relation of the magnetization vs for (thin line) and (bold line), indicating that the metamagnetism (defined by the diverging magnetic susceptibility ) emerges at and 0.02, respectively. To clarify its origin, we determine the FOVT line as well as the QCP under the magnetic field. The result is shown in Fig. 7. It is found that the FOVT line extends to the MV regime and the location of the QCP shifts to a smaller- and smaller- direction, when is applied. This low- behavior of the FOVT line agrees with the low-temperature limit of discussed in § 2, in which the FOVT line extends up to the higher pressure region as is increased as shown in Fig. 2(a).
In Fig. 6(b) we show the - curve at for values ranging from to . The Kondo temperature at is estimated as 0.0353, 0.0873, 0.1346, 0.1611, and 0.1823 for , , , , and , respectively. From these results, the mechanism is understood as follows: At , is originally large for and , since the system is in the MV regime. However, by applying , the QCP is induced, which makes reduces , since the system is forced to be closer to the Kondo regime by . At a magnetic field where the QCP is reached, metamagnetism occurs with the singularity as shown by Millis et al. [49] (see Fig. 6(a)). The uniform susceptibility diverges at the QCP of the FOVT. The phenomena lead to the emergence of strong ferromagnetic fluctuations. Namely, valence fluctuations diverge there, which are essentially charge fluctuations. On the other hand, for and , the QCP is not reached, so that no metamagnetism appears.
Note that this mechanism is different from the ordinary metamagnetism emerging when the magnetic field is applied to the Kondo state, which has been discussed as the origin of the metamagnetism observed in [50, 51, 52, 53, 54, 55, 56]. Namely, the present metamagnetism is caused by the field-induced QCP in the valence-crossover regime at (for moderate and not large in Fig. 7), while the ordinary one is caused in the Kondo regime (for deep and hence , see Fig. 7). It corresponds to the collapse of antiferromagnetic correlations and the emergence of ferromagnetic fluctuation in a sharp window.
An interesting result is shown in Fig. 7, which exhibits a nonmonotonic dependence of the QCP: As increases, the QCP shows an upturn at approximately , which is comparable to at the QCP for . The upturn of the QCP has also been confirmed for a constant density of states . This nontrivial field dependence of the QCP appears in the valence-crossover regime for in Fig. 7 in sharp contrast to the regime for , where is monotonically suppressed by as shown in Fig. 2(b).
3.3.2 RPA description of QCP
The nonmonotonic behavior can be understood from the structure of the valence susceptibility , which is given essentially by the RPA, as discussed in ref. \citenM07. Namely, it is given as
| (11) |
where is the bubble diagram composed of f and conduction electrons. In the Kondo regime (), where f electrons have a predominant spectral weight at approximately with width , is estimated as and is shown to be an increasing function of . Therefore, decreases as is applied until it reaches around , and also decreases. For , mass enhancement () is quickly suppressed and the MV regime is reached. Then, is given as with using the help of shift of the f level towards the Fermi level, i.e., ( being the change in the number of conduction electrons per site due to entry into the MV regime), so that becomes larger than .
3.3.3 Distinct energy scale from Kondo temperature
The magnetic field at QCP when CEP collapses in a magnetic field corresponds to the difference in between and :
| (12) |
A new energy scale distinct from reproduces the closeness to the valence QCP. Under a magnetic field, the proximity of the intermediate-valence crossover regime to QCP can lead to the emergence of metamagnetism with a jump of without initially showing the temperature-driven FOVT at . Thus, it is a field-reentrant FOVT.
3.3.4 DMRG analysis
To examine the mechanism more precisely, we apply the density-matrix-renormalization-group (DMRG) method [57, 58] to eq. (2) in one dimension. Since valence fluctuations are basically ascribed to be of atomic origin, the fundamental properties are expected to be captured even in one dimension [23]. We show here the results for and in eq. (2) at on the lattice with sites (open-boundary condition), as illustrated in the inset of Fig. 8(b). Here, the transfer term for conduction electrons is expressed as . This lattice may be regarded as a one-dimensional mimic of and , which will be discussed in detail in § 4.
For , the relation of vs for , 1.0, and 2.0 is shown in the inset of Fig. 8(a). As increases, the change in as a function of becomes sharp. We show in Fig. 8(a) the magnetization in the MV state for indicated by an arrow in the inset of Fig. 8(a), which is obtained at . A plateau appears at , which is expected to disappear if we take a more realistic choice of parameters, e.g., the momentum dependences of and . The main result is that metamagnetism emerges, as indicated by an arrow.
The increase in with a simultaneous decrease in at is shown in Fig. 8(b). It is caused by the field-induced extension of the QCP to the MV regime. Namely, these results indicate that the mean-field conclusion is not altered even after properly taking into account the quantum fluctuations and electron correlations.
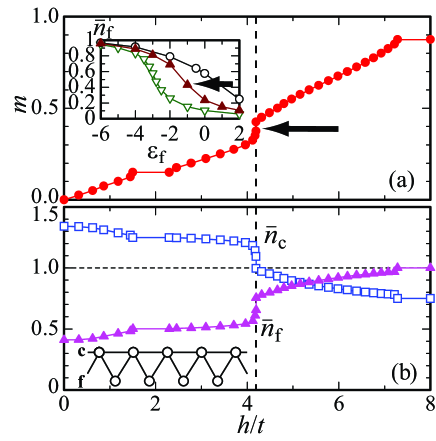
To further explore the nature of this metamagnetism, we calculate and , and we find that decreases slightly at , while increases considerably [24]. Since the Kondo cloud is still formed even at , i.e., , the decrease of is ascribed to the field-induced Kondo effect, which is a consequence of the energy benefit by both the Kondo effect and the Zeeman effect. Although this mechanism itself has been known to work in the Kondo regime [55], this result shows that such a mechanism works in the MV regime as a driving force of the field-induced valence QCP.
3.3.5 Locality of valence transition
The DMRG calculation has shown that the magnetic susceptibility diverges at the QCP of the FOVT under a magnetic field, as shown in Fig. 8(a). It is consistent with the slave-boson mean-field theory shown in Fig. 6(a). The simultaneous divergence of the magnetic and valence susceptibilities at the QCP has been confirmed by the unbiased calculation; in addition the one-dimensional calculation has been shown to be not special. It captures the essential physics of valence transition. The main reason is the locality of the valence transition. Namely, the valence transition has a local atomic origin. Because of this local nature, its basic properties and the ground-state phase diagram of the valence transition do not depend on spatial dimensions. Actually, the DMRG calculation in one dimension has been known to give essentially the same phase diagram determined by the slave boson mean field theory (see ref. \citenWIM). Recently, the same phase diagram has also been obtained by the dynamical mean field theory in infinite dimension [59].
The mean-field result supported by the DMRG result implies that the RPA approach described in § 3.3.2 is qualitatively correct. The validity of the RPA approach is also ensured by the perturbation renormalization group argument. The dynamical exponent of critical valence fluctuations is basically given by , and the condition is marginally satisfied for -dimensional systems [6]. This is a condition for the third-order term in the free-energy expansion to be irrelevant, as discussed by Hertz for the fourth-order term [2]. Then, the universality class of the valence QCP essentially belongs to the Gaussian fixed point, which justifies the RPA approach.
3.3.6 Temperature dependences of FOVT and valence crossover under magnetic field
As shown in § 2, the FOVT temperature is suppressed by applying . We note, however, that the temperature dependence of can change according to the location in the ground-state phase diagram (see Fig. 7). When the system is located at the deep first-order transition side, i.e., at in Fig. 7, is a decreasing function of , as shown in Fig. 2(b). Actually, the proof by the Claudius-Clapeyron relation is based on the fact that and at in eq. (1); this is justified at the deep first-order transition side. Ce metal and YbInCu4 correspond to this case.
On the other hand, near the QCP () as well as in the valence-crossover regime at , a different situation can arise: In the case that at the QCP is not very close to 1 (as is certainly the case for Yb systems [60]), the above relations on magnetization and entropy can change. In addition, details of the trajectory line of the QCP under may severely affect the dependence of . For example, CeIrIn5, which will be discussed in detail in the § 4, is considered to be located in the valence-crossover regime for and the field-induced is considered to increase under , in contrast to those in the cases of Ce metal and YbInCu4.
We have already stressed that a valence-crossover surface exists in the -- space as shown in Fig. 5(a). Hence, even for , the valence crossover surface will be induced by applying a magnetic field, giving rise to an increase in magnetization. The enhancement of the magnetic susceptibility at a certain magnetic field (see Figs. 7 and 5(a)) will lead to a pseudo-metamagnetic effect. Thus, the valence-crossover temperature also forms a line in the - phase diagram.
When is induced by applying , if the system is close to the QCP (namely, is located closely to the filled circles in Fig. 7 under ), the following are expected to be observed in the - phase diagram: (a) The -linear resistivity appears in the wide- range when approaches at which becomes zero. (b) Residual resistivity is enhanced toward and has a maximum at . (c) Magnetic susceptibility has a peak at . (d) NQR frequency changes sharply at , since the charge distribution at the Ce or Yb site and its surrounding ions changes owing to the valence change of Ce or Yb, leading to the change in their electric-field gradient. (e) The lattice constant shows a sharp change at and hence the magnetostriction changes sharply.
When the FOVT is induced by , the above physical quantities show discontinuous jumps at . If the system is close to the QCP, valence-fluctuation-induced anomalies such as the -linear resistivity will also be observed even in this case. Let us conduct a test with experiments.
In a series of Yb- and Ce-based compounds, the above predictions have been actually observed, which will be discussed in detail in the next section.
4 Explanation for and
We here discuss the potentiality of our theory to resolve outstanding puzzles observed in Yb- and Ce-based systems. First, we show how our results explain the isostructural FOVT observed in YbInCu4 and the sharp contrast between YbAgCu4 and YbCdCu4 in their magnetic responses. Second, we focus on the peculiar magnetic response in CeIrIn5, where the first-order transition line emerges in the temperature-magnetic-field phase diagram, giving rise to non-Fermi liquid behavior. Third, we argue that the first-order like disappearance of antiferromagnetism (AF) and the change of de Haas-van Alphen (dHvA) signal observed in at GPa under a magnetic field Tesla may be explained by our model.
4.1 YbXCu4 systems
4.1.1 Isostructural FOVT in YbInCu4
YbInCu4 is known as a typical Yb compound that exhibits the isostructural FOVT at K [10, 11, 61] between the high-temperature phase with Yb+2.97 and the low-temperature phase with Yb+2.84 [62, 63, 64]. Namely, in the hole picture, jumps from 0.97 to 0.84 as temperature decreases. This can be understood qualitatively from the result shown in Fig. 5(a): in the FOVT region, the larger hole-density phase is realized in the high- phase (the Kondo phase), because of the free-energy gain due to the larger entropy. Since this high- phase has a smaller f-electron number, the volume of the system is considered to be small in comparison with that for the low- phase. Hence, as temperature decreases, the first-order transition to the smaller hole-density phase (the MV phase) is realized with volume expansion. The collapse of under a magnetic field was found in macroscopic magnetization measurement, explained in phenomenological approach and well confirmed by microscopic X-ray experiments [64].
As mentioned below eq. (2), the band-structure calculations as well as as photoemission measurements suggest the importance of the and terms in eq. (2) at the FOVT in YbInCu4. Here, we should also note the possibility that band structures such as semimetallic structures also play an important role in the FOVT as pointed out in refs. \citensarraoPhysicaB1999 and \citenFigueroa. Although the accurate estimation of the values of the model parameters of a model Hamiltonian on the basis of first-principles calculations is an important task in the future, we here discuss the basic properties of YbXCu4 on the basis of eq. (2).
4.1.2 Sharp contrast between YbAgCu4 and YbCdCu4
When X=In is used to replace the other elements, YbXCu4 does not show the FOVT, but shows merely the valence crossover. For example, X=Ag [66, 67, 68] and X=Cd [69, 68] for YbXCu4 show neither the FOVT nor the magnetic transition and they have the paramagnetic-metal ground state. The Kondo temperatures of both materials estimated from the magnetic susceptibility data [68] are nearly the same, K. A striking point is that when the magnetic field is applied to these systems, only X=Ag shows a metamagnetic behavior in the magnetization curve, while X=Cd merely shows the gradual increase in magnetization [68].
Our results explain why such a sharp increase in magnetization emerges only for X=Ag, but not for X=Cd in spite of the fact that both have nearly the same ’s. Figure 9 shows the schematic contour plot of the f-hole number per site, , which can also be regarded as the contour plot of the Kondo temperature in the - plane, because is a function of , as in [70]. In the small- and small- region, approaches 1, so that becomes small. In the large- and large- region, is smaller than 1, giving rise to a large . As approaches the QCP from the valence-crossover regime for , contour lines of ’s get close, and at the FOVT line ’s show discontinuous jumps. Since the compounds with X=Ag and X=Cd have nearly the same , both are considered to be located near the same contour area (see Fig. 9). However, the compound with X=Ag appears located more closely to the QCP of the FOVT than X=Cd, with a valence fluctuation energy, i.e., equivalent to a Zeeman energy of approximately 40 T. A sharp increase in magnetization will appear in the case of X=Ag; by applying T, the field-induced QCP of the valence transition (or sharp valence crossover) is reached.
A sharp contrast between YbAgCu4 and YbCdCu4 was also observed in the dependence of the magnetic susceptibility [68]. Although both show nearly the same ’s reflecting the fact that both have nearly the same ’s, a broad maximum in appears at approximately K only in YbAgCu4, but a monotonic decrease in appears in YbCdCu4 as increases. This can be understood if YbAgCu4 reaches the valence crossover surface from a distance of approximately K, while YbCdCu4 reaches it at too large a temperature interval, as shown in Fig. 9(b). Since the magnetic susceptibility has a peak at the valence crossover temperature (see Figs. 6(a) and 8(a)) [42], the peak of at K in YbAgCu4 is explained naturally. Indeed the proximity of to the QCP is reflected in the thermal volume expansion directly linked to the pressure dependence of the entropy: the volume expansion was observed below K [71] simultaneously with the sharp valence crossover from Yb+2.89 to Yb+2.87 in YbAgCu4, in contrast to YbCdCu4 [68].
4.2 CeIrIn5
Our results also explain the peculiar magnetic response in , which shows a jump in the - curve at 42 T [72, 73, 74, 75]. Capan et al. have observed that residual resistivity increases, and the Sommerfeld constant in the specific heat shows a diverging increase toward the metamagnetic-transition field T. Furthermore, they have found that as increases, the power of the resistivity at low temperatures decreases from , and seems to approach judging from the fact that the convex curve appears in the plot [75]. Experimental effort should be made to properly confirm the expectation that the -linear resistivity and the peak of the residual resistivity will be observed around T. Capan et al. have pointed out that these anomalous behaviors may be related to the metamagnetic transition that forms a first-order-transition line in the - phase diagram and that this may be the origin of the non Fermi-liquid normal state observed at , although its mechanism has not yet been clarified.
Our results suggest that the mechanism is the valence fluctuation: This can be readily understood if is located inside the enclosed area of the QCP line for in Fig. 7. Namely, at , the system is considered to be located in the gradual valence-crossover regime (i.e., for in Fig. 7), since no evidence of the first-order transition has been observed at any physical quantities as a function of at . However, when is applied, the QCP of the FOVT reaches and eventually goes across the point of the system, causing metamagnetic transition in the magnetization curve. Since it has been shown theoretically that the residual resistivity is enhanced near the QCP [20] and that the -linear resistivity is expected in a wide- region [16], the observed non-Fermi-liquid behavior is quite consistent. Furthermore, the first-order transition emerges in the - phase diagram in agreement with our predictions.
We here remind the readers of the fact that CeIrIn5 and CeCoIn5 have nearly the same crystalline-electric-field (CEF) structures [76] and that a change in CEF level under a magnetic field cannot explain the metamagnetic increase in magnetization in CeIrIn5, as pointed out in ref. \citenTakeuchi. Also note that almost the same Fermi surfaces in both systems have been obtained by the de Haas-van Alphen measurements as well as the first-principles band structure calculations [77, 78]. However, neither the enhancement of residual resistivity nor the metamagnetic-transition line in the - phase diagram has been observed in CeCoIn5, in contrast to that in the case of CeIrIn5 at zero pressure. These results reemphasize that a distinct energy scale other than the Kondo temperature is indispensable for understanding the Ce115 systems.
In order to directly verify the above scenario, detection of the Ce valence change at in the - phase diagram is highly desired by measurements such as the X-ray adsorption spectra and the NQR electric gradient.
The notable result is that scan can lead to a reentry into the valence critical domain. Our approach assumes a paramagnetic ground state; in some windows, long-range magnetism will appear as in the case of YbInCu4 under pressure ( GPa). As suggested recently, may be a singular spectacular case where in the phase diagram the magnetism and valence fully interact [60]. Such interplay also occurs in CeRhIn5. At zero pressure, CeRhIn5 is a heavy-fermion antiferromagnet with the Neel temperature K. At zero magnetic field, at GPa, a pure superconductivity phase is detected without antiferromagnetism, while under a magnetic field reentrant antiferromagnetism is detected up to GPa.
4.3 CeRhIn5
Sharp valence crossover has also been suggested in under pressure near GPa, where the resistivity , with being the superconducting transition temperature showing a peak, as well as the -linear resistivity in the wide- range emerges [79, 80, 81]. Hence, the sharp valence crossover originating from the QCP of the valence transition may be induced by applying pressure to . Namely, the viewpoint of the closeness to the QCP of the FOVT is important in elucidating the -- (chemical doping) phase diagram of these compounds in a consistent way. The sharp peak of ( K) cannot be explained by the many-body correction due to critical AF fluctuations [82], but can be understood by the enhanced valence fluctuations [20].
Other lines of evidence for the crucial roles of FOVT in CeRhIn5 under the magnetic field are as follows:
1) According to ref. \citenKnevel2008, near GPa under the magnetic field of 15 Tesla, both a effective mass of electrons and the coefficient of the term of the resistivity exhibit a rather sharp enhancement. However, scales with , suggesting that the mass enhancement is mainly driven by the “local correlation effect” (but not due to critical antiferromagnetic fluctuations) just as in the case of the metamagnetic transition of CeRu2Si2 discussed in refs. \citenwataKLM and \citenMI. The enhancement of can be interpreted as that of the quasiparticle density of states near the hybridization gap or pseudo gap, which can be approached at approximately GPa under the magnetic field as the valence changes rapidly or discontinuously with pressure. In other words, the first-order-like disappearance of antiferromagnetism [83, 84, 81] and the change of the dHvA signal observed in CeRhIn5 at GPa under a magnetic field larger than 10 Tesla[85] can be naturally understood as a FOVT induced by the magnetic field.
2) According to ref. \citenKnevel2008, the upper critical field exhibits a rather sharp peak at where the Fermi surface exhibits sharp change from “localized” to “itinerant” under a magnetic field [85], while the superconducting transition temperature is essentially flat around . This fact can be interpreted as an effect of the growth of the paring interaction due to the effect of approaching the magnetic-field-induced critical point of valence transition. Such behavior reminds us of the case of UGe2 at GPa in which a magnetic field induces the metamagnetic transition between two ferromagnetic phases, leading to a sharp increase in with a concave shape [86, 87].
3) The dependence of the low-temperature resistivity has a peak at GPa and the emergence of the -linear dependence of in the vicinity of GPa [79, 80, 81] can be naturally explained by the present mechanism [20, 16].
We stress here that the “localized”-to-“itinerant” change in electron character reported in the dHvA measurement [85] can be explained by the Ce-valence jump or sharp crossover at GPa where the number of f electrons is always included in the total Fermi volume [23, 56], i.e., c-f hybridization is always switched on in sharp contrast to that in the Kondo breakdown scenario [88]. Our mechanism is also consistent with the experimental fact that the effective mass of electrons is enhanced even at with the Sommerfeld constant mJmol-1K-2 [79], which is about 10 times enhanced from the LaRhIn5 value [78, 83], strongly indicating the AF state with the c-f hybridization. Furthermore, the mass enhancement observed toward GPa [85, 81] inside the AF phase can also be explained by the present mechanism. Hence, it should be stressed that the valence QCP itself is the source of locality emerging in CeRhIn5 without invoking a collapse of Kondo temperature.
As shown by the phase diagram of [89], at ambient pressure is moderately far from the AF QCP with a distance of about . A slight increase in the nuclear spin-lattice relaxation rate indicates that moderate spin fluctuations may exist at least at ambient pressure [89]. It has been also reported that the magnetotransport measurements under pressures can be understood from the effects of AF spin fluctuations [90]. However, the clear difference between and emerging in the - phase diagram mentioned in § 4.2 cannot be explained only from the sole viewpoint of the closeness to the AF QCP. In addition to the AF QCP, the influence of the QCP of the FOVT is indispensable for the comprehensive understanding.
Our present viewpoint also gives us a key to resolving the outstanding puzzle about the origin of the superconductivity of CeIrIn5, whose transition temperature increases even though AF spin fluctuation is suppressed under pressure [89]. Since superconductivity will be enhanced near the valence QCP [21, 23], the present viewpoint offers a new scenario that the proximity of QCP of the FOVT is the main origin of the superconductivity. The superconducting window reveals phenomenon other than spin fluctuation; the occurrence of superconductivity is a unique opportunity for scanning through different pairing channels. We have already pointed out in the introduction that in many heavy fermion compounds even for the magnetic QCP the interplay between spin and valence fluctuations is the main reason for collapse of the long-range magnetism.
4.4 Brief summary
Detailed discussions for each material have been given in from § 4.1 to § 4.3. They are briefly summarized as follows:
1) The field dependences of the FOVT in Ce metal and YbInCu4 are clearly explained by our mechanism. The effects of the semimatallic band structure on the FOVT as well as the qualitative evaluation of are issues to be studied in the future for the complete understanding of the valence transition of YbInCu4.
2) The metamagnetism at T and the peak structure in at K in YbAgCu4 but not in YbCdCu4 are naturally explained by our mechanism. The experimental fact that the valence crossover occurs at K for in YbAgCu4 is consistent with our theory. The direct observation of the Yb-valence change under a magnetic field at approximately T at low temperatures is highly desired to confirm our theoretical proposal.
3) We point out that the field-induced FOVT explains the - phase diagram as well as the non-Fermi-liquid critical behavior observed in CeIrIn5. It has been reported that magnetotransport measurement under pressure can be explained by AF spin fluctuations [90]. We think that, in addition to the influence of the AF QCP, the viewpoint of the closeness to the QCP of the FOVT is necessary for the comprehensive understanding of CeIrIn5. To examine our theoretical proposal, it is highly desired to experimentally determine whether the change in Ce valence occurs at the FOVT in the - phase diagram.
4) We point out that the anomalous behaviors at approximately GPa observed in CeRhIn5 can be naturally explained if the FOVT or sharp valence crossover of Ce takes place at such a pressure. We think that such behavior cannot be explained solely by the AF QCP scenario. Our picture gives a natural explanation of the origin of the locality as well as the non-Fermi liquid behavior without relying on artificial assumptions such as the Kondo breakdown. It is highly desired to experimentally determine whether the Ce valence changes at approximately GPa.
On points 3) and 4), a more quantitative evaluation of model parameters including CEF parameters [91] is necessary for elucidating the -- phase diagram toward a complete understanding of the Ce115 system.
5 Conclusions
We have clarified the mechanism of novel phenomena in heavy-fermion systems emerging under a magnetic field and have discussed the significance of the proximity to the FOVT as a potential origin of the anomalous electronic properties of Ce- and Yb-based heavy-fermions. We have shown that FOVT temperature is suppressed by applying a magnetic field, which correctly connects the high-temperature result derived from the atomic picture of the valence-fluctuating ion to the zero-temperature limit consistently with the observations in Ce metal and . The important result is that even in intermediate-valence materials, by applying a magnetic field, the QCP of the FOVT is induced. The QCP shows a nonmonotonic field dependence in the ground-state phase diagram, giving rise to the emergence of metamagnetism with diverging magnetic susceptibility. The driving force of the field-induced QCP is clarified to be a cooperative mechanism of the Zeeman effect and the Kondo effect, which creates a distinct energy scale from the Kondo temperature.
The use of an extended periodic Anderson model explains how quite similar valences may lead to quite different responses. Our model clarifies why metamagnetic behavior appears in but not in , in spite of the fact that both have nearly the same Kondo temperatures. The closeness to the QCP of the FOVT gives the distinct energy scale, which is a key concept to understanding the properties of (X=In, Ag, and Cd) systematically. This viewpoint also explains peculiar magnetic response in where the first-order transition line in the - phase diagram appears with field-induced critical phenomena. The viewpoint of the closeness to the QCP of the FOVT is also indispensable for understanding (Y=In, Co, and Rh) systematically.
As shown in the present study, the QCP of the FOVT and its fluctuations exerts profound influences on Ce- and Yb-based materials as a potential origin of anomalous behavior. Most of such materials are considered to be located in the intermediate valence regime, i.e., in the region for in Fig. 7 due to the intersite origin of . However, by applying a magnetic field, the valence-crossover surface as well as the critical point is induced, which causes various anomalies described in this paper. The valence transition mechanism clarified in this paper can be a key origin of unresolved phenomena in the family of the materials.
Acknowledgments
S. W. and K. M. thank S. Wada and A. Yamamoto for showing us their experimental data prior to publication, with enlightening discussions on their analyses. They also acknowledge H. Harima for helpful discussions about the band structures of Ce- and Yb-based heavy-fermions as well as their model parameters. S. W. is grateful to T. Miyake for estimating the magnitude of the Coulomb repulsions in the model for Ce metal based on first-principles calculations. This work is supported by a Grant-in-Aid for Scientific Research on Priority Areas (No. 18740191) from the Ministry of Education, Culture, Sports, Science, and Technology, Japan, and is supported in part by a Grant-in-Aid for Scientific Research (No. 19340099) by the Japan Society for the Promotion of Science (JSPS). J. F. is supported by the Global COE program (G10) of JSPS for supporting his visit of the Graduate School of Engineering Science at Osaka University where the final stage of this work was performed. Part of our computation has been performed at the supercomputer center at the Institute for Solid State Physics, the University of Tokyo.
References
- [1] T. Moriya: Spin Fluctuations in Itinerant Electron Magnetism (Springer-Verlag, Berlin, 1985).
- [2] J. A. Hertz: Phys. Rev. B 14 (1976) 1165.
- [3] A. J. Millis: Phys. Rev. B 48 (1993) 7183.
- [4] G. R. Stewart: Rev. Mod. Phys. 73 (2001) 797.
- [5] K. Miyake, O. Narikiyo, and Y. Onishi: Physica B 259-261 (1999) 676.
- [6] K. Miyake: J. Phys.: Condens. Matter 19 (2007) 125201.
- [7] P. W. Bridgeman: Proc. Am. Acad. Sci.81 (1952) 165.
- [8] K. A. Gschneidner and L. Eyring: Handbook on the Physics and Chemistry of Rare Earths (North-Holland, Amsterdam, 1978).
- [9] J. Flouquet: in Progress in Low Temperature Physics, ed. W. Halperin (Elsevier, Amsterdam, 2005) Vol. 15, p. 139.
- [10] I. Felner and I. Nowik: Phys. Rev. B 33 (1986) 617.
- [11] K. Kojima, H. Hayashi, A. Minami, Y. Kasamatsu, and T. Hihara: J. Mag. Mag. Mat. 81 (1989) 267.
- [12] J. L. Sarrao, C. D. Immer, C. L. Benton, Z. Fisk, J. M. Lawrence, D. Mandrus, and J. D. Thompson: Phys. Rev. B 54 (1996) 12207.
- [13] T. Mito, T. Koyama, M. Shimoide, S. Wada, T. Muramatsu, T. C. Kobayashi, and J. L. Sarrao: Phys. Rev. B 67 (2003) 224409.
- [14] T. Park, V. A. Sidorov, J. L. Sarrao, and J. D. Thompson: Phys. Rev. Lett. 96 (2006) 046405.
- [15] D. Jaccard, H. Wilhelm, K. Alami-Yadri, and E. Vargoz: Physica B 259-261 (1999) 1.
- [16] A. T. Holmes, , D. Jaccard, and K. Miyake: Phys. Rev. B 69 (2004) 024508.
- [17] K. Fujiwara, Y. Hata, K. Kobayashi, K. Miyoshi, J. Takeuchi, Y. Shimaoka, H. Kotegawa, T. C. Kobayashi C. Geibel, and F. Steglich: J. Phys. Soc. Jpn. 77 (2008) 123711.
- [18] H. Q. Yuan, F. M. Grosche, M. Deppe, C. Geibel, G. Sparn, and F. Steglich: Science 302 (2003) 2104.
- [19] H. Q. Yuan, F. M. Grosche, M. Deppe, C. Geibel, G. Sparn, and F. Steglich: Phys. Rev. Lett. 96 (2006) 047008.
- [20] K. Miyake and H. Maebashi: J. Phys. Soc. Jpn. 71 (2002) 1007.
- [21] Y. Onishi and K. Miyake: J. Phys. Soc. Jpn. 69 (2000) 3955.
- [22] P. Monthoux and G. G. Lonzarich: Phys. Rev. B 69 (2004) 064517.
- [23] S. Watanabe, M. Imada, and K. Miyake: J. Phys. Soc. Jpn. 75 (2006) 043710.
- [24] S. Watanabe, A. Tsuruta, K. Miyake, and J. Flouquet: Phys. Rev. Lett. 100 (2008) 236401.
- [25] We here use the terminology “mixed valence” to indicate spatially uniform and quantum-mechanically valence-fluctuating state with . We refer to the state with a larger than the “mixed-valence” state in the first-order transition as the Kondo state. Note that in the intermediate-coupling regime, in the Kondo state is smaller than 1.
- [26] F. Drymiotis, J. Singleton, N. Harrison, J. C. Lashley, A. Bangura, C. H. Mielke, L. Balicas, Z. Fisk, A. Migliori, and J. L. Smith: J. Phys.: Condens. Matter 17 (2005) L77-L83.
- [27] C. D. Immer, J. L. Sarrao, Z. Fisk, A. Lacerda, C. Mielke, and J. D. Thompson: Phys. Rev. B 56 (1997) 71.
- [28] S. Basu and P. S. Riseborogh: Physica B 378-380 (2006) 686.
- [29] M. O. Dzero, L. P. Gor’kov, and A. K. Zvezdin: J. Phys.: Condens. Matter 12 (2000) L711.
- [30] L. M. Falicov and J. C. Kimball: Phys. Rev. Lett. 22 (1969) 997.
- [31] C. M. Varma: Rev. Mod. Phys. 48 (1976) 219.
- [32] C. E. T. Concalves da Silva and L. M. Falicov: Solid State Commun. 17 (1975) 1521.
- [33] A. C. Hewson and P. S. Riseborough: Solid State Commun. 22 (1977) 379.
- [34] I. Singh, A. K. Ahuja and S. K. Joshi: Solid State Commun. 34 (1980) 65.
- [35] J. K. Freericks and V. Zlatic: Phys. Rev. B 58 (1998) 322.
- [36] A. V. Goltsv and G. Bruls: Phys. Rev. B 63 (2001) 155109.
- [37] W. E. Pickett, A. J. Freeman, and D. D. Koelling: Phys. Rev. B 23 (1981) 1266.
- [38] K. Takegahara and T. Kasuya: J. Phys. Soc. Jpn 59 (1990) 3299.
- [39] K. Yoshikawa, H. Sato, M. Arita, Y. Takeda, K. Hiraoka, K. Kojima, K. Tsuji, H. Namatame, and M. Taniguchi: Phys. Rev. B 72 (2005) 165106.
- [40] N. Read and D. M. Newns: J. Phys. C: Solid State Phys. 16 (1983) 3273.
- [41] Beyond the mean-field framework, the FOVT line has been shown to satisfy in the - plane in the large regime by the thermodynamic relation irrespective of total filling, which has been confirmed by the DMRG calculation. See ref. \citenWIM for details.
- [42] S. Watanabe and K. Miyake: arXiv:0906.3986.
- [43] J. Allen and L. Z. Liu.: Phys. Rev. B 46 (1992) 5047.
- [44] D. Wohlleben and J. Röhler: J. Appl. Phys. 55 (1984) 15.
- [45] T. Miyake: private communications.
- [46] S. Watanabe and M. Imada: J. Phys. Soc. Jpn. 73 (2004) 3341.
- [47] M. Dzero, M. R. Norman, I. Paul, C. Pepin, and J. Schmalian: Phys. Rev. Lett. 97 (2006) 185701.
- [48] J. L. Sarrao: Physica B 259-261 (1999) 128.
- [49] A. J. Millis, A. J. Schofield, G. G. Lonzarich, and S. A. Grigera: Phys. Rev. Lett. 88 (2002) 217204.
- [50] J.-M. Mignot, J. Flouquet, P. Haen, F. Lapierre, L. Puech, and J. Voiron: J. Magn. Magn. Mater. 76-77 (1988) 97.
- [51] T. Sakakibara, T. Tayama, K. Matsuhira, H. Mitamura, H. Amitsuka, K. Maezawa, and Y. nuki: Phys. Rev. B 51 (1995) 12030.
- [52] Y. Aoki, T. D. Matsuda, H. Sugawara, H. Sato, H. Ohkumi, R. Settai, Y. nuki, E. Yamamoto, Y. Haga, A. V. Andreev, V. Sechovsky, L. Havela, H. Ikeda, and K. Miyake: J. Magn. Magn. Mater. 177-181 (1998) 271.
- [53] S. M. M. Evans: J. Magn. Magn. Mater. 108 (1992) 135.
- [54] Y. no: J. Phys. Soc. Jpn. 67 (1998) 2197.
- [55] S. Watanabe: J. Phys. Soc. Jpn. 69 (2000) 2947.
- [56] K. Miyake and H. Ikeda: J. Phys. Soc. Jpn. 75 (2006) 033704.
- [57] S. R. White: Phys. Rev. Lett. 69 (1992) 2863.
- [58] S. R. White: Phys. Rev. B 48 (1993) 10345.
- [59] Y. Saiga, T. Sugibayashi, and D. S. Hirashima: J. Phys. Soc. Jpn. 77 (2008) 114710.
- [60] G. Knebel, R. Boursier, E. Hassinger, G. Lapertot, P. G. Niklowitz, A. Pourret, B. Salce, J. P. Sanchez, I. Sheikin, P. Bonville, H. Harima, and J. Flouquet: J. Phys. Soc. Jpn. 75 (2006) 114709.
- [61] J. L. Sarrao, C. L. Benton, Z. Fisk, J. M. Lawrence, D. Mandrus, and J. D. Thompson: Physica B 223&224 (1996) 366.
- [62] A. L. Cornelius, J. M. Lawrence, J. L. Sarrao, Z. Fisk, M. F. Hundley, G. H. Kwei, J. D. Thompson, C. H. Booth, and F. Bridges: Phys. Rev. B 56 (1997) 7993.
- [63] C. Dallera, M. Grioni, A. Shukla, G. Vanko, J. L. Sarrao, J. P. Rueff, and D. L. Cox: Phys. Rev. Lett. 88 (2002) 196403.
- [64] Y. H. Matsuda, T. Inami, K. Ohwada, Y. Murata, H. Nojiri, Y. Murakami, H. Ohta, W. Zhang, and K. Yoshimura: J. Phys. Soc. Jpn. 76 (2007) 034702.
- [65] E. Figueroa, J. M. Laurence, J. L. Sarrao, Z. Fisk, M. F. Hundley, and J. D. Thompson: Solid State Commun. 106 347.
- [66] C. Rossel, K. N. Yang, M. B. Maple, Z. Fisk, E. Zirngiebl, and J. D. Thompson: Phys. Rev. B 35 (1987) 1914.
- [67] A. Severing, A. P. Murani, J. D. Thompson, Z. Fisk, and C.-K. Loong: Phys. Rev. B 41 (1990) 1739.
- [68] J. L. Sarrao, C. D. Immer, Z. Fisk, C. H. Booth, E. Figueroa, J. M. Lawrence, R. Modler, A. L. Cornelius, M. F. Hundley, G. H. Kwei, J. D. Thompson, and F. Bridges: Phys. Rev. B 59 (1999) 6855.
- [69] K. Hiraoka, K. Kojima, T. Hihara, and T. Shinohara: J. Mag. Mag. Mater. 140-144 (1995) 1243.
- [70] T. M. Rice and K. Ueda: Phys. Rev. B 34 (1986) 6420.
- [71] T. Koyama, M. Matsumoto, T. Tanaka, H. Ishida, T. Mito, S. Wada, and J. L. Sarrao: Phys. Rev. B 66 (2002) 014420.
- [72] T. Takeuchi, T. Inoue, K. Sugiyama, D. Aoki, Y. Tokiwa, Y. Haga, K. Kindo, and Y. nuki: J. Phys. Soc. Jpn. 70 (2001) 877.
- [73] J. S. Kim, J. Alwood, P. Kumar, and G. R. Stewart: Phys. Rev. B 65 (2002) 174520.
- [74] E. C. Parm, T. P. Murphy, D. Hall, S. W. Tozer, R. G. Goodrich, and J. L. Sarrao: Physica B 329-333 (2003) 587.
- [75] C. Capan, A. Bianchi, F. Ronning, A. Lacerda, J. D. Thompson, M. F. Hundley, P. G. Pagliuso, J. L. Sarrao, and R. Movshovich: Phys. Rev. B 70 (2004) 180502.
- [76] A. D. Christianson, E. D. Bauer, J. M. Lawrence, P. S. Riseborough, N. O. Moreno, P. G. Pagliuso, J. L. Sarrao, J. D. Thompson, E. A. Goremychkin, F. R. Trouw, M. P. Hehlen, and R. J. McQueeney: Phys. Rev. B 70 (2004) 134505.
- [77] Y. Haga, Y. Inada, H. Harima, K. Oikawa, M. Murakawa, H. Nakawaki, Y. Tokiwa, D. Aoki, H. Shishido, S. Ikeda, N. Watanabe, and Y. nuki: Phys. Rev. B 63 (2001) 060503.
- [78] H. Shishido, R. Settai, D. Aoki, S. Ikeda, H. Nakawaki, N. Nakamura, T. Iisuka, Y. Inada, K. Sugiyama, T. Takeuchi, K. Kindo, T. C. Kobayashi, Y. Haga, H. Harima, Y. Aoki, T. Namiki, H. Sato, and Y. nuki: J. Phys. Soc. Jpn. 71 (2002) 162.
- [79] H. Hegger, C. Petrovic, E. G. Moshopoulou, M. F. Hundley, J. L. Sarrao, Z. Fisk, and J. D. Thompson: Phys. Rev. Lett. 84 (2000) 4986.
- [80] T. Muramatsu, N. Tateiwa, T. C. Kobayashi, K. Shimizu, K. Amaya, D. Aoki, H. Shishido, Y. Haga, and Y. nuki: J. Phys. Soc. Jpn. 70 (2001) 3362.
- [81] G. Knebel, D. Aoki, J.-P. Brison, and J. Flouquet: J. Phys. Soc. Jpn. 77 (2008) 114704.
- [82] K. Miyake and O. Narikiyo: J. Phys. Soc. Jpn. 71 (2002) 867.
- [83] N. E. Phillips, R. A. Fisher, F. Bouquet, M. F. Hundley, P. G. Pagliuso, J. L. Sarrao, Z. Fisk, and J. D. Thompson: J. Phys.: Condens. Matter 15 (2003) S2095.
- [84] T. Park, F. Ronning, H. Q. Yuan, M. B. Salamon, R. Movshovich, J. L. Sarrao, and J. D. Thompson: Nature 440 (2006) 65.
- [85] H. Shishido, R. Settai, H. Harima, and Y. Ōnuki: J. Phys. Soc. Jpn. 74 (2005) 1103.
- [86] I. Sheikin, A. Huxley, D. Braithwaite, J.-P. Brison, S. Watanabe, K. Miyake, and J. Flouquet: Phys. Rev. B 64 (2001) 220503.
- [87] S. Watanabe and K. Miyake: J. Phys. Soc. Jpn. 71 (2002) 2489.
- [88] T. Park, V. A. Sidorov, R. Ronning, J.-X. Zhu, Y. Tokiwa, H. Lee, E. D. Bauer, R. Movshovich, J. L. Sarrao, and J. D. Thompson: Nature 456 (2008) 366.
- [89] S. Kawasaki, M. Yashima, Y. Mugino, H. Mukuda, Y. Kitaoka, H. Shishido, and Y. nuki: Phys. Rev. Lett. 94 (2005) 037007.
- [90] Y. Nakajima, H. Shishido, H. Nakai, T. Shibauchi, M. Hedo, Y. Uwatoko, T. Matsumoto, R. Settai, Y. nuki, H. Kontani, and Y. Matsuda: Phys. Rev. B 77 (2008) 214504.
- [91] T. Maehira, T. Hotta, K. Ueda, and A. Hasegawa: J. Phys. Soc. Jpn. 72 (2003) 854.