Precision southern hemisphere VLBI pulsar astrometry II: measurement of seven parallaxes
Abstract
Accurate measurement of pulsar distances via astrometry using very long baseline interferometry enables the improvement of Galactic electron density distribution models, improving distance estimates for the vast majority of pulsars for which parallax measurements are unavailable. However, pulsars at southern declinations have been under–represented in previous interferometric astrometry campaigns, due to the dominance of northern hemisphere instrumentation for astrometry. In order to redress this imbalance, we have conducted a two–year astrometric campaign targeting eight southern pulsars with the Australian Long Baseline Array. The program summarized in this paper has resulted in the measurement of seven new pulsar parallaxes, with success on objects down to a mean flux density of 800 Jy at 1600 MHz. Our results highlight the substantial uncertainties that remain when utilizing free electron density models for individual pulsar distances. Until this study, PSR J0630–2834 was believed to convert 16% of its spin–down energy into x–rays, but our measured parallax distance of pc has revised this value to 1%. In contrast, PSR J0108–1431 was found to be almost a factor of two more distant than previously thought, making its conversion of spin–down energy to x–rays the most efficient known (1%). The 8.5 second radio pulsar J2144–3933 was found to be closer than previously predicted, making its apparent 1400 MHz radio luminosity the lowest of any known pulsar (20 Jy kpc2). We have examined the growing population of neutron stars with accurate parallaxes to determine the effect of distance errors on the underlying neutron star velocity distribution, and find that typical distance errors may be biasing the estimated mean pulsar velocity upwards by 5%, and are likely to exaggerate the distribution’s high–velocity tail.
1 Introduction
Studies of pulsars are often plagued by the uncertainty in distance–dependent quantities introduced by the reliance on dispersion measure (DM) distance estimates. Due to the non–uniform distribution of ionized material in the ISM on sub-kpc scales (Cordes et al., 2007), the correspondence between a pulsar’s DM and distance is often uncertain. The two most widely used Galactic electron density distribution models are those presented by Taylor & Cordes (1993), hereafter referred to as TC93, and Cordes & Lazio (2002), hereafter referred to as NE2001. Although distances estimated from these models are typically quoted as being accurate to 20%, previous astrometric pulsar observations have shown that much greater errors are possible for individual objects (e.g. a factor of 2.5 error in the distance for PSR B0656+14; Brisken et al., 2003b).
Independent distance measures to pulsars are extremely valuable, both to enable the confident estimation of distance–dependent parameters for individual pulsars and to refine DM–based distance models for the remainder of the pulsar population. They can be provided from HI absorption measurements (e.g. Koribalski et al., 1995), association with other astrophysical objects (e.g. Camilo et al., 2006), and annual geometric parallax measurements made via timing (e.g. Hotan et al., 2006) or VLBI (e.g. Brisken et al., 2002). Both scientific justifications are more acute at southern declinations, where prior to this observing program only two published VLBI pulsar parallaxes were available (Bailes et al., 1990; Dodson et al., 2003), despite the fact that 70% of known pulsars are located at a declination . Recently, a further four parallaxes have been published for pulsars with declinations between 0 and (Chatterjee et al., 2009). At the present time, however, Galactic electron models still have fewer constraints in the south than at northern declinations, and even the most scientifically desirable targets such as the double pulsar J0737–3039A/B generally have only a DM distance for deriving luminosities, velocities, population sizes and so on.
The eight pulsars targeted by this survey are described in Table 1. Two of these (PSR J1559–4438 and PSR J2048–1616) were chosen simply as relatively bright nearby pulsars on which our data reduction techniques could be tested in the high signal–to–noise regime. The remainder were each chosen because an independent distance measure offered a resolution to an outstanding question surrounding the pulsar. Further constraints on target selection were imposed by the need for relatively uniform distribution around a range of right ascensions, due to observational logistics. Thus, the target selection in no way comprises an unbiased sample of southern hemisphere pulsars; however, as noted above, the paucity of existing parallax measurements in the south means that any additions will be extremely useful in constraining electron density distribution models at these declinations.
The six pulsars selected on scientific merit can be broadly grouped into two categories. The first encompasses those possessing unusual luminosity characteristics (low radio luminosity pulsars PSR J0108–1431 and PSR J2144–3933, and the high x–ray luminosity pulsar PSR J0630–2834) where the primary motivation is to obtain a confident estimate of the pulsar luminosity. The second group encompasses binary pulsars used for tests of general relativity (GR; PSR J0437–4715, PSR J0737–3039A/B and PSR J2145–0750), where accurate distances and velocities are required to calculate kinematic contributions to pulsar timing terms (the Shklovskii effect; Shklovskii, 1970).
In this paper, we summarize our observational strategy in §2, and present the results of the survey in §3. Interpretation of the revised distance measure for each pulsar is presented in §4. While the results for PSR J0437–4715, PSR J0737–3039A/B, and PSR J1559–4438 have been presented previously (Deller et al., 2008, 2009a, 2009b), a summary is included here for completeness. The accuracy of TC93 and NE2001 predictions for pulsar distances are examined in §4, along with an investigation into the likely impacts of distance model errors on derived pulsar population parameters. Our conclusions are presented in §5.
2 Observations
The observational methodology employed has been discussed in detail in Deller et al. (2009b), and a brief overview is presented here. Seven observing sessions111As noted in Deller et al. (2009b), it was necessary to discard the first of eight observed epochs (MJD 53870) due to the probability of uncorrectable ionospheric model errors spanned an 18 month period between August 2006 and February 2008, with a subset of the eight pulsars observed at each epoch, depending on which were closest to parallax extrema. All observations were made at 1650 MHz, with the exception of PSR J0437–4715 which was observed separately at 8400 MHz due to its brightness and narrow pulse profile. A phase reference cycle time of six minutes, allocated equally between calibrator and target, was used for all observations.
Where possible, all six stations of the Australian Long Baseline Array (LBA) were used for observing. However, the Ceduna telescope does not possess a 1600 MHz receiver, and the use of a NASA DSN antenna222The 70m and 34m antennas were used in different epochs in Tidbinbilla was possible only when telescope time was available, which was for roughly half of the observational program. Figure 1 of Deller et al. (2009b) shows representative coverage for 1650 MHz and 8400 MHz observations. While higher data rates were recorded at some stations, the final astrometric processing of the observations utilized four single polarization 16 MHz bands sampled at two bit precision, yielding a total data rate of 256 Mbps per telescope.
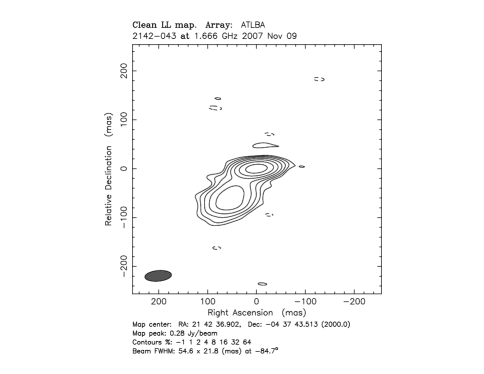
The data were correlated using matched filtering (a more sophisticated pulsar ‘gate’) on pulse profiles with the DiFX software correlator (Deller et al., 2007), which increases the signal to noise ratio of the correlated dataset by weighting the visibility data according to the predicted pulsar flux. The resultant correlated datasets were processed with a pipeline utilising the Parseltongue interface (Kettenis et al., 2006) to AIPS333http://www.aoc.nrao.edu/aips. This pipeline, which is described in detail in Deller et al. (2009b), covered calibration, flagging, geometric and ionospheric model correction, and fringe–fitting, and corrected for reference source structure and pulsar scintillation. Figures 1 and 2 show the composite reference images used for the each phase reference source, and the position centroid used for each calibrator is given in Table 2. Station positions were taken from the global VLBI solution 2008b_astro444http://lacerta.gsfc.nasa.gov/vlbi/solutions/2008b_astro/, which includes new position determinations for the Ceduna, Mopra and ATCA stations as described in Petrov et al. (2009). The calibrated pulsar images produced at each epoch were then fit for position, and the multi–epoch position dataset thus generated was fit for reference position, proper motion and parallax. The astrometric fit at the final stage of the pipeline estimated and attempted to account for the presence of systematic errors in the pulsar position measurements.
3 Results
Of the eight pulsars observed, parallaxes were obtained for seven. The remaining pulsar, PSR J2145–0750, appeared to suffer heavily from refractive scintillation, as was reported during a previous unsuccessful attempt at VLBI astrometry using the VLBA (Brisken et al., 2002). In our observations, it was detected in only two usable epochs, and so while a proper motion can be derived by holding the parallax value fixed over a reasonable range of values, the results should be treated with some caution.
Table 3 summarizes the results for the eight target pulsars. All errors are 1 values obtained using the “inclusive” fit approach described in Deller et al. (2009b), which models the presence of systematic errors. The resultant reduced chi–squared value is 1.0 for all pulsars except PSR J0737–3039A/B (for which the initial fit gave a reduced chi–squared value of 0.79, and hence no additional systematic error component was required). All positions are specified at MJD 54100 (31 December 2006) and errors on positions are fit errors which do not include the several mas uncertainty typical to calibrator positions and constant phase referencing offsets. Table 3 lists the covariances between proper motion and parallax for each pulsar, and shows that the addition of future epochs could considerably improve the parallax precision for PSR J0437–4715 and PSR J2048–1616 in particular.
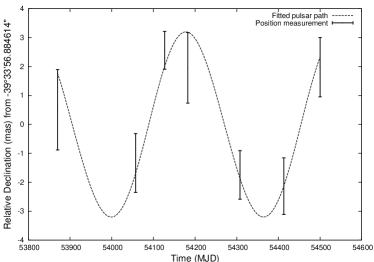
Figures 3–10 plot the results for each pulsar, showing the astrometric fit overlaid on the measured positions with 1 error bars. In each figure, the pulsar position is shown in right ascension and declination in the top panel, while the middle and lower panel show right ascension plotted against time and declination plotted against time respectively. In the lower two panels, the best–fit proper motion has been subtracted for clarity.
As discussed in Deller et al. (2009b), the optimal weighting for visibility data depends on the strength of the pulsar and the magnitude of systematic errors. Following the guidelines developed in Deller et al. (2009b), we used equally–weighted visibility data when the target could be detected in a single epoch using this weighting with a signal to noise ratio (SNR) greater than 10; we have used sensitivity–weighted visibilities when this criterion could not be met. For the strongest pulsars, we have used uniform weighting when imaging to maximise resolution, but natural weighting was used for weaker pulsars where the use of uniform weighting has an adverse effect on single–epoch SNR. These choices are listed in Table 3.
Along with the recent results of Chatterjee et al. (2009), our detection of seven southern hemisphere pulsar parallaxes increases the total number of VLBI pulsar parallaxes in the south to 12, and the total number of published VLBI pulsar parallaxes to 35. Based on the results presented here, it is possible to estimate the number of southern pulsars which remain accessible to the LBA for future parallax studies. The parallax error of 140 as obtained for PSR J0737–3039A/B, which possesses an ungated 1600 MHz flux of only 2-3 mJy, shows that LBA parallax measurements for moderately faint pulsars are possible to distances of several kpc. A search of the ATNF pulsar catalogue555http://www.atnf.csiro.au/research/pulsar/psrcat/ reveals that there are over 30 suitable pulsars (declination , 1400 MHz flux mJy and DM distance kpc) that have not previously been the subject of VLBI astrometry. Future improvements to VLBI instrumentation should rapidly make even more pulsars accessible. Thus, future parallax observations with the LBA could and should continue to redress the imbalance of measured pulsar parallaxes at southern declinations.
The implications of the measured parallax and proper motion for each pulsar are discussed below in §4, along with the implications of the inferred error distribution for distance estimates based upon Galactic electron models and pulsar DMs.
4 Discussion
4.1 PSR J0108–1431
PSR J0108–1431 was first reported by Tauris et al. (1994), and was postulated to be the nearest observed radio pulsar – its DM of 2.38 remains the lowest of any known pulsar. In the TC93 Galactic electron model, PSR J0108–1431 was predicted to lie 130 pc from Earth – in the newer NE2001 model (Cordes & Lazio, 2002), the distance was revised to 184 pc, which if correct would double the pulsar luminosity, to a value of 300 Jy kpc2 at 400 MHz (the lowest known value is that of PSR J0006+1834, which at a DM–derived distance of 700 pc has a predicted 400 MHz luminosity of 100 Jy kpc2).
Figure 3 shows the fitted and measured positions for PSR J0108–1431. As shown in Table 3, the measured distance of pc is just consistent with the NE2001 distance, but inconsistent at 95% confidence with the earlier TC93 distance. It confirms that PSR J0108–1431 is more distant than originally suspected, and while its apparent luminosity is still low, it is no longer remarkably so. In fact, 5 other pulsars (PSR J0006+1834, PSR J1829+2456, PSR J1918+1541, PSR J2015+2524, and PSR J2307+2225) have lower apparent 400 MHz luminosities than the revised value of 510 Jy kpc2 for PSR J0108–1431.
These observations represent the first measurements of the proper motion of PSR J0108–1431, as well as the first distance measurement. Knowing the distance and transverse velocity of PSR J0108–1431 makes it possible to calculate the Shklovskii correction to its period derivative , which is given by:
| (1) |
where is the pulsar distance, is proper motion and is the speed of light. For PSR J0108–1431, the Shklovskii correction to the observed is , or 18% of the observed value of (Hobbs et al., 2004). This correction to allows a more accurate estimate of the pulsar’s spin–down luminosity and characteristic age , where is the neutron star moment of inertia (estimated to be g cm2) and is the braking index, equal to 3 for magnetic dipole braking in a vacuum. For PSR J0108–1431, the value of is revised from erg s-1 to to erg s-1, and the value of is revised from years to years.
PSR J0108–1431 has recently been detected in x–rays (Pavlov et al., 2009), prompting a re–examination of archival optical data and a subsequent optical detection (Mignani et al., 2008). The VLBI position and proper motion presented here confirms that the optical detection of Mignani et al. (2008) is coincident with the pulsar position at the time of the observation. The x–ray emission is consistent with a non–thermal spectrum of presumed magnetospheric origin, while the optical detection was consistent with thermal emission from the bulk of the neutron star surface. For both the x–ray and optical detections, the revised distance measure implies a greater energy output in these wavebands, although the low precision of the parallax measurement means the luminosities remain relatively poorly constrained.
For the x–ray waveband, the combination of revised distance measure and spin–down luminosity implies that PSR J0108–1431 actually converts 1.5% of its spin–down luminosity into x–rays, rather than the value of 0.4% reported in Pavlov et al. (2009). This represents the highest known x–ray conversion efficiency of any pulsar – the distance and hence x–ray conversion efficiency of the previously most efficient pulsar (PSR J0630–2834) has been revised dramatically downwards by the measurements presented here. PSR J0630–2834 is discussed further in §4.3.
In the optical waveband, the upwardly revised luminosity requires either the addition of a large non–thermal component to the emission, or if the emission is solely thermal, a significant increase in the neutron star surface temperature. Any non–thermal optical emission would be generated at a much higher efficiency than other comparable old neutron stars, although the ratio of optical efficiency to x–ray efficiency would be consistent with that found by Zharikov et al. (2004). Unlike PSR B0950+08, the next oldest pulsar with multiwavelength data, the slope of a putative power–law component could not be consistent with that inferred from x–ray observations (Mignani et al., 2008). However, single power law fits are not ubiquitous amongst younger pulsars, and the contribution of non–thermal optical emission to the spectrum of PSR J0108–1431 cannot be discounted.
If negligible magnetospheric optical emission is assumed, the implied surface temperature for PSR J0108–1431 far exceeds that predicted for a neutron star of age yr (Shklovskii–corrected). Scaling the surface temperature obtained by Mignani et al. (2008) by the increased optical luminosity at the best–fit distance of 240 pc yields a surface temperature of K; taking the 95% confidence lower limit for distance (143 pc) and the lower temperature limit given in Mignani et al. (2008) yields a minimum surface temperature of K. According to standard neutron star cooling models, the maximum temperature of an isolated neutron star of age yr should be K if no reheating occurs (see Figure 3 of Schaab et al., 1999). To obtain a temperature above the the 95% lower limit, the neutron star could be no older than yr – an unlikely prospect, as it would require the pulsar’s birth spin period to be at least 770 ms, much higher than typically assumed values (see e.g. Faucher-Giguère & Kaspi, 2006). Improved optical observations are needed to confirm or deny the presence of magnetospheric optical emission, but these results are supportive of the presence of significant reheating for old, isolated neutron stars.
4.2 PSR J0437–4715
The results obtained for PSR J0437–4715 have already been discussed in Deller et al. (2008), and a brief summary is presented here. The fit to the observed pulsar positions is shown in Figure 4. The pulsar distance of pc which is derived from our VLBI astrometry is the most accurate pulsar distance (in both absolute and fractional distance) obtained for any pulsar to date. The comparison of this distance with the “kinematic distance” derived by Verbiest et al. (2008) from the measurement of the rate of change of binary period yields a limit on the maximum apparent acceleration of PSR J0437–4715 along the line of sight to the solar system. As shown in Deller et al. (2008), this can in turn be used to place limits on the maximum rate of change of Newton’s gravitational constant with time ( yr-1, 95% confidence), as well as the maximum mass of any undetected massive planets orbiting the solar system (no Jupiter–mass planets within 226 AU of the solar system barycentre, 95% confidence over 50% of the sky), and the maximum amplitude of the characteristic strain spectrum of the stochastic gravitational wave background (an amplitude of at a period of one year produces inconsistent distances in 95% of simulations).
The covariance between proper motion and parallax for PSR J0437–4715 was the second highest of the pulsars in our sample after PSR J2048–1616. Since considerable time has passed since the end of our observing program, the addition of several new epochs could considerably improve the proper motion and parallax accuracy for PSR J0437–4715. Through simulations, we have estimated that three additional epochs over a year would reduce the parallax uncertainty for PSR J0437–4715 by a further factor of two. This extension to our observing program is the subject of a currently active LBA proposal.
4.3 PSR J0630–2834
PSR J0630–2834 is a middle–aged pulsar which has been observed extensively as part of scintillation studies (see e.g. Cordes, 1986; Bhat et al., 1999), and would be undistinguished if not for its remarkable apparent luminosity in x–rays. Becker et al. (2005) observed PSR J0630–2834 with XMM–Newton and found an x–ray luminosity of erg s-1, based on the NE2001 distance of 1.45 kpc. This implied that the pulsar was converting 16% of its spin–down luminosity into x–rays – an order of magnitude more than any other old or middle–aged pulsar. They suggest that the most likely explanation is that the distance to the pulsar is over–estimated, a theory which has been proven correct by these VLBI observations.
The measured and fitted positions of PSR J0630–2834 are shown in Figure 5. The measured distance of pc, as shown in Table 3, means that the actual x–ray conversion efficiency is a much less surprising %. It is also within the error bars of the efficiency derived for PSR J0108–1431 in §4.1 above. The best–fit distance of 332 pc is less than a quarter of the DM–derived distance in the NE2001 model, and a factor of seven smaller than the distance predicted by the TC93 model. This large discrepancy is discussed further in §4.9.
The proper motion of PSR J0630–2834 has previously been measured using the VLA by Brisken et al. (2003a), and the measured values from this work ( mas yr-1, mas yr-1) are consistent with, but marginally more precise, than the VLA results ( mas yr-1, mas yr-1). The resultant Shklovskii correction is less than 0.04% of the observed period derivative ().
4.4 PSR J0737–3039
The results obtained for PSR J0737–3039 have already been discussed in Deller et al. (2009a), and a brief summary is presented here. The fit to the observed pulsar positions is shown in Figure 6. The measured distance of pc is inconsistent with previous DM–based estimates of 570 pc (TC93) and 480 pc (NE2001), and is much more significant than the marginal timing parallax detection of pc (Kramer et al., 2006).
The kinematic information obtained from these measurements can be used to accurately calculate the Shklovskii term and other kinematic contributions to the binary period derivative of PSR J0737–3039A/B for the first time, allowing an estimation of the precision to which GR can be tested. The measurements reported here reduce the uncertainty on kinematic terms in the observed binary period derivative to 0.01% of the GR contribution, implying that with increasing accuracy of timing observations, tests of GR can be made in the strong–field regime to the 0.01% level. The kinematic information also implies that the transverse velocity of PSR J0737–3039A/B in the local standard of rest (LSR) is only . Given that the system must have survived two supernovae undisrupted, this low velocity is surprising, and lends support to models of formation of the system in which the neutron stars receive low or no kicks at birth (e.g. Piran & Shaviv, 2005).
Finally, the revised distance measure helps to clarify the origin of the bulk of the x–ray emission in the PSR J0737–3039A/B system. A magnetospheric origin for the x–radiation (from pulsar A) had been considered a strong possibility, but the hydrogen column density calculated from fits to the x–ray data had appeared to be unreasonably high, given the presumed location of PSR J0737–3039A/B in the Gum nebula HII region (Possenti et al., 2008). The revised distance measure places the pulsar beyond the Gum nebula and makes the calculated hydrogen column density consistent with expectations.
4.5 PSR J1559–4438
The results obtained for PSR J1559–4438 have already been discussed in Deller et al. (2009b), and a brief summary is presented here. The fit to the observed pulsar positions is shown in Figure 7. At a distance of pc, PSR J1559–4438 is one of the most distant pulsars with a parallax measured using VLBI. The measured distance is consistent with the NE2001 prediction (2350 pc; Cordes & Lazio, 2002), which differed considerably from the earlier TC93 distance estimate of 1580 pc. It is also consistent with the lower distance estimate of kpc made using HI line absorptions by Koribalski et al. (1995). The measured values of proper motion ( mas yr-1, mas yr-1) are consistent with the VLA observations of Fomalont et al. (1997), who measured mas yr-1, mas yr-1.
With an accurate proper motion now calculated, the position angle of the proper motion for PSR J1559–4438 can be compared to the position angle of the emission polarisation, which tests the alignment of the rotation and velocity vector, as described by Johnston et al. (2007). In the case of PSR J1559–4438, the position angle of the proper motion () is not significantly aligned parallel with or perpendicular to the polarisation position angle (). However, as noted in Deller et al. (2009b), the polarisation profile of PSR J1559–4438 (as shown in Figure 5 of Johnston et al. 2007) is complicated, and it is possible that the original determination of the magnetic field orientation from the polarisation position angle was incorrect.
4.6 PSR J2048–1616
PSR J2048–1616 was the second “technique check” source included in the observing program, after PSR J1559–4438. It is less bright than PSR J1559–4438, but was predicted to be somewhat closer (640 pc in the TC93 model, 560 pc in the NE2001 model). As shown in Table 3, whilst a parallax was measured for PSR J2048–1616, it was not significant (1.9). Nevertheless, the best–fit distance of 580 pc is consistent with the DM–based distance estimates, and an accurate measurement of proper motion was made. Figure 8 shows the fitted and measured positions of PSR J2048–1616.
It is apparent from Figure 8 that the large position error of the third epoch (MJD 54182) is the primary reason for the poorly constrained fit. Equipment failure at the Mopra telescope and limited time on the Tidbinbilla telescope during this epoch reduced the number of telescopes on–source during observations of PSR J2048–1616 to three, and thus the large errors are unsurprising. The covariance between proper motion and parallax was the largest for PSR J2048–1616, and hence one or more additional position measurements, preferably close to the appropriate parallax extrema, could have significantly improved the parallax determination.
A considerably more accurate parallax for PSR J2048–1616 has recently been reported by Chatterjee et al. (2009), who observed PSR J2048–1616 along with 13 other pulsars using the VLBA. The parallax of mas obtained by Chatterjee et al. (2009) is consistent with our results (1.710.91 mas), but the proper motion values differ significantly ( mas yr-1, mas yr-1 for Chatterjee et al. 2009; mas yr-1, mas yr-1 from our observations). Combining the epoch position fits from both observing campaigns and allowing a constant offset between the LBA and VLBA epochs yields a fit which is consistent with the VLBA–only values, with similar errors. This is unsurprising since the VLBA epochs, with much lower errors, dominate the fit. Refitting the LBA–only data after fixing the parallax to the VLBA–derived value of mas removes the impact of the covariance with parallax and yields mas yr-1 and mas yr-1; closer to the VLBA–only values, but still differing at the 2 level in right ascension.
Whilst both observing campaigns utilized the same reference source (J2047–1639), they sampled different time periods (2002 – 2005 for Chatterjee et al. 2009, 2006 – 2008 for these observations) and the VLBA observations utilized an in–beam calibrator. The primary calibrator is slightly resolved, as shown in Figure 2, and thus imperfect modeling of its (possibly time varying) structure is a plausible explanation for the proper motion discrepancy. The problem of modeling the structure of resolved calibrator sources is particularly acute for the LBA, due to the limited coverage.
4.7 PSR J2144–3933
PSR J2144–3933 was discovered in the Parkes Southern Pulsar Survey (Manchester et al., 1996), and was initially misidentified with a period of 2.83 seconds. Young et al. (1999) reported that the true period is in fact 8.5 seconds, making PSR J2144–3933 the longest period radio pulsar known. PSR J2144–3933 lies below the traditionally assumed pulsar “death line” (see e.g. Chen & Ruderman, 1993), and hence its true luminosity is extremely important for models of pulsar emission and evolution. The discovery of PSR J2144–3933 prompted alternative models of pulsar emission in which long period pulsars such as PSR J2144–3933 could remain luminous in the radio (e.g. Zhang et al., 2000). PSR J2144–3933 possesses a steeper spectral index than average (), and while several other pulsars are less luminous at 400 MHz, PSR J2144–3933 is the least luminous pulsar known at 1400 MHz (24 Jy kpc2 at assumed distance of 180 pc; average 1400 MHz flux density of 0.75 mJy calculated from archival Parkes observations).
The fitted and measured positions of PSR J2144–3933 are shown in Figure 9. As shown in Table 3, a highly significant parallax was detected, corresponding to a distance of pc. Given the generally assumed errors on DM distances, this is consistent with the TC93 value (180 pc), but not the NE2001 value (264 pc). This confirms that the apparent radio luminosity of PSR J2144–3933 is extremely low – 15% lower than the previously assumed value of 24 Jy kpc2.
The proper motion measurement allows for the first time a calculation of the Shklovskii correction for the period derivative of PSR J2144–3933 – the Shklovskii contribution to is , or approximately 19% of the observed of . The true spin–down luminosity of PSR J2144–3933 is thus further reduced from the assumed value of erg s-1 to erg s-1, the smallest known spin–down luminosity of any pulsar. PSR J0343–3000, discovered in the Parkes High–Latitude survey by Burgay et al. (2006), has the next lowest spin–down luminosity, which is a factor of 5 higher than the revised value for PSR J2144–3933. In addition, this revision to the value for PSR J2144–3933 places it even further past the assumed pulsar “death line”.
As noted by Young et al. (1999), the low luminosity and narrow beaming fraction () of PSR J2144–3933 imply that many such objects exist in the Galaxy. These measurements confirm that the true distributions of pulsar spin–down luminosities and radio luminosities do extend down to very low levels, which is important for the generation of synthetic pulsar catalogues and predictions of discovery rates for instruments such as the Square Kilometre Array (SKA666http://www.skatelescope.org) and LOFAR777http://www.lofar.org/. Assuming the steep spectral index of PSR J2144–3933 is typical for similar long-period, low–luminosity objects, and that the Galactic population of such objects can be estimated from PSR J2144–3933 alone, more than 100,000 similar pulsars may inhabit the Galaxy (Young et al., 1999).
4.8 PSR J2145–0750
PSR J2145–0750 is a binary pulsar with spin period 16.05 ms and orbital period 6.84 days, which was discovered by Bailes et al. (1994). Optical observations by Bell et al. (1995) tentatively identified the expected white dwarf companion to PSR J2145–0750, which was confirmed by Lundgren et al. (1996). Timing astrometry using a 10 year dataset by Löhmer et al. (2004) measured a parallax of mas, and a proper motion of mas yr-1, corresponding to a transverse velocity of . However, Hotan et al. (2006) reported no detection of parallax and an upper limit of 0.9 mas, at 95% confidence, albeit with a shorter (2.5 year) dataset, in addition to a proper motion measurement of mas yr-1. A previous attempt has been made to measure the VLBI parallax of this system by Brisken et al. (2002) using the VLBA, but the pulsar was not detected and dropped from the observing program. Accordingly, the distance to this system is still controversial and confirmation of a previous result is keenly sought.
From the four observations made of PSR J2145–0750 during this observing program, significant detections were made on only two occasions. As was the case for the VLBA program of Brisken et al. (2002), it is believed that refractive scintillation is the major cause of the non–detections, as the pulsar’s flux varies significantly over long timescales. Although measurement of the parallax of PSR J2145–0750 was thus not possible, by holding parallax fixed at zero mas it was possible to measure a proper motion of mas yr-1, mas yr-1. Varying the parallax between zero and two mas results in a change in proper motion of less than 0.1 mas yr-1, much smaller than the formal errors. As the proper motion and position have been derived from only two measurements, there are no degrees of freedom to the fit and no estimate of systematic errors, and so the result should be treated with some caution. The fitted and measured positions of PSR J2145–0750 are shown in Figure 10.
The observed total proper motion of mas yr-1 is consistent with the value of mas yr-1 obtained by Hotan et al. (2006), but only consistent at the 2 level with the value of mas yr-1 obtained by Löhmer et al. (2004)888Since PSR J2145–0750 lies close to the ecliptic, timing observations obtain large covariances between proper motion in right ascension and declination, and so the comparison of total proper motion is more useful.. As these VLBI results are derived from only two measurements, and there is no way of quantifying the systematic error, it is likely that the lower value of proper motion derived from timing (14 mas yr-1) is more accurate for this pulsar.
4.9 Comparison to DM distance models
Galactic electron density distribution models are extremely important for all fields of pulsar research, since their prediction of pulsar distances based on DM has the potential to bias estimates of luminosity, velocity, and various timing terms for the vast majority of pulsars without an independent distance constraint. Hence, continual improvement of these models, and characterisation of errors in the existing models (and the impact of these errors) is a crucial task.
The seven pulsar parallaxes presented here make a substantial addition to the 44 pulsars with published parallaxes, and hence a review of the accuracies of the TC93 and NE2001 models is timely. For the comparison presented below, only pulsars with a parallax more significant than are considered, and where multiple parallax measurements exist, only the most accurate is used. This leads to a sample size of 41 (33 from VLBI and 8 from timing). It is appropriate to note that large distance errors are likely to be over–represented in existing astrometric results. One reason is the selection effect of anomalous pulsars being chosen for study, which was certainly the case for the PSR J0630–2834 system. Another potential factor is that most astrometric distance determinations to date have been for relatively nearby pulsars, where there is less opportunity for underdensities and overdensities in the ISM along the line of sight to cancel, and hence it is plausible that distance models are on average more reliable for more distant pulsars.
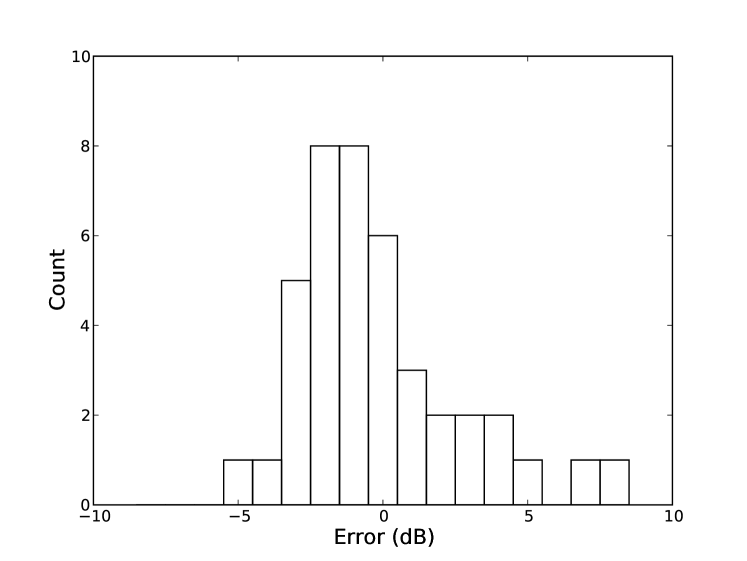
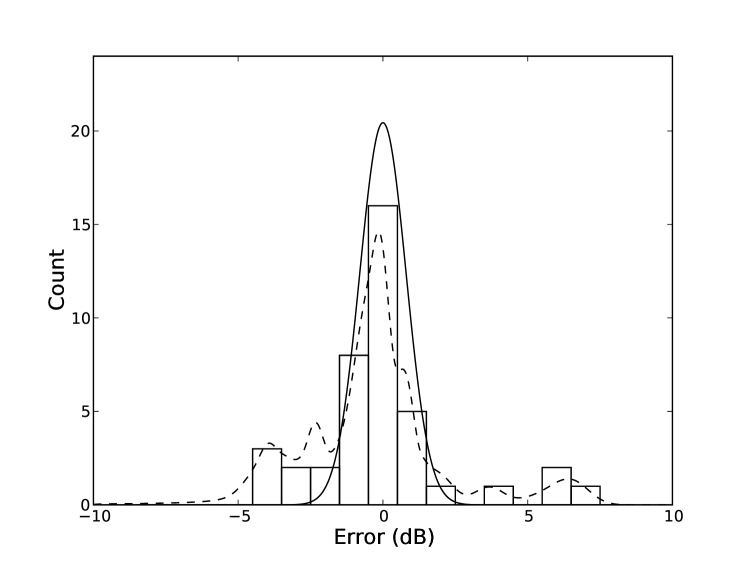
Figure 11 shows a histogram of the observed distance errors for the TC93 model (where the best–fit parallax distances have been assumed to be the correct value), with the error expressed in dB, and binned in 1 dB increments. The error in dB is defined as , and hence positive values represent overestimates, and negative values represent underestimates. Figure 12 repeats this plot for the NE2001 model. Figure 11 shows a clear systematic offset in the median error of the TC93 model towards underestimated distances, but the largest errors are seen when distances are overestimated. Figure 12 shows that systematic bias has been largely removed by the NE2001 model, but the distribution of errors still cannot be well approximated by a single Gaussian model, due to the long wings towards large errors. For both the TC93 and NE2001 models, the largest errors are seen when the distance is overestimated. The effect of these high–error “outliers” on population studies of neutron stars is considered further below.
Estimating the true form of the error distribution shown in Figure 12 is difficult due to the small number of samples. However, the single Gaussian model with standard deviation 0.8 dB plotted as a solid line in Figure 12 shows that the common assumption of 20% errors for DM–based distance estimates is not realistic. In the discussion below, this model (in which 67% of errors are less than a factor of 1.2) is referred to as the traditional error model.
Rather than attempting to discern the true error distribution, we have modeled the distribution by simply summing the probability distribution function of the distance error for each pulsar, which accounts for the possible variation of the true distance from the parallax value. The total probability distribution function was binned in 0.001 dB increments and the result smoothed with a 1 dB Hanning window. This is plotted as a dashed line in Figure 12, and is hereafter referred to as the binned error model. The inclusion of parallax uncertainties acts to broaden the distribution slightly, and somewhat preferentially towards more negative errors. This is caused by a uniform parallax error encompassing a non–uniform distance space, with a greater range of distances if the parallax was overestimated than underestimated (a manifestation of the so–called Lutz–Kelker bias; Lutz & Kelker 1973).
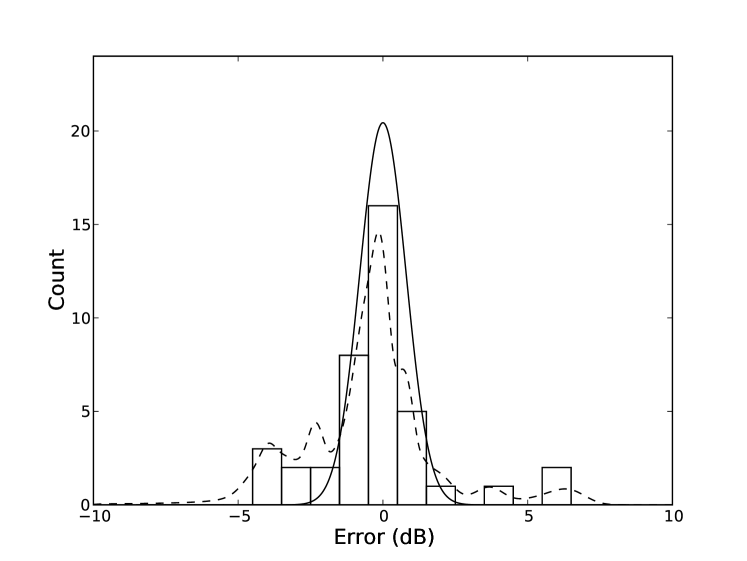
Three pulsars with distance errors 5.5 dB dominate the tail of the NE2001 error distribution with overestimated distances. They are PSR J0613–0200 (NE2001 distance 1700 pc, parallax mas, Hotan et al. 2006), PSR J0630–2834 (NE2001 distance 1450 pc, parallax mas, this work) and PSR B1541+09 (NE2001 distance 35000 pc, parallax mas, Chatterjee et al. 2009). The NE2001 distance of 35 kpc for PSR B1541+09 is somewhat arbitrary, as the NE2001 model does not possess sufficient electrons along the line of sight to PSR B1541+09 to account for its DM, and hence it is placed beyond the edge of the model. This type of shortcoming is rare and can be easily identified, and so we have excluded PSR B1541+09 from the analysis that follows. Figure 13 shows the revised error histogram and binned model. Despite the exclusion of PSR B1541+09, PSR J0630–2834 is still an example of the previously mentioned selection effect bias, and so (as already noted) large errors are likely to be somewhat over–represented in the subsequent analysis. Thus, this model can safely be considered to be a “worst–case” representation of DM distance reliability.
4.10 The pulsar velocity distribution
Although is has been been shown that there is no evidence for systematic bias in the NE2001 distance model, errors exceeding 6 dB still exist for individual pulsars. Such errors can impact upon population analysis of pulsars, artificially creating tails of extremely high or low values of distance–dependent parameters such as luminosity and velocity. This can affect estimates of the mean values of these quantities, as well as confusing attempts to explain the underlying physics by generating false outliers. As an example, the case of neutron star transverse velocities is considered below.
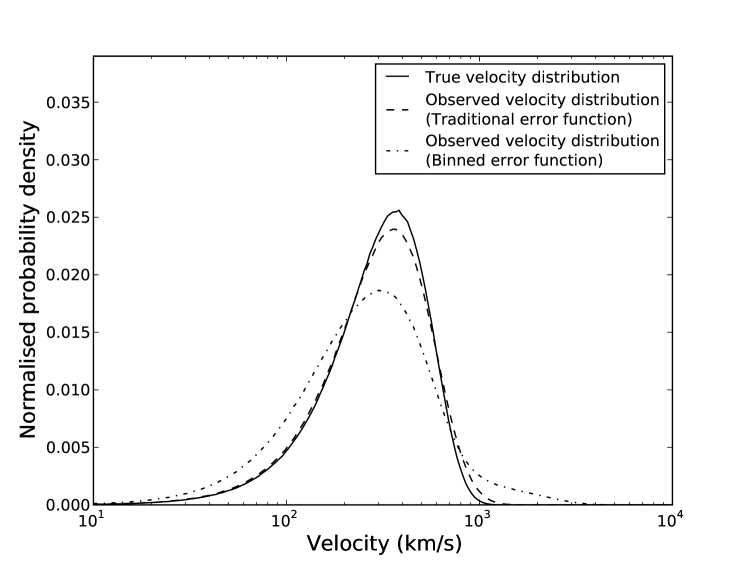
Hobbs et al. (2005) examine a large sample of pulsar proper motions and conclude that the distribution of 3D space velocities of young pulsars (characteristic age Myr) is well fit by a Maxwellian distribution with mean 431 and one–dimensional rms 265 . This velocity distribution is used as the starting point for the simulations that follow. A Monte Carlo simulation was performed, creating a synthetic pulsar catalogue of ten million pulsars, where each pulsar’s actual velocity was drawn from the distribution described above. These are referred to as the unperturbed velocities. No proper motion measurement error was assigned to the unperturbed velocities; more distant pulsars (which possess on average a lower angular proper motion) would be more affected by the presence of a roughly constant proper motion measurement error, which is another small but unmodeled bias which would act to further broaden the observed velocity distribution. The velocities of each pulsar were perturbed according to the binned and the traditional distance error functions described above, and the observed 2D velocity was recorded for each case. The observed 2D velocity distribution for the binned error function and the traditional error function, along with the unperturbed 2D velocity distribution, is plotted in Figure 14.
It is immediately apparent that the broadening of the observed velocity distribution is considerably greater for the binned error model, compared to the traditional error model, and is particularly pronounced at the high end of the velocity distribution. The mean unperturbed 2D velocity is 332 , which is increased by 2% to 338 in the traditional error model, and by 5% to 349 in the binned error model.
More important than the mean effect on pulsar velocities, however, is the effect on the high end of the pulsar velocity distribution. Hobbs et al. (2005) note that distance model inaccuracies could be responsible for the sparse tail of very high velocity pulsars, but conclude that with the small sample size available, the observed high–velocity pulsars are consistent with the tail of a continuous velocity distribution. In considering the impact of distance model errors, it is useful to examine the frequency of occurrence of pulsars with observed transverse speeds greater than 1000 in the synthetic catalogue. These pulsars will be described as very high velocity (VHV) pulsars. In the synthetic catalogue, only 0.1% of pulsars fall into this category in the unperturbed velocity distribution, but the occurrence rises to 0.4% when the traditional error model is applied, and 3.9% for the binned error model. By way of comparison, the ATNF pulsar catalogue contains 216 pulsars with listed transverse velocities – of these, seven exceed 1000 , approximately 3% of the sample.
Thus, distance model errors can add to the high–velocity tail observed in the pulsar velocity distribution, an effect which is significantly enhanced when the distance errors “outliers” are accounted for. These results suggest that the majority of VHV pulsars may in fact simply be pulsars with incorrect distance estimates. As already stated, the binned error model used here is likely to overestimate the true frequency of large errors, and hence the true impact of DM distance errors is likely to lie somewhere in between the binned error model and the traditional error model. Additionally, there is clear evidence that at least some VHV pulsars are present in the Galaxy, with Chatterjee et al. (2005) using VLBA astrometry to show that the transverse velocity of PSR B1508+55 exceeds 1000 , and observations of PSR B2224+65 showing scintillation, proper motion and bow shock results consistent with a velocity close to 1000 (Cordes, 1986; Harrison et al., 1993; Cordes et al., 1993). Nonetheless, the binned error model is useful in illustrating that the largest impact of occasional, rare distance errors is at the high end of the pulsar velocity distribution. A larger, unbiased sample of pulsar distance measurements would enable a more accurate estimation of the true distance error function for NE2001. This would in turn enable the effects of distance errors to be “deconvolved” from the measured pulsar velocity distribution with some confidence, and would lay the framework for a further improved Galactic electron density distribution model to supersede NE2001.
5 Conclusion
Using the Long Baseline Array, we have measured parallaxes for seven pulsars in the sparsely sampled southern sky, a four–fold increase on the previous number of southern VLBI parallaxes. Based on the results of this survey, we conclude that parallaxes could be measured for at least 30 additional southern pulsars using the LBA in its present form, and future enhancement to LBA sensitivity can be expected to allow parallax measurements for an increasing sample of fainter pulsars. The ensemble of independent distance measures obtained from this program will allow significant improvements to Galactic electron models at these latitudes. Two of the measured distances (PSR J0630–2834 and PSR J0737–3039A/B) differed by more than a factor of two from their DM estimates, reinforcing that DM–based distance estimates for individual pulsars should be treated cautiously in the absence of any other distance indicators. Finally, it was shown that DM distance errors could be inflating estimates of both the mean pulsar velocity and the number of very high velocity pulsars, although the current small and biased sample of independent distance measures makes this effect difficult to quantify.
References
- Bailes et al. (1994) Bailes, M., Harrison, P. A., Lorimer, D. R., Johnston, S., Lyne, A. G., Manchester, R. N., D’Amico, N., Nicastro, L., Tauris, T. M., & Robinson, C. 1994, ApJ, 425, L41
- Bailes et al. (1990) Bailes, M., Manchester, R. N., Kesteven, M. J., Norris, R. P., & Reynolds, J. E. 1990, Nature, 343, 240
- Beasley et al. (2002) Beasley, A. J., Gordon, D., Peck, A. B., Petrov, L., MacMillan, D. S., Fomalont, E. B., & Ma, C. 2002, ApJS, 141, 13
- Becker et al. (2005) Becker, W., Jessner, A., Kramer, M., Testa, V., & Howaldt, C. 2005, ApJ, 633, 367
- Bell et al. (1995) Bell, J. F., Kulkarni, S. R., Bailes, M., Leitch, E. M., & Lyne, A. G. 1995, ApJ, 452, L121
- Bhat et al. (1999) Bhat, N. D. R., Rao, A. P., & Gupta, Y. 1999, ApJS, 121, 483
- Brisken et al. (2002) Brisken, W. F., Benson, J. M., Goss, W. M., & Thorsett, S. E. 2002, ApJ, 571, 906
- Brisken et al. (2003a) Brisken, W. F., Fruchter, A. S., Goss, W. M., Herrnstein, R. M., & Thorsett, S. E. 2003a, AJ, 126, 3090
- Brisken et al. (2003b) Brisken, W. F., Thorsett, S. E., Golden, A., & Goss, W. M. 2003b, ApJ, 593, L89
- Burgay et al. (2006) Burgay, M., Joshi, B. C., D’Amico, N., Possenti, A., Lyne, A. G., Manchester, R. N., McLaughlin, M. A., Kramer, M., Camilo, F., & Freire, P. C. C. 2006, MNRAS, 368, 283
- Camilo et al. (2006) Camilo, F., Ransom, S. M., Gaensler, B. M., Slane, P. O., Lorimer, D. R., Reynolds, J., Manchester, R. N., & Murray, S. S. 2006, ApJ, 637, 456
- Chatterjee et al. (2009) Chatterjee, S., Brisken, W. F., Vlemmings, W. H. T., Goss, W. M., Lazio, T. J. W., Cordes, J. M., Thorsett, S. E., Fomalont, E. B., Lyne, A. G., & Kramer, M. 2009, ArXiv e-prints
- Chatterjee et al. (2005) Chatterjee, S., Vlemmings, W. H. T., Brisken, W. F., Lazio, T. J. W., Cordes, J. M., Goss, W. M., Thorsett, S. E., Fomalont, E. B., Lyne, A. G., & Kramer, M. 2005, ApJ, 630, L61
- Chen & Ruderman (1993) Chen, K., & Ruderman, M. 1993, ApJ, 402, 264
- Cordes (1986) Cordes, J. M. 1986, ApJ, 311, 183
- Cordes & Lazio (2002) Cordes, J. M., & Lazio, T. J. W. 2002, ArXiv e-prints, 0207156
- Cordes et al. (2007) Cordes, J. M., Lazio, T. J. W., & Bhat, R. 2007, in Astronomical Society of the Pacific Conference Series, Vol. 365, SINS - Small Ionized and Neutral Structures in the Diffuse Interstellar Medium, ed. M. Haverkorn & W. M. Goss, 233
- Cordes et al. (1993) Cordes, J. M., Romani, R. W., & Lundgren, S. C. 1993, Nature, 362, 133
- Deller et al. (2009a) Deller, A. T., Bailes, M., & Tingay, S. J. 2009a, Science, 323, 1327
- Deller et al. (2007) Deller, A. T., Tingay, S. J., Bailes, M., & West, C. 2007, PASP, 119, 318
- Deller et al. (2009b) Deller, A. T., Tingay, S. J., & Brisken, W. 2009b, ApJ, 690, 198
- Deller et al. (2008) Deller, A. T., Verbiest, J. P. W., Tingay, S. J., & Bailes, M. 2008, ApJ, 685, L67
- Dodson et al. (2003) Dodson, R., Legge, D., Reynolds, J. E., & McCulloch, P. M. 2003, ApJ, 596, 1137
- Faucher-Giguère & Kaspi (2006) Faucher-Giguère, C.-A., & Kaspi, V. M. 2006, ApJ, 643, 332
- Fomalont et al. (1997) Fomalont, E. B., Goss, W. M., Manchester, R. N., & Lyne, A. G. 1997, MNRAS, 286, 81
- Harrison et al. (1993) Harrison, P. A., Lyne, A. G., & Anderson, B. 1993, MNRAS, 261, 113
- Hobbs et al. (2005) Hobbs, G., Lorimer, D. R., Lyne, A. G., & Kramer, M. 2005, MNRAS, 360, 974
- Hobbs et al. (2004) Hobbs, G., Lyne, A. G., Kramer, M., Martin, C. E., & Jordan, C. 2004, MNRAS, 353, 1311
- Hotan et al. (2006) Hotan, A. W., Bailes, M., & Ord, S. M. 2006, MNRAS, 369, 1502
- Johnston et al. (2007) Johnston, S., Kramer, M., Karastergiou, A., Hobbs, G., Ord, S., & Wallman, J. 2007, MNRAS, 381, 1625
- Kettenis et al. (2006) Kettenis, M., van Langevelde, H. J., Reynolds, C., & Cotton, B. 2006, in Astronomical Society of the Pacific Conference Series, Vol. 351, Astronomical Data Analysis Software and Systems XV, ed. C. Gabriel, C. Arviset, D. Ponz, & S. Enrique, 497
- Koribalski et al. (1995) Koribalski, B., Johnston, S., Weisberg, J. M., & Wilson, W. 1995, ApJ, 441, 756
- Kovalev et al. (2007) Kovalev, Y. Y., Petrov, L., Fomalont, E. B., & Gordon, D. 2007, AJ, 133, 1236
- Kramer et al. (2006) Kramer, M., Stairs, I. H., Manchester, R. N., McLaughlin, M. A., Lyne, A. G., Ferdman, R. D., Burgay, M., Lorimer, D. R., Possenti, A., D’Amico, N., Sarkissian, J. M., Hobbs, G. B., Reynolds, J. E., Freire, P. C. C., & Camilo, F. 2006, Science, 314, 97
- Löhmer et al. (2004) Löhmer, O., Kramer, M., Driebe, T., Jessner, A., Mitra, D., & Lyne, A. G. 2004, A&A, 426, 631
- Lundgren et al. (1996) Lundgren, S. C., Cordes, J. M., Foster, R. S., Wolszczan, A., & Camilo, F. 1996, ApJ, 458, L33
- Lutz & Kelker (1973) Lutz, T. E., & Kelker, D. H. 1973, PASP, 85, 573
- Ma et al. (1998) Ma, C., Arias, E. F., Eubanks, T. M., Fey, A. L., Gontier, A.-M., Jacobs, C. S., Sovers, O. J., Archinal, B. A., & Charlot, P. 1998, AJ, 116, 516
- Manchester et al. (1996) Manchester, R. N., Lyne, A. G., D’Amico, N., Bailes, M., Johnston, S., Lorimer, D. R., Harrison, P. A., Nicastro, L., & Bell, J. F. 1996, MNRAS, 279, 1235
- Mignani et al. (2008) Mignani, R. P., Pavlov, G. G., & Kargaltsev, O. 2008, A&A, 488, 1027
- Pavlov et al. (2009) Pavlov, G. G., Kargaltsev, O., Wong, J. A., & Garmire, G. P. 2009, ApJ, 691, 458
- Petrov et al. (2005) Petrov, L., Kovalev, Y. Y., Fomalont, E., & Gordon, D. 2005, AJ, 129, 1163
- Petrov et al. (2009) Petrov, L., Phillips, C., Bertarini, A., Deller, A., Pogrebenko, S., & Mujunen, A. 2009, Publications of the Astronomical Society of Australia, 26, 75
- Piran & Shaviv (2005) Piran, T., & Shaviv, N. J. 2005, Physical Review Letters, 94, 051102
- Possenti et al. (2008) Possenti, A., Rea, N., McLaughlin, M. A., Camilo, F., Kramer, M., Burgay, M., Joshi, B. C., & Lyne, A. G. 2008, ApJ, 680, 654
- Schaab et al. (1999) Schaab, C., Sedrakian, A., Weber, F., & Weigel, M. K. 1999, A&A, 346, 465
- Shklovskii (1970) Shklovskii, I. S. 1970, Soviet Astronomy, 13, 562
- Tauris et al. (1994) Tauris, T. M., Nicastro, L., Johnston, S., Manchester, R. N., Bailes, M., Lyne, A. G., Glowacki, J., Lorimer, D. R., & D’Amico, N. 1994, ApJ, 428, L53
- Taylor & Cordes (1993) Taylor, J. H., & Cordes, J. M. 1993, ApJ, 411, 674
- Verbiest et al. (2008) Verbiest, J. P. W., Bailes, M., van Straten, W., Hobbs, G. B., Edwards, R. T., Manchester, R. N., Bhat, N. D. R., Sarkissian, J. M., Jacoby, B. A., & Kulkarni, S. R. 2008, ApJ, 679, 675
- Young et al. (1999) Young, M. D., Manchester, R. N., & Johnston, S. 1999, Nature, 400, 848
- Zhang et al. (2000) Zhang, B., Harding, A. K., & Muslimov, A. G. 2000, ApJ, 531, L135
- Zharikov et al. (2004) Zharikov, S. V., Shibanov, Y. A., Mennickent, R. E., Komarova, V. N., Koptsevich, A. B., & Tovmassian, G. H. 2004, A&A, 417, 1017
| Pulsar | TC93 distance | NE2001 distance | 1600 MHz | Pulsar | Equivalent gated | Reference | Calibrator/target |
|---|---|---|---|---|---|---|---|
| name | (pc) | (pc) | flux (mJy) | gating gain | 1600 MHz flux (mJy) | source | separation (deg) |
| PSR J0108–1431 | 130 | 180 | 0.8aaPulsar suffers heavily from long timescale scintillation, so individual epochs vary considerably from the average value shown. | 5.1 | 4 | J0111–1317 | 1.5 |
| PSR J0437–4715 | 140 | 190 | 140 | 6.25 | 875 | J0439–4522 | 1.9 |
| PSR J0630–2834 | 2150 | 1450 | 23 | 3.5 | 81 | J0628–2805 | 0.7 |
| PSR J0737–3039A/B | 570 | 570 | 1.6 | 2.5 | 4 | J0738–3025 | 0.4 |
| PSR J1559–4438 | 1600 | 2350 | 40 | 3.6 | 144 | J1604–4441 | 0.9 |
| PSR J2048–1616 | 640 | 560 | 13 | 3.6 | 47 | J2047–1639 | 0.5 |
| PSR J2144–3933 | 180 | 264 | 0.8aaPulsar suffers heavily from long timescale scintillation, so individual epochs vary considerably from the average value shown. | 10 | 8 | J2141–3729 | 2.1 |
| PSR J2145–0750 | 500 | 570 | 8aaPulsar suffers heavily from long timescale scintillation, so individual epochs vary considerably from the average value shown. | 4.3 | 34 | J2142–0437 | 3.3 |
| Source | Right ascension (J2000) | Declination (J2000) | Reference |
|---|---|---|---|
| J0111–1317 | 01h11m56.857962s | 1317’01.19702” | VCS5; Kovalev et al. (2007) |
| J0439–4522 | 04h39m00.854714s | 4922’22.56260” | ICRF; Ma et al. (1998) |
| J0628–2805 | 06h28m43.279032s | 2805’19.38364” | VCS5; Kovalev et al. (2007) |
| B0736–303 | 07h38m19.78785s | 3025’04.8360” | None; see Deller et al. (2009a) |
| J1604–4441 | 16h04m31.020692s | 4441’31.97421” | ICRF; Ma et al. (1998) |
| J2047–1639 | 20h47m19.667018s | 1639’05.84249” | VCS1; Beasley et al. (2002) |
| J2141–3729 | 21h41m52.448964s | 3729’12.99259” | VCS3; Petrov et al. (2005) |
| J2142–0437 | 21h42m36.901688s | 0437’43.51275” | VCS1; Beasley et al. (2002) |
| Parameter | PSR J0108-1431 | PSR J0437–4715 | PSR J0630–2834 | PSR J0737–3039 |
|---|---|---|---|---|
| Right ascension (J2000) | 01:08:08.347016 0.000088 | 04:37:15.883250 0.000003 | 06:30:49.404393 0.000043 | 07:37:51.248419 0.000026 |
| Declination (J2000) | -14:31:50.187139 0.001069 | -47:15:09.031863 0.000037 | -28:34:42.778813 0.000372 | -30:39:40.714310 0.000099 |
| Proper motion in right ascension (; mas yr-1) | 75.05 2.26 | 121.679 0.05 | -46.30 0.99 | -3.82 0.62 |
| Proper motion in declination (; mas yr-1) | -152.54 1.65 | -71.820 0.09 | 21.26 0.52 | 2.13 0.23 |
| Parallax (; mas) | 4.170 1.421 | 6.396 0.054 | 3.009 0.409 | 0.872 0.143 |
| Distance (pc) | ||||
| Transverse velocity (; km s-1) | ||||
| Reference epoch (MJD) | 54100.0 | 54100.0 | 54100.0 | 54100.0 |
| Visibility weighting | Sensitivity | Equal | Equal | Sensitivity |
| Image weighting | Natural | Uniform | Uniform | Natural |
| Average epoch mean fit error (mas) | 1.232 | 0.059 | 0.765 | 0.747 |
| Average intra–epoch systematic error (mas) | 2.477 | 0.068 | 0.839 | 0.939 |
| Average inter–epoch systematic error (mas) | 4.310 | 0.103 | 1.205 | 0.0 |
| Average single–epoch SNR | 8 | 21 | 15 | 17 |
| Covariance of and | 0.27 | -0.39 | -0.01 | -0.01 |
| Covariance of and | 0.00 | 0.60 | -0.10 | -0.06 |
| Parameter | PSR J1559–4438 | PSR J2048–1616 | PSR J2144–3933 | PSR J2145–0750AABased on two detections, with parallax fixed at 0. Variation of the parallax value between 0 and 2 mas results in less than 100 as yr-1 difference in derived proper motion. |
| Right ascension (J2000) | 15:59:41.526126 0.000008 | 20:48:35.640637 0.000040 | 12:44:12.060404 0.000045 | 21:45:50.461901 0.000098 |
| Declination (J2000) | -44:38:45.901778 0.000035 | -16:16:44.553501 0.000147 | -39:33:56.885041 0.000316 | -07:50:18.462388 0.000558 |
| Proper motion in right ascension (; mas yr-1) | 1.52 0.14 | 114.24 0.52 | -57.89 0.88 | -15.43 2.07 |
| Proper motion in declination (; mas yr-1) | 13.15 0.05 | -4.03 0.24 | -155.90 0.54 | -7.67 0.81 |
| Parallax (; mas) | 0.384 0.081 | 1.712 0.909 | 6.051 0.560 | – |
| Distance (pc) | – | |||
| Transverse velocity (; km s-1) | – | |||
| Reference epoch (MJD) | 54100.0 | 54100.0 | 54100.0 | 54100.0 |
| Visibility weighting | Equal | Equal | Equal | Sensitivity |
| Image weighting | Uniform | Uniform | Natural | Natural |
| Average epoch mean fit error (mas) | 0.242 | 0.517 | 1.025 | 2.136 |
| Average intra–epoch systematic error (mas) | 0.259 | 1.282 | 1.450 | 0.0 |
| Average inter–epoch systematic error (mas) | 0.055 | 0.105 | 0.875 | 0.0 |
| Average single–epoch SNR | 50 | 23 | 10 | 8 |
| Covariance of and | -0.43 | 0.78 | 0.23 | – |
| Covariance of and | 0.18 | 0.64 | 0.16 | – |
 |
 |
 |
 |
 |
 |
 |
 |
 |
 |
 |
 |
 |
 |
 |
 |
 |
 |
 |
 |
 |
 |
 |
 |
 |
 |
 |
 |
 |