Four years of optical turbulence monitoring at the
Cerro Tololo Inter-American Observatory (CTIO)
Abstract
The optical turbulence conditions as measured between 2004 until end of 2008 above Cerro Tololo, their seasonal as well as nocturnal behavior are presented. A comparison with the MASS-DIMM system of the Thirty Meter Telescope site testing was conducted and identifies an artificially increased seeing component in the data collected by the CTIO DIMM system under northerly winds. Evidence is shown that this increased turbulence is caused by the telescope dome. A correction for this effect is attempted and applied to the CTIO DIMM data. The MASS data of this comparison campaign allow to set constraints on the general assumption of uniform turbulent layers above a site.
1 Introduction
CTIO on Cerro Tololo is one of the major U.S. observatories in the southern hemisphere. With 2200 m above sea level (a.s.l.) Tololo is a medium high mountain, being located approximately 60 km east of the Pacific Ocean at the southern end of the Chilean Atacama desert. The site testing which led to the selection of this mountain (Stock 1965), showed the outstanding quality of the astronomical observing conditions found at mountains in the Atacama desert. Even though not being the first investigation of its kind in this region (Curtis 1909), it was in particular the site testing of Cerro Tololo which ultimately shifted the attention of other observatory projects to this part of South America (e.g., Blaauw 1991). Also for the future generation of Extremely Large Telescopes the western coastal area of South America is one of the possible regions to host such a facility (e.g., Schöck et al. 2009, Thomas-Osip et al. 2008). Being thus one of the initial triggers for the astronomical development in Chile, the atmospheric seeing conditions at CTIO have been monitored over a long period of time. However, it turns out that the data which have been collected over the past decades were obtained with very heterogeneous instrumentation, making it difficult to put Cerro Tololo’s observing conditions into perspective. In particular the atmsopheric turbulence distribution, which drives the seeing, requires appropriate instrumentation to be accurately measured. The Differential Image Motion Monitor (DIMM, Sarazin & Roddier 1990) has become the prime tool to measure the total seeing. But modern astronomical observing techniques also require detailed information on the vertical distribution of the optical turbulence strength, expressed by the refractive index structure constant , at all heights ; the turbulence profile . Over recent years, the Multi Aperture Scintillation Sensor (MASS, Tokovinin 2002) has established itself as one of the main tools to obtain low resolution turbulence profiles. First experiments of MASS and DIMM measurements at CTIO were conducted during a two months long campaign and were published in Tokovinin et al. (2003). This shed first light on the vertical atmospheric turbulence distribution above Cerro Tololo. However, campaigns conducted over relatively short periods of time always have the disadvantage of not being able to assess seasonal variability and therefore are likely to be biased in one way or the other. Long term monitoring of site conditions is important to assess turbulence variations on all time scales and to obtain the representative, or typical, observing conditions at a particular site. In April 2004 a combined MASS-DIMM instrument was thus permanently installed at CTIO. By now, more than four years of MASS and DIMM data have been obtained at Cerro Tololo and should allow a better view on the atmospheric conditions at this observatory.
Between the years 2004 and 2005, CTIO was also hosting the experiments to calibrate the MASS-DIMM instruments of the site testing program for the Thirty Meter Telescope (TMT). As the TMT site monitor operated simultaneously with the CTIO site monitor, this allows for the calibration of the CTIO site monitor with respect to the TMT site monitoring equipment. As the data collected by the CTIO site monitor cover the same four years (2004–2008) as the TMT site monitoring program, this allows us to compare the turbulence conditions encountered above the southern Atacama (S) and the central Atacama (S) desert, where three of the TMT candidate sites are located.
2 The CTIO site monitoring system
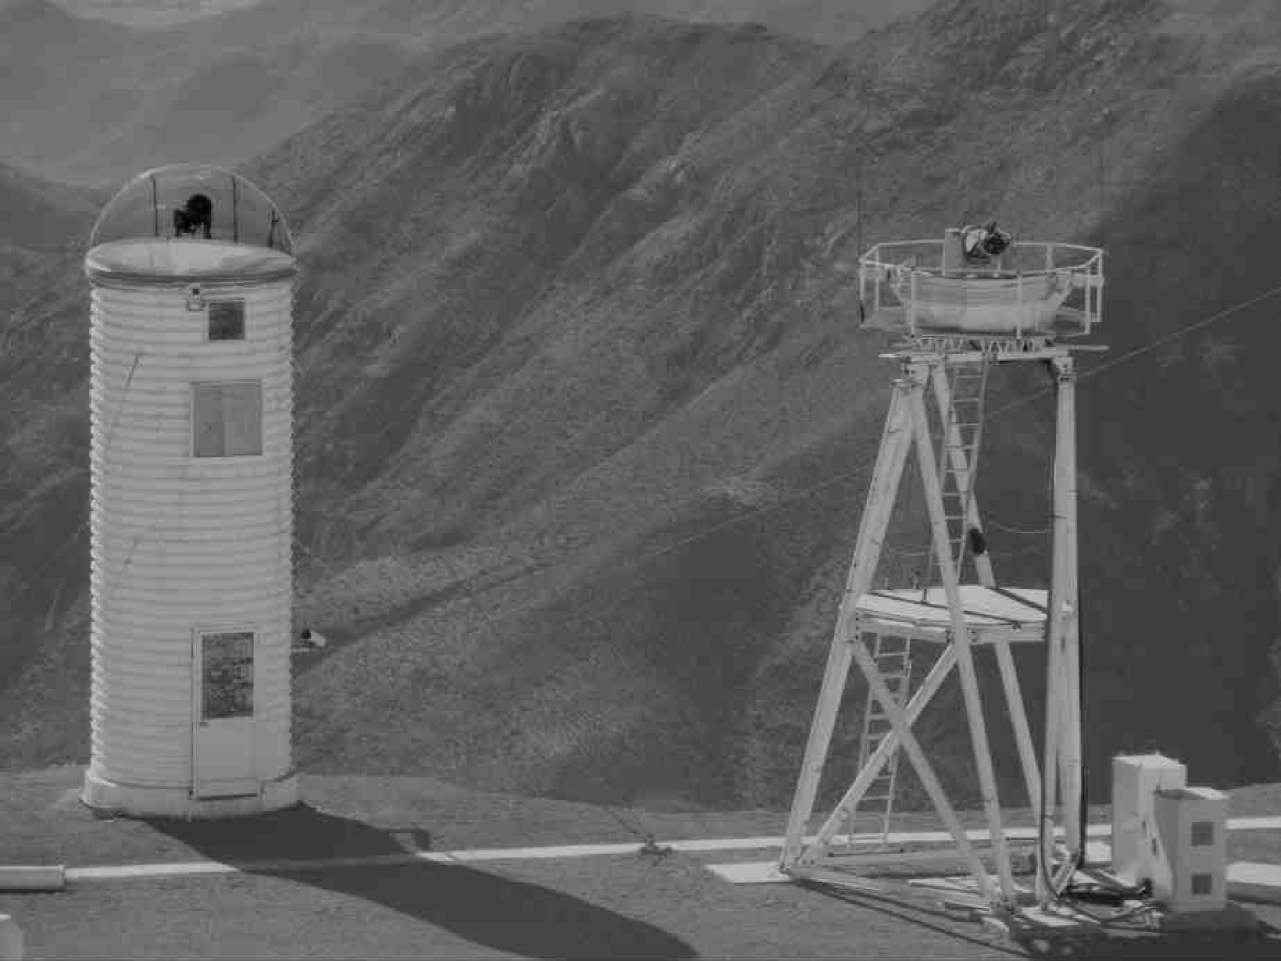
The CTIO site monitor consists of a Meade LX-200 telescope with an aperture of 25 cm, mounted on its standard alt-az fork mount. The telescope is housed on top a 6 m tall tower and is protected by a vinyl dome. The setup is shown in Fig. 1. During the year 2000 a DIMM (Boccas 2001, Tokovinin et al. 2003) was installed at this telescope and in early 2004 replaced by a combined MASS-DIMM unit (Kornilov et al. 2007). Here we will focus on the MASS-DIMM data only, collected since March 2004.
The DIMM measures the total seeing, which is inverse proportional to the Fried parameter , by means of the variance of the image separation of a stellar image observed through two subapertures. The specifications of a MASS-DIMM device in combination with the LX-200 telescope and a ST-5 CCD are provided in Kornilov et al. (2007). In brief, this results in two (slightly vignetted) subapertures with a diameter of 8 cm, separated by 17 cm. The CTIO DIMM software was modified over the years but the main code remained the same to what is described in Tokovinin et al. (2003); consecutive frames are taken with 5 ms and 10 ms exposure time and then corrected to zero exposure time by means of a two point exponential extrapolation (Tokovinin 2002a). Each measurement sequence takes 60 s. As the readout speed depends on the employed computer architecture, this does not result always in the same amount of subframes. Typically each DIMM measurement consists of more than 180 subframes for each exposure time. Including processing overhead, a DIMM measurement is triggered approximately every 70 s.
MASS (Tokovinin 2002) reconstructs, by measuring the differential scintillation indices in four concentric subapertures, a low resolution vertical profile of the optical turbulence structure constant or turbulence profile: at altitudes km. The value provided by the MASS is the structure constant integrated over the altitude range , weighted by a weighting function. The weighting function for each layer peaks at its nominal altitude and drops to zero at the altitude of its adjacent layers, thus causing some overlap between neighboring layers. From these turbulence profiles the isoplanatic angle and the seeing , which would be seen by an observer 500 m above the telescope, can be inferred. The MASS also provides, under certain assumptions, some measurement of the atmospheric coherence time (Tokovinin 2002). These, however, require some specific calibration factor for which we use the value provided in Travouillon et al. (2009). The MASS is operated by the turbina software (Kornilov et al. 2007, Tokovinin & Kornilov 2007) and measurements are triggered simultaneously with the DIMM measurements. The flux in each subaperture is measured by a photomultiplier tube, collecting 1 ms samples over a total of 60 s.
In this article, the turbulence parameters, apart from , have been corrected for their zenith distance and are given at a wavelength of nm. shows a very complex zenith distance dependence and the induced error by not correcting to zenith is expected to be small as outlined in Travouillon et al. (2009).
The CTIO site monitoring equipment also consists of commercialy available meteorological sensors by R.M. Young. Wind speed and direction are measured, as well as air temperature, relative humidity and atmospheric pressure. These sensors are installed on a 30 m tall tower, which is located on the steep eastern slope of Cerro Tololo. Therefore, the sensors are ranging effectively up to approximately 6 m above the Tololo summit platform. Data were acquired every 2 to 5 min. No particular data quality monitoring of these data was in place and therefore the measurement accuracy and precision of the sensors is not known and might be not as good as what is reported for other site monitoring projects (e.g., Riddle et al. 2009).
3 The CTIO versus the T3 MASS-DIMM
The TMT site testing program operated between August and October of 2004, two of its site testing telescopes (refered to as T2 and T3) side by side on Cerro Tololo. This campaign was conducted in order to indentify the precision of the MASS and DIMM data which would be collected during the TMT site testing. Results of this particular campaign were reported by Wang et al. (2007) and Els et al. (2008) for DIMM and MASS, respectively. This campaign was terminated in October 2004 by the move of T2 to a TMT candidate site in northern Chile. However, the T3 site testing telescope remained on Tololo until October 2005. Even though its operational scheme was during this remaining time not kept as efficient as during the previous calibration campgain, it still resulted in a significant amount of MASS-DIMM data collected in parallel with the CTIO site monitor, covering the time span between October 2004 and October 2005. These were continous observations but partly with large gaps in time, in particular during the second half of the campaign (June – October 2005). We use these data in order to compare the CTIO MASS-DIMM results to the T3 results and therefore to the results obtained at the TMT candidate sites.
3.1 MASS data
The MASS instruments at T3 and CTIO are of the same design, as described in Kornilov et al. (2007). However, they are mounted on different telescopes and the light paths thus contain different optical elements, affecting the calibration of these systems. The instrumental parameters, like for example the spectral response and instrument magnification, are defining the spatial filter of the scintillation pattern. Knowing these parameters with good accuracy is therefore essential for a proper turbulence profile reconstruction using differential scintillations. Some of these parameters can only be obtained reliably, after the observation. Therefore, the data sets were reprocessed using the atmos package within the turbina 2.052 software (Kornilov et al. 2007, Tokovinin & Kornilov 2007), employing the appropriate settings for each telescope instrument combination at the time of observation. Only those data from T3 and CTIO were selected which were taken within 60 s of each other. This resulted in 41,128 simultaneous T3–CTIO pairs of MASS measurements, including observations when the systems were not pointing at the same star. 28,029 measurement pairs were obtained when both systems observed the same star. The comparison of the turbulence statistics for observations when T3 and CTIO were pointing at the same star is shown in Tab. 1. The difference between the observed median seeing values is less than 002 and thus even lower than the 005 which which were found during the TMT campaign for the precision of two idential MASS systems (Els et al. 2008). On the other hand, the scatter ( in Tab. 1) in the correlation between the CTIO and TMT MASS is a factor of two larger than what was found for the TMT MASS. This is an indication of the measurement uncertainty and might also be a affected by the 60 s selection criteria employed here and the slightly larger spatial separation of the telescopes of 10 m; for the TMT study it was 30 s and 5 m, respectively.
Figure 2 addresses the effect of turbulence in different directions in the sky. As the data which are covering the various separations are spread out over the entire duration of the campaign, they do not represent a peculiar weather pattern or observation configuration. The top panel shows the statistics of the ratio of the MASS seeing pairs for the different angular separations (this is different to what is shown in Tab. 1 where the difference between the statistical distributions are shown). The almost perfect median agreement over the entire range of separations demonstrates the average isotropic behavior of the free atmosphere seeing. The mild increase of the with increasing angular separation (approximately by 01 over 40∘) and that the differences between the 90 percentile and the 10 percentile remain on an almost constant level, demonstrate that the free atmosphere seeing does on average not differ more than approximately or between different directions in the sky. Our analysis does not separate between different azimuth and altitude directions in the sky, e.g, here we do not map the turbulence across the sky as was done in the simulations shown in Masciadri et al. (2002). Our observed simultaneous differences in free atmosphere seeing (up to at 43∘) between different directions in the sky are comparable to the which were observed by Masciadri et al. (2002) during a single night. A quantitative comparison with the results of this reference is not possible as they apply to different sites with different topographic features.
The individual layer strengths behavior is more complex and is shown in the lower two panels of Fig. 2. The medians of the quotients of the layer strengths are shown in the lower left panel of that Figure. The relative differences of the upper three layers remain almost constant over the entire range of separations. In comparison the layers up to 2 km show an increase of their relative difference beyond 20∘ separation. The lower right panel of Fig. 2 shows the median difference between the layer strength as measured by the two systems. This difference is zero for the 0.5 km and 1 km layers and is explained as these layers are basically turbulence free. The higher layers show stronger turbulence and the absolute differences can reach m1/3 (equivalent to 0093) in the 16 km layer. As these absolute differences remain almost constant over the entire range of observed separations, this indicates systematic differences of the reconstruction of the individual layer strengths by the two MASS systems. The variation around the mean of each of these curves indicates that the assumption of turbulence above the site being on average uniformily distributed in vertical, parallel layers is valid to within approximately m1/3 (equivalent to 0030).
3.2 DIMM data
Comparing the DIMM data obtained by these two site monitoring systems is more complicated than the MASS data. The DIMM channels of these systems differ not only in the employed hardware but also in the used analysis algorithms, despite their being based on the same principles. The T3 system uses a ST-7 CCD in scanning mode which provides a binned one dimensional frame of a fixed area on the CCD, with exposure times of 6 ms during a 36 s measurement cycle. In comparison the CTIO DIMM makes use of a ST-5 CCD which delivers images of 100 px 17 px with exposure times of 5 ms and 10 ms over 60 s. The T3 scanning mode results in significantly more images during a measurement cycle than the two dimensional imaging technique; 6000 versus approximately 180. But T3 thus obtains only a 36 s average of the seeing as compared to the 60 s average obtained by the CTIO DIMM. For each measurement cycle of the CTIO DIMM, the area read by the CCD is adjusted around the locations of the stellar images; in turn T3 does the centering of the images inside the measurement area, by offsetting the telescope after taking a pointing image. The centroiding of the stellar images to determine the differential motion is done in the CTIO DIMM by calculating the center of gravity, whereas in the T3 DIMM two Gaussians are fitted to the one dimensional stellar images. The extrapolation to zero exposure time is realized in the T3 system by means of rebinning consecutive images to either six or two different exposure times. The CTIO DIMM in comparision performs the extrapolation based only on two exposure times only. And finally, while the T3 DIMM only measures the longitudinal (parallel to the subapertures) seeing component, the CTIO DIMM provides both components and the average of the two. Despite all these differences, we expect that both systems provide an accurate measure of the atmospheric turbulence.
The DIMM data sample of T3 covers only the time up to May 2005. After that date the T3 telescope showed some misalignment, resulting in low Strehl values of the DIMM images, thus compromising the seeing results (Wang et al. 2007). Similar to the MASS data, only DIMM data taken within 60 s by both systems are considered in the present study, resulting in 39,154 samples, including observations of different stars. From these T3 DIMM data we find a median difference of 0011 between the seeing obtained by the six point extrapolation scheme and the formula by Tokovinin (2002) for two exposure times. This value is less than the precision of TMT DIMM data of 002 (Wang et al. 2007). And as the reported results from the TMT candidate sites (Schöck et al. 2009) refer to the six point extrapolated values, we will in the following make use of these DIMM seeing values from T3. The median difference between the longitudinal and transversal seeing components recorded by the CTIO DIMM is 0069. We consider this difference to be too large in order to make use of the average of these components for comparison purposes. Instead, we will use the longitudinal seeing component provided by the CTIO DIMM. Apart from T3 DIMM measuring this particular seeing component only, the longitudinal component has also the advantage that it is less sensitive to various errors. On the one hand the constant , which relates the differential image motion to the Fried parameter and thus to seeing, is about 50% smaller than the transversal constant (see eq. [8] in Tokovinin 2002). Also the longitudinal seeing appears less sensitive to the orientation between the wind direction and the axis of the DIMM subapertures (Tokovinin 2002).
3.2.1 Discussion of CTIO DIMM data prior to July 12 2005
To complicate the comparison between these DIMM systems further, the CTIO DIMM underwent a correction of its analysis software, which took place in July 2005, shortly after the collection of useful T3 DIMM data was terminated on Tololo. Therefore, we will first investigate the impact of this modification and correct the CTIO DIMM data taken prior to this software change. Prior to the modification, the CTIO DIMM software did perform the centroiding on images which contained a digital bias, introduced by the ST-5 controller to avoid negative pixel values. In addition, the centroiding window around an initially identified stellar image location, was set to a radius of pixel. After July 12, 2005 the code was changed in such a way that the median background value is computed from the area outside the window regions, with radii of pixel. This background is subtracted from the entire image and final centroiding takes place inside the 4 pixel radius window, in accordance with the recommendations given in Tokovinin (2002).
Obviously, the subtraction of a constant background and using a different window size affects the centroid determination. To assess from an empirical point of view the impact of these changes, a stand-alone DIMM reanalysis package was written using the existing CTIO DIMM routines. A total of 5465 DIMM observations were taken by the CTIO DIMM between April 2 and April 20, 2009 and the raw, two dimensional DIMM frames saved. These frames were analysed employing the software configurations before and after July 2005, meaning px, and px and being determined automatically. The correlation between the so obtained DIMM longitudinal seeing measurements is shown in Fig. 3. The configuration with the wider window size and no background subtraction results in larger seeing as compared to the currently employed configuration. We note, that for the transversal seeing component a very similar correlation and fit coefficients are found. We use the fit coefficients provided in Fig. 3 and apply this fit to the CTIO DIMM data obtained before July 12 2005.
3.2.2 The enhanced ground layer at Tololo
After applying the correction developed in the previous section to the CTIO DIMM data, the comparison between the distributions of the CTIO and T3 DIMM data shows a difference of the median seeing of 0082, which is still a factor of four larger than the DIMM seeing precision reported by Wang et al. (2007) for the TMT DIMM seeing monitors. The difference does not change if one considers only observations for which both systems were observing the same star111Note that the longitudinal axes of the subapertures of both DIMM systems are parallel to the elevation axes of the telescopes, thus, both DIMM systems experience the same attenuation of the DIMM response due to the alignment of wind direction with the subaperture axis if pointing at the same star.. After the encouraging results from the MASS section this finding requires some more investigation.
In a previous study of the conditions at Cerro Tololo, Tokovinin et al. (2003) found that the ground layer (GL) seeing, computed from the difference of MASS and DIMM seeing, increases when winds are coming from northern directions. This is at first counter-intuitive as the CTIO site monitor is located at the northern most edge of the Tololo summit platform. It would rather be expected that southern winds cause the air to become more turbulent when passing over the summit area with its various buildings. Using the simultaneous T3 and CTIO seeing data, as well as simultaneously (within 120 s) recorded wind direction measurements, we construct what we call “seeing roses”. The wind directions are binned in bins and the GL seeing statistics are calculated for data within each wind direction bin. An increase under northern winds is clearly visible in the CTIO GL seeing rose, which is shown in the top left panel of Fig. 4. On the other hand, the T3 GL seeing remains at an almost constant level independent of the wind direction (top right panel in Fig. 4). In order to test whether the observed differences are caused by the MASS or DIMM data, we computed GL seeing roses (lower two panels of Fig. 4) using the T3 MASS data in combination with the CTIO DIMM data and the T3 DIMM data in combination with the CTIO MASS data. The strong increase of GL seeing is present only when the CTIO DIMM data are used. This clearly demonstrates, that the CTIO-DIMM is showing a seeing bias under northerly winds. The CTIO GL seeing roses show that this bias is strongest for winds between 300∘ and 120∘, thus wind directions centered around approximately 30∘ (North-North-East).
The clear dependence of this GL bias on the wind direction indicates that it is not an inherent problem of the CTIO-DIMM software and that the cause must be located within the close vicinity of the CTIO site monitoring telescope. Comparing the structural differences of the setup of the two site monitoring systems sheds light on this issue. Figure 1 shows a picture of the CTIO site monitor in its operational configuration. The telescope is mounted on a 6 m tall, approximately 50 cm50 cm concrete pier, which is surrounded by a metal shelter with a diameter of 2.6 m. The shelter tube has several openings at different altitudes above the ground, which are facing North-North-East, South and South-West. On top of the metal shelter a vinyl dome is installed, which opens towards south during observations but only by an angle of approximately 110∘. This means that during observations the dome remains closed up to an elevation of approximately 70∘ above the Northern horizon. We note, that the dome opens not exactly North-South but rather slightly towards South-West (maybe by 30∘). This only half opening dome is intended to prevent wind inducing vibrations into the telescope.
Figure 1 also shows the T3 setup on Tololo at its current (since March 2009) location, which differs from its location during the 2004–2005 campaign by only 1 m (horizontally). The picture clearly shows the skeleton design of the tower hosting the T3 telescope. It also shows the dome open, as during night time operations. This demonstrates that the T3 dome fully folds away from the telescope during night time. The TMT site testing telescopes are custom built, open tube, 35 cm aperture Cassegrain telescopes. The entire design of telescope and tower are intended to minimize the influence of the telescope support structures on the airflow, as well as to provide maximum mechanical robustness.
Here we cannot rule out that the various openings in the shelter structure of the CTIO site monitor are causing a vertical “chimney-like” flow through the shelter tube during northern winds and are thus thermally increasing the turbulence at the telescope. But due to its proximity and excellent alignment agreement of the seeing bias with the half-sphere of the dome, we suspect the partial lowering the dome of the CTIO telescope as the main source of the increased GL seeing observed by this telescope. Another argument supporting this hypothesis is illustrated in Fig. 5, where the dependence of the median ratio between GL turbulence strength as measured by the two site monitors on the wind speed is shown; separated are the cases of northern and southern winds. Based on the GL seeing roses in Fig. 4, we define northern wind directions to be between 300∘ and 120∘ and southern winds for all other directions. In the case of southern winds, the quotient remaines almost constant between 0.8 and 1 over the entire range of wind speeds for which a meaningful amount of data has been collected. Interestingly, in the case of northern winds the quotient first raises from close to 1 up to 2 and above 3 m s-1 begins to decrease again. This decrease might hint on the influence of the geometry of the dome on the separation of the airflow and the behavior of the drag coefficient of the dome. With a diameter of the dome of m and the cylinder of the shelter building below, and assuming the kinematic viscosity of air being m2s-1 (Lide 1995), the Reynolds number of the airflow around the CTIO site monitor dome is in the range of for wind speeds between m s-1 to 6 m s-1 (see upper x-axis of Fig. 5). For such a sphere the transition to a turbulent flow and the formation of a wake is expected to start at . At this point will decrease strongly. The wake dissipates and increases again beyond . This behavior of a flow around an object is well known (e.g,Brennen 2005). Therefore, we speculate that our observations trace a connection between and the drag coefficient. Further measurements are needed to confirm and properly quantify such a connection.
3.2.3 Correction of the enhanced GL
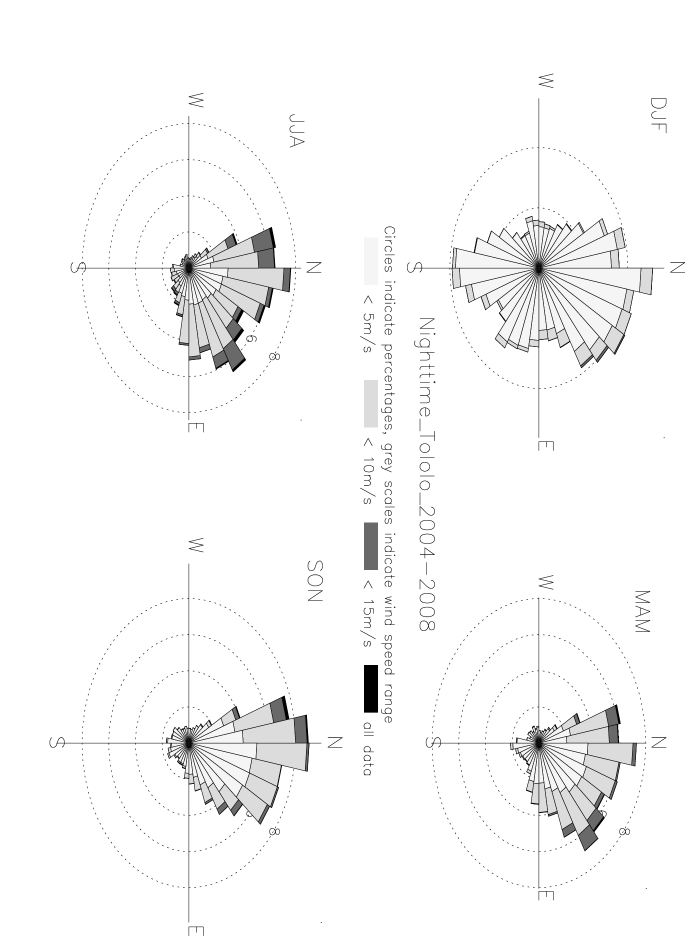
Even though we are aware of the uncertainties of trying to remove a dome/tower seeing effect from our measurements, we will attempt to do so as otherwise four years of DIMM data collected under northern winds at CTIO would become useless. And northern winds are dominating the wind rose of Cerro Tololo (see Fig. 6). The bias is localized in the GL and we can thus use the MASS-DIMM computed GL data, the MASS seeing and a corrective term for the GL measurement to obtain a corrected total seeing value in the following way:
| (1) |
where refers to the turbulence strength of each of each of the six MASS layers, is the MASS-DIMM computed GL turbulence strength and is a correction factor, which we take as median correction for each wind speed and direction () configuration, directly from Fig. 5. For northern winds, we use the solid curve from Fig. 5 for the corresponding wind speeds. In the case of southern winds, we assume for all wind speeds.
In order to test this correction method, we computed the corrective term from the first half of the simultaneous CTIO–T3 data (14,863 samples), similar to what is shown in Fig. 5. This correction was then applied to the second half of the simulataneous data. Table 2 shows the results. The differences between the statistical distributions are less than 003 after the correction is applied, demonstrating the use of the concept.
4 Turbulence Parameters during 2004–2008
The discussions in the previous sections allow us to investigate now the behavior of the atmosphere above Cerro Tololo between April 1 2004 and December 1 2008. In order to be able to apply the corrections developed in the previous sections we only make use of MASS, DIMM and weather station data when all three data are available within 60 s and 120 s, respectively. Therefore, the following results are based on a total of 433,162 samples.
4.1 Overall turbulence conditions
Table 3 shows the overall statistics of the main turbulence parameters; the values represent the statistics of the corrected DIMM measurements. Apart from covering a longer time span, these DIMM data are also corrected for the effects desribed in § 3.2.1 and § 3.2.3. Also, the GL seeing was corrected for the effects. The isoplanatic angle and the MASS seeing given in Tab. 3 were calculated from the turbulence profiles observed by MASS. The coherence time statistics are based on the MASS delivered coherence time (Tokovinin 2002) and the correction from Travouillon et al. (2009) was applied: . represents the free atmosphere coherence time only; it does not take into account any GL contribution.
The turbulence profiles are shown in Fig. 7 and detailed in Tab. 4. These are the profiles under typical seeing and isoplanatic angle conditions. They were obtained similar as to what was described in Els et al. (2009); by selecting the 5% of DIMM (or MASS ) data which result closest in the 25%, 50% and 75%ile of the overall DIMM seeing (MASS ) statistic. The turbulence profile is then constructed from the MASS data observed simultaneously with the selected DIMM (MASS ) data.
Comparing the total seeing at Tololo to what has been observed at the TMT candidate site in northern Chile, it turns out that the Tololo seeing is by larger. The free atmosphere (MASS) seeing is responsible in part for this, as high altitude turbulence is stronger above Tololo by up to 007. On one side, this reflects itself in the lower isoplanatic angle, which is driven by the 16 km layer. But the turbulence profiles in Fig. 7 also show significant turbulence already at 2 km above Tololo. The profiles obtained in northern Chile indicate that significant turbulence strength appears from the 4 km layer onwards. From our findings in § 3.1 we suspect that the 2 km layer above Tololo is probably weaker and that its strength is in part an instrumental artifact and that part of this layer’s turbulence strength has probably to be distributed into the neighboring layers. However, it was shown in § 3.1 that the free atmosphere seeing measured by the TMT and CTIO MASS compare extremely well. It can thus be concluded that the free atmosphere at the latitude of Tololo indeed shows slightly more optical turbulence to what is found at more northern locations.
4.2 Seasonal variations
In order to assess the seasonal variability of the main turbulence parameters we calculate a standard year similar to Els et al. (2009). It contains the statistics of all data collected in each month of the year covered by the monitoring period. The standard year statistics of MASS, DIMM and GL seeing, as well as the isoplanatic angle are shown in the panels of Fig. 8. The standard year of the median strength of the individual MASS layers is shown in Fig. 9. Both, the MASS and DIMM monthly median seeing components, are stronger during winter time, i.e., from May to October by up to 02. The median GL seeing undergoes a similar annual cycle but on a lower level. The amplitude of the seasonal variation of the total seeing at Tololo is comparable to what is found at other sites (Michel et al. 2003, Masciadri & Egner 2006, Schöck et al. 2009). Strong seasonal variation of the isoplanatic angle is observed as well; low during the winter and approximately 05 higher during summer months. The behavior of the individual layer strengths in Fig. 9 shows, that the 8 km and the 16 km layers are increased during the winter months. This has already been observed during other site monitoring campaigns in this region (Vernin et al. 2000). As these high layers are dominating the isoplanatic angle, their behavior reflects directly onto . The 8 km layer resembles for Tololo the 200 mbar (11 km a.s.l.) level and therefore the altitude of the jet stream. The jet stream passes over the latitude of Tololo during the southern winter months and it can be expected that it drives the 8 km turbulence strengths. This is very similar to what has been observed during the TMT site testing at sites in northern Chile (Els et al. 2009). Also the 1 km, 2 km and 4 km layers might show a similar seasonal variation. The 0.5 km layer does not inhibit any clear seasonal change; it remains at low levels. This means that the annual cycle of the turbulence strengths of the lower tropospheric layers at the latitude of Tololo is inverted as compared to the central Atacama region, i.e., above the northern Atacama, the turbulence strengths of the lower layers appear weaker during the winter time. We suspect that the weaker occurrence of the Altiplano Winter (Zou & Lau 1998) at Tololo is influencing this behavior, but a proper understanding would require additional meteorological data and remains the task for a future study.
4.3 Nocturnal variations
The median evolution of the individual MASS layers, the integrated turbulence parameters, wind speed and temperature during a night are shown in Fig. 10. These graphs show the median values of each parameter for each hour after sunset until 6 hours, and from there on during each hour before sunrise. Only during the first two hours of the night do the turbulence strengths (thus seeing) show a significant change. The turbulence strength of the GL layer increases, whereas the strength of the layers up to 2 km drop during these hours. This is likely resembling the build up of the stable boundary layer and the decay of the inversion layers above. Throughout the night the turbulence strengths of the layers remain almost constant, with the 0.5 km layer being the only one showing some small increase during the night. This might either reflect the growing vertical extension of the stable boundary layer or as the wind speed is steadily increasing at Tololo, it might also point to wind shear as the main mechanism driving the optical turbulence as at the TMT candidate sites. It should be kept in mind, that the particular increase of the GL at Tololo, despite having the GL corrected for the dome seeing component, might still be affected by the telescope support structures.
5 Summary and Conclusions
Four years of MASS-DIMM data collected at Cerro Tololo have been presented. These MASS-DIMM data have been compared to simultaneously collected TMT site testing data during part of this period. This led to the identification of an enhanced ground layer in the CTIO DIMM data under northerly winds. This component is most likely caused by the not fully opening dome. A correction of this component has been presented. If this component is indeed due to the dome, this demonstrates that strong seeing biases can be introduced within a region extending less than one meter away from the site monitoring telescope. The MASS comparison results indicate an exellent agreement of better than 003 of the measured free atmosphere seeing. The strengths of the individual MASS layers agree well, however, individual layers can differ up to m1/3. Our simultaneous MASS observations of different stars also confirm the general assumption of uniform layers above the site to a level of m1/3. The corrected DIMM data indicate a median seeing at Cerro Tololo of 075. These results are consistent with the findings of previously conducted site monitoring campaigns in this region, using different methods than employed in our study (Vernin et al. 2000). It is also very close to the model by Racine (2005), which suggests a seeing of 074 for Tololo. Our observations would indicate that Tololo shows a seeing only slightly larger than what is found in northern Chile. This seeing is in part due to stronger high altitude turbulence. Our data indicate that a strong annual variation of higher altitude turbulence exists, with the weakest turbulence encountered during the southern summer months. These results are consistent with the findings of previously conducted site monitoring campaigns in this region, using different methods than employed in our study (Vernin et al. 2000).
After being deployed during three years on Cerro Tolonchar in the North of Chile, the T3 system returned in April 2009 to Cerro Tololo and is now operating within 1 m NNW of its location during the 2004–2005 campaign. As the original CTIO site monitor will continue its operation, this configuration of two MASS-DIMM systems being so close to each other, will make it possilbe to conduct a number of experiments. The MASS data could be used to investigate the behavior of optical turbulence at various altitudes and over different horizontal spatial scales. In combination with the DIMM, these site monitors could act as an experimental test bed for the seeing induced by various dome and shelter configurations, i.e., like a wind tunnel.
References
-
Boccas (2001)
Boccas M., Description of the CTIO RoboDIMM, http://www.ctio.noao.edu/telescopes
/dimm/dimm.html - Brennen (2005) Brennen Ch.E., 2005, “Fundamentals of Multiphase Flows”, Cambridge University Press
- Blaauw (1991) Blaauw A., 1991, “ESO’s early history”, European Southern Observatory publication
- Curtis (1909) Curtis H.D., 1909, “Reports on astronomical conditions in the Region about Copiapo”, copy from the Shane archives in the CTIO library
- Els et al. (2008) Els S.G., Schöck M., Seguel J., Tokovinin A., Kornilov V., Riddle R., Skidmore W., Travouillon T., Vogiatzis K., Blum R., Bustos E., Gregory B., Vasquez J., Walker D., Gillett P., 2008, Appl. Optics, 47, (14), 2610
- Els et al. (2009) Els S.G., Travouillon T., Schöck M., Riddle R., Skidmore W., Seguel J., Bustos E., Walker D., 2009, PASP, 121, 527
- Kornilov et al. (2007) Kornilov V., Tokovinin A., Shatsky N., Voziakova O., Potanin S., & Safonov B., 2007, MNRAS, 382, 1268
- Lide (1995) Lide D.R., “CRC Handbood of Chemistry and Physics, 76th Edition”, CRC Press
- Masciadri et al. (2002) Masciadri E., Avila R., Sánchez L.J., 2002, A&A, 382, 378
- Masciadri & Egner (2006) Masciadri E. & Egner S., 2006, PASP, 118, 1604
- Michel et al. (2003) Michel R., Echevarría J., Costero R., Harris O., 2003, Rev. Mexicana Astron. Astrofis., 19,37
- Racine (2005) Racine R., 2005, PASP, 117, 401
- Riddle et al. (2009) Riddle R., Schöck M., Skidmore W., Els S., Travouillon T., Bustos E., Seguel J., Walker D., Gillett P., 2009, submitted
- Sarazin & Roddier (1990) Sarazin M. & Roddier F., 1990, A&A, 227, 294
- Schöck et al. (2009) Schöck M., Els S., Riddle R., Skidmore W., Travouillon T., Blum R., Bustos E., Chanan G., Djorgovski G., Gillett P., Gregory B., Nelson J., Otárola A., Seguel J., Vasquez J., Walker A., Walker D., Wang L., 2009, PASP, 121, in press
- Skidmore et al. (2009) Skidmore W., Els S., Riddle R., Schöck M., Travouillon T., 2009, PASP, in prep.
- Stock (1965) Stock J., 1965, Science, 148, 3673
- Thomas-Osip et al. (2008) Thomas-Osip J.E., Prieto G., Johns M., Phillips M.M., 2008, SPIE, 7012, 64
- Tokovinin (2002) Tokovinin A., 2002, Appl. Opt., 41, 957
- Tokovinin (2002a) Tokovinin A., 2002a, PASP, 114, 1156
- Tokovinin et al. (2003) Tokovinin A., Baumont S., Vasquez J., 2003, MNRAS, 340, 52
- Tokovinin & Kornilov (2007) Tokovinin A. & Kornilov V., 2007, MNRAS, 381, 1179
- Travouillon et al. (2009) Travouillon T., Els S., Riddle R., Schöck M., Skidmore W., 2009, PASP, in press
- Vernin et al. (2000) Vernin J., Agabi A., Avila R., Azouit M., Conan R., Martin F., Masciadri E., Sanchez L., Ziad A., 2000, “Gemini Site Characterization Report” (Gemini report RPT-AO-G0094)
- Wang et al. (2007) Wang L., Schöck M., Chanan G., et al. 2007, Appl. Opt., 46, (25), 6460
- Zou & Lau (1998) Zou J. & Lau K.-M., 1998, Journal of Climate, 11, 1020


| MASS result | CTIOT3median | CTIOT3mean | (CTIOT3)rms |
|---|---|---|---|
| seeing [arcsec] | -0.017 | -0.027 | 0.159 |
| [arcsec] | -0.113 | -0.112 | 0.160 |
| [ms] | -0.050 | -0.006 | 0.295 |
| km [m1/3] | -4.10 | -2.69 | 3.12 |
| km [m1/3] | -1.53 | -7.20 | 9.73 |
| km [m1/3] | 1.31 | 1.49 | 6.45 |
| km [m1/3] | -9.67 | -9.92 | 4.53 |
| km [m1/3] | -2.04 | -1.08 | 3.83 |
| km [m1/3] | 1.24 | 1.63 | 2.74 |
| Percentile | CTIO DIMM | CTIO DIMM corr. | T3 DIMM |
|---|---|---|---|
| [arcsec] | [arcsec] | [arcsec] | |
| 10 | 0.60 | 0.55 | 0.58 |
| 25 | 0.72 | 0.65 | 0.66 |
| 50 | 0.89 | 0.79 | 0.79 |
| 75 | 1.11 | 0.99 | 0.98 |
| 90 | 1.39 | 1.23 | 1.20 |
| Percentile | ||||||
|---|---|---|---|---|---|---|
| [arcsec] | [arcsec] | [arcsec] | [arcsec] | [arcsec] | [ms] | |
| 10 | 0.60 | 0.50 | 0.25 | 0.19 | 2.66 | 7.08 |
| 25 | 0.71 | 0.60 | 0.34 | 0.33 | 2.11 | 4.85 |
| 50 | 0.88 | 0.75 | 0.50 | 0.44 | 1.56 | 2.94 |
| 75 | 1.10 | 0.97 | 0.72 | 0.58 | 1.12 | 1.77 |
| 90 | 1.39 | 1.27 | 1.03 | 0.76 | 0.82 | 1.15 |
| h [km] | 10% | 25% | 50% | 75% | 90% | |
| 0.0 | 1.055e-13 | 1.830e-13 | 2.876e-13 | 4.224e-13 | 6.119e-13 | |
| 0.5 | 2.248e-16 | 5.619e-16 | 2.310e-15 | 2.769e-14 | 1.041e-13 | |
| 1.0 | 1.930e-16 | 4.826e-16 | 9.652e-16 | 9.167e-15 | 6.039e-14 | |
| 2.0 | 6.028e-16 | 5.694e-15 | 3.146e-14 | 9.569e-14 | 2.246e-13 | |
| 4.0 | 4.622e-16 | 2.415e-15 | 2.284e-14 | 5.866e-14 | 1.185e-13 | |
| 8.0 | 3.033e-16 | 7.581e-16 | 1.150e-14 | 6.824e-14 | 1.384e-13 | |
| 16.0 | 2.166e-14 | 3.408e-14 | 5.661e-14 | 9.514e-14 | 1.605e-13 | |
| median | mean | |||||
| h [km] | 25% | 50% | 75% | 25% | 50% | 75% |
| 0.0 | 1.59e-13 | 2.00e-13 | 2.55e-13 | 1.51e-13 | 1.96e-13 | 2.55e-13 |
| 0.5 | 9.44e-16 | 1.78e-15 | 3.43e-15 | 1.10e-14 | 2.20e-14 | 4.61e-14 |
| 1.0 | 4.34e-16 | 6.80e-16 | 1.29e-15 | 4.01e-15 | 9.02e-15 | 2.46e-14 |
| 2.0 | 1.03e-14 | 2.53e-14 | 6.50e-14 | 2.24e-14 | 4.44e-14 | 9.61e-14 |
| 4.0 | 1.58e-14 | 2.17e-14 | 3.51e-14 | 2.46e-14 | 3.50e-14 | 5.72e-14 |
| 8.0 | 4.07e-15 | 1.80e-14 | 4.51e-14 | 2.36e-14 | 4.66e-14 | 7.54e-14 |
| 16.0 | 4.58e-14 | 5.69e-14 | 7.23e-14 | 5.34e-14 | 7.00e-14 | 9.44e-14 |
| h [km] | 25% | 50% | 75% | 25% | 50% | 75% |
| 0.0 | 1.75e-13 | 1.73e-13 | 1.81e-13 | 2.04e-13 | 2.08e-13 | 2.27e-13 |
| 0.5 | 5.93e-15 | 4.31e-15 | 2.74e-17 | 4.19e-14 | 4.53e-14 | 4.98e-14 |
| 1.0 | 1.31e-15 | 1.41e-15 | 2.19e-16 | 1.58e-14 | 2.61e-14 | 3.86e-14 |
| 2.0 | 1.95e-14 | 2.43e-14 | 3.84e-14 | 4.73e-14 | 6.80e-14 | 1.07e-13 |
| 4.0 | 2.40e-14 | 3.44e-14 | 1.54e-14 | 3.16e-14 | 4.84e-14 | 5.03e-14 |
| 8.0 | 1.71e-15 | 7.77e-15 | 7.24e-14 | 1.09e-14 | 2.59e-14 | 7.89e-14 |
| 16.0 | 3.85e-14 | 6.12e-14 | 9.39e-14 | 3.65e-14 | 5.76e-14 | 9.14e-14 |