The scale of homogeneity of the galaxy distribution in SDSS DR6
Abstract
The assumption that the Universe, on sufficiently large scales, is homogeneous and isotropic is crucial to our current understanding of cosmology. In this paper we test if the observed galaxy distribution is actually homogeneous on large scales. We have carried out a multifractal analysis of the galaxy distribution in a volume limited subsample from the SDSS DR6. This considers the scaling properties of different moments of galaxy number counts in spheres of varying radius centered on galaxies. This analysis gives the spectrum of generalized dimension , where quantifies the scaling properties in overdense regions and in underdense regions. We expect for a homogeneous, random point distribution.
In our analysis we have determined in the range and . In addition to the SDSS data we have analysed several random samples which are homogeneous by construction. Simulated galaxy samples generated from dark matter N-body simulations and the Millennium Run were also analysed. The SDSS data is considered to be homogeneous if the measured is consistent with that of the random samples. We find that the galaxy distribution becomes homogeneous at a length-scale between and . The galaxy distribution, we find, is homogeneous at length-scales greater than . This is consistent with earlier works which find the transition to homogeneity at around .
keywords:
methods: numerical - galaxies: statistics - cosmology: theory - large scale structure of the Universe.1 Introduction
The assumption that the universe is homogeneous and isotropic, known as the Cosmological Principle, is perhaps the most fundamental postulate of the currently well accepted standard model of cosmology (e.g. Weinberg 2008). The Sloan Digital Sky Survey (SDSS), the largest galaxy survey till date, has mapped out the galaxy distribution in a large volume of space. This provides a unique opportunity to observationally test the Cosmological Principle. The two-point correlation function and the power spectrum, which are the standard techniques to quantify galaxy clustering (Peebles, 1980), rely on the assumption that the Cosmological Principle is valid on a sufficiently large scale, and hence cannot be used to test the Cosmological Principle.
Coleman & Pietronero (1992) have proposed that the universe has a fractal structure. If true, this violates the Cosmological Principle. While some of the subsequent analysis of galaxy surveys show evidence for homogeneity in the galaxy distribution at sufficiently large scales (Guzzo, 1997; Bharadwaj et al., 1999; Pan & Coles, 2000; Tikhonov et al., 2000; Kurokawa et al., 2001), there are others who either fail to find a transition to homogeneity or find definite evidence for a fractal structure out to the largest scale probed (Hatton, 1999; Amendola & Palladino, 1999; Best, 2000; Baryshev & Bukhmastova, 2004).
In a recent study Yadav et al. (2005) have analysed nearly two-dimensional (2D) strips from the SDSS Data Release One to find a definite transition to homogeneity occurring at the length-scale . Hogg et al. (2005) have analysed the distribution of Luminous Red Galaxies (LRG) in the SDSS to find a transition to homogeneity at . The transition to homogeneity, however, is contested by Sylos Labini et al. (2007, 2009a, 2009b) who fail to find a transition to homogeneity at the largest scales which they probe in the 2dF and SDSS galaxy surveys.
In this paper we have analysed the SDSS Data Release Six (DR6) to test if the galaxy distribution exhibits a transition to homogeneity at large scales, and if so to determine the scale of homogeneity. To achieve this we have carried out a multifractal analysis (Martinez & Jones, 1990; Borgani, 1995) of the galaxy distribution in a volume limited subsample drawn from the SDSS DR6. The multifractal analysis quantifies the scaling properties of a number of different moments of the galaxy counts, allowing for the possibility that this may differ depending on the density environment. The current work improves upon the earlier 2D analysis of Yadav et al. (2005). The large contiguous region covered by SDSS DR6 allows us to carry out a full three dimensional analysis covering scales upto in the volume limited sample. The transition to homogeneity has been identified by comparing the observations with a random point distribution having the same number and geometry as the actual galaxy distribution. The observations have also been compared with CDM N-body simulations which are also used to determine the error-bars.
2 Data and Method of Analysis
2.1 SDSS DR6 Data
Our present analysis is based on galaxy redshift data from the SDSS DR6 (Adelman-McCarthy et al., 2008). The SDSS DR6 includes 9583 square degrees of imaging and 7425 square degrees of spectroscopy with galaxy redshifts. For the present work we have used the Main Galaxy Sample for which the target selection algorithm is detailed in Strauss et al. (2002). The Main Galaxy Sample comprises of galaxies brighter than a limiting r band Petrosian magnitude . The data was downloaded from the Catalog Archive Server (CAS) of SDSS DR6 using a Structured Query Language (SQL) search. We have identified a contiguous region in the Northern Galactic Cap which spans and where and are survey co-ordinates defined in Stoughton et al. (2002). A volume limited galaxy subsample was constructed in this region by restricting the extinction corrected Petrosian r band apparent magnitude to the range and restricting the absolute magnitude to the range . This gives us galaxies in the redshift range which corresponds to comoving radial distances from to .
2.2 N-body Data
We have simulated the dark matter distribution at using a Particle-Mesh (PM) N-body code. This was used to simulate the observed galaxy distribution by identifying randomly chosen dark matter particles as galaxies. Here we have chosen particles from a region which is exactly identical to the survey volume.
The N-body simulations use particles on a mesh, with grid spacing . The simulations use a CDM power spectrum with cosmological parameters = (Komatsu et al., 2009). The effect of peculiar velocities was incorporated using the plane parallel approximation. We have run five independent realizations of the N-body code, and the simulated galaxy distribution were analysed in exactly the same way as the actual data.
The galaxies in our simulations are expected to exactly trace the dark matter distribution. Galaxy formation is a complex non-linear process, and it is quite possible that the galaxies are a biased tracer of the underlying dark matter distribution. To account for this possibility, we have also considered a semi analytic galaxy catalogue (Croton et al., 2006) from Millennium Run Simulation (Springel et al., 2005). Semi analytic models are simplified simulations of the formation and evolution of galaxies in a hierarchical clustering scenario incorporating all relevant physics of galaxy formation processes. The spectra and magnitude of the model galaxies were computed using population synthesis models of Bruzual & Charlot (2003) and we use the catalog where the galaxy magnitudes are available in the SDSS u, g, r, i, z filters. The catalog contains about 9 million galaxies in a box. Using the peculiar velocities we map the galaxies to redshift space and then identify a region having same geometry and choose the same number of galaxies within the specified magnitude range as the actual galaxy sample.
2.3 Method of analysis
Scale invariance of galaxy clustering (Jones et al., 2005), atleast at small scales, motivates us to use fractal analysis. There are various definitions of fractal dimension e.g. the Hausdorff Dimension, Capacity Dimension, Similarity Dimension, Box counting Dimension, etc. These definitions represent particular cases of the multifractal spectrum of generalised dimension. In this paper, we use the generalised Minkowski-Bouligand dimension to characterise the galaxy distribution. This contains complete information about various moments of the galaxy counts, and hence, is well suited for the multifractal analysis.
Considering the galaxy as center, we determine the number of other galaxies within a sphere of comoving radius . The generalised correlation integral is defined as
| (1) |
where is the number of centers, is the total number of galaxies and refers to a particular moment of the galaxy counts. For a fixed , we have used all the galaxies, barring those that lie within a distance from the survey boundary, as centers. In our analysis and and for and respectively.
The generalised Minkowski-Bouligand dimension follows from the correlation integral, and is given by
| (2) |
For , probes the scaling behaviour of galaxies in high density environments e.g. clusters and super-clusters and for , probes the same in under-dense environments like voids. We have varied from to in steps of 1. In principle, we could have considered even higher and lower values of but the finiteness of the data increases the scatter in the value as the value of increases (Bagla et al., 2008). We have calculated by numerically differentiating using the Ridders’ method (Press et al., 1992) considering at three consecutive values each separated by . Using a smaller interval () , we find an increase in the fluctuations in while using a larger interval () gives nearly the same results as ().
We have determined in the range and in the range for the data as well as the simulations. To assess the transition to homogeneity we have also generated “random samples” which contain randomly located points. The number of points and the volume coverage of these samples is exactly same as that of SDSS data. The point distribution in the random samples are homogeneous by construction, and we have generated 10 independent samples. The data, or the simulations, are considered to be homogeneous on length-scales where is consistent with that of the random sample.
3 Results and Conclusions
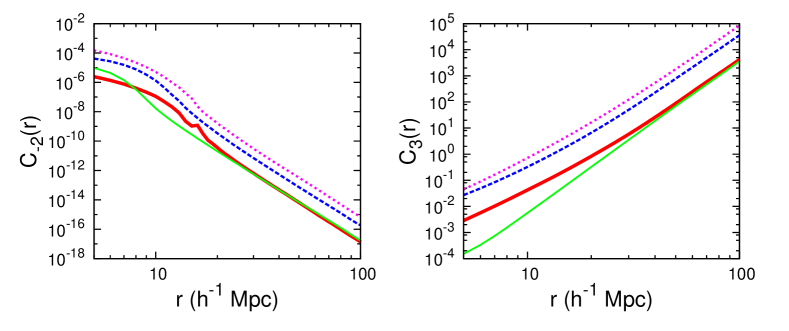
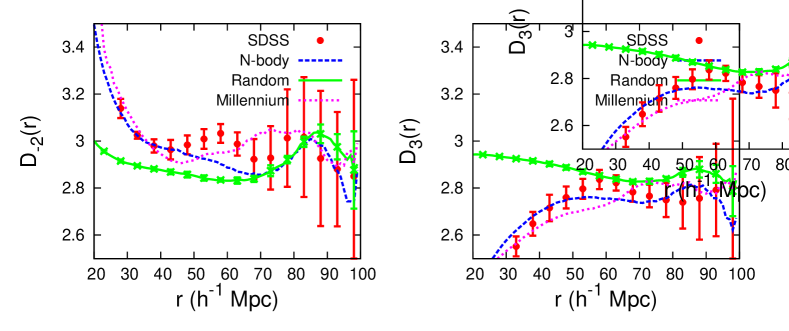
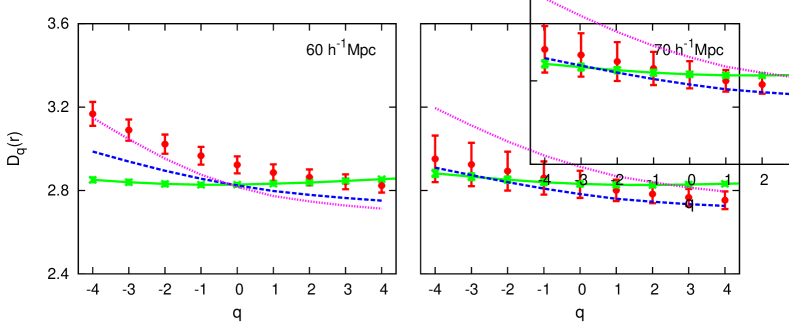
Figure 1 shows the correlation integral for and . The behaviour is similar for other values of . We find that increases with for positive values of whereas it falls progressively for negative values of . It is quite clear that at all length-scales the SDSS galaxies, the dark matter and the Millennium simulations all exhibit the same scaling behaviour. It is also quite clear that on small scales, less than approximately and for and respectively, this scaling behaviour is distinctly different from that of the random samples. The scaling behaviour of the actual data, simulations and the random sample all appear to match as , and the curves all coincide if plotted on the same scale. The match between the data and the random samples indicates a transition to homogeneity at a length-scale smaller than , and the issue is to identify the length-scale where this transition occurs.
As discussed earlier, we have numerically differentiated to calculate the Minkowski-Bouligand dimension at different value of . The results are shown in Figure 2 for and . The behaviour is similar for other values of . We expect the random samples to have , the same as the dimension of the ambient space, irrespective of the value of . We find that has values close to , the deviations being less than . At length-scales of the data and the simulations have values that are quite different from the random samples. We find and for and respectively. The difference from the random samples is larger than the statistical fluctuations expected for the data, It is clear from this figure that the SDSS data is consistent with the random data at length-scales and larger. Based on this we conclude that the transition to homogeneity occurs at a length-scale between and . We note that the dark matter N-body simulations and the Millennium simulation also exhibit a transition to homogeneity at a similar length-scale as the SDSS galaxies.
We next consider the full spectrum of generalised dimension with at and (Figure 3). At the SDSS and random data are consistent for positive , but they do not agree for where is larger for the SDSS data. This indicates that at the overdense regions are consistent with homogeneity whereas the underdense regions are not. At we find that the SDSS and random data are consistent for the entire range that we have analysed. This is in keeping with our conclusion that the transition to homogeneity occurs at a length-scale between and .
Our results are in disagreement with similar analyses by Sylos Labini et al. (2007, 2009a, 2009b) who report long range correlations and persistent fluctuations in the large scale galaxy distribution, and fail to find a transition to homogeneity. The results of this paper are in good agreement with an earlier 2D analysis of the SDSS main galaxy sample (Yadav et al., 2005) and the SDSS LRG sample (Hogg et al., 2005) both of which find a transition to homogeneity at around . Note that the LRG sample covers a much larger volume as compared to the main galaxy sample considered in this paper. A visual inspection of the galaxy distribution reveals that the galaxies appear to be distributed in an interconnected network of filaments encircling voids. This network, referred to as the “Cosmic Web”, appears to fill the entire region covered by galaxy surveys. Bharadwaj et al. (2004) and Pandey & Bharadwaj (2005) have shown that the observed filaments are statistically significant only to length-scales of and not beyond. Longer filaments, though seen, are produced by chance alignments and are not statistically significant. The good agreement between all of these findings provide strong evidence that the galaxy distribution exhibits a transition to homogeneity at around .
Acknowledgment
BP acknowledges Darren Croton for his help in analysing the Millennium catalogue. P.S. acknowledges financial support of University Grant Commission, India. JY thanks J. S. Bagla, T. R. Seshadri, S. Borgani & F. S. Labini for useful discussions.
The SDSS DR6 data was downloaded from the SDSS skyserver http://cas.sdss.org/dr6/en/. Funding for the creation and distribution of the SDSS Archive has been provided by the Alfred P. Sloan Foundation, the Participating Institutions, the National Aeronautics and Space Administration, the National Science Foundation, the U.S. Department of Energy, the Japanese Monbukagakusho, and the Max Planck Society. The SDSS Web site is http://www.sdss.org/.
The SDSS is managed by the Astrophysical Research Consortium (ARC) for the Participating Institutions. The Participating Institutions are The University of Chicago, Fermilab, the Institute for Advanced Study, the Japan Participation Group, The Johns Hopkins University, the Korean Scientist Group, Los Alamos National Laboratory, the Max-Planck-Institute for Astronomy (MPIA), the Max-Planck-Institute for Astrophysics (MPA), New Mexico State University, University of Pittsburgh, Princeton University, the United States Naval Observatory, and the University of Washington.
The Millennium Run simulation used in this paper was carried out by the Virgo Supercomputing Consortium at the Computing Centre of the Max-Planck Society in Garching. The semi-analytic galaxy catalogue is publicly available at http://www.mpa-garching.mpg.de/galform/agnpaper.
References
- Adelman-McCarthy et al. (2008) Adelman-McCarthy, J. K., et al. 2008, ApJS, 175, 297
- Amendola & Palladino (1999) Amendola, L., & Palladino, E. 1999, ApJ Letters, 514, L1
- Bagla et al. (2008) Bagla, J. S., Yadav, J., & Seshadri, T. R. 2008, MNRAS, 390, 829
- Baryshev & Bukhmastova (2004) Baryshev, Y. V., & Bukhmastova, Y. L. 2004, Astronomy Letters, 30, 444
- Best (2000) Best, J. S. 2000, ApJ, 541, 519
- Bharadwaj et al. (1999) Bharadwaj, S., Gupta, A. K., & Seshadri, T. R. 1999, A&A, 351, 405
- Bharadwaj et al. (2004) Bharadwaj, S., Bhavsar, S. P., & Sheth, J. V. 2004, ApJ, 606, 25
- Borgani (1995) Borgani, S. 1995, Physics Reports, 251, 1
- Bruzual & Charlot (2003) Bruzual, G. & Charlot, S. 2003, MNRAS, 344, 1000
- Coleman & Pietronero (1992) Coleman, P. H., Pietronero, L. 1992, Physics Reports, 213, 311
- Croton et al. (2006) Croton et al. 2006, MNRAS, 365, 11
- de Lapparent & Slezak (2007) de Lapparent, V., & Slezak, E. 2007, A&A, 472, 29
- Guzzo (1997) Guzzo, L. 1997, New Astronomy, 2, 517
- Hatton (1999) Hatton, S. 1999, MNRAS, 310, 1128
- Hogg et al. (2005) Hogg, D. W., Eisenstein, D. J., Blanton, M. R., Bahcall, N. A., Brinkmann, J., Gunn, J. E., & Schneider, D. P. 2005, ApJ, 624, 54
- Jones et al. (2005) Jones, B. J., Martínez, V. J., Saar, E., & Trimble, V. 2005, Reviews of Modern Physics, 76, 1211
- Komatsu et al. (2009) Komatsu, E., et al. 2009, ApJS, 180, 330
- Kurokawa et al. (2001) Kurokawa, T., Morikawa, M., & Mouri, H. 2001, A&A, 370, 358
- Martinez & Jones (1990) Martinez, V. J., & Jones, B. J. T. 1990, MNRAS, 242, 517
- Pan & Coles (2000) Pan, J., & Coles, P. 2000, MNRAS, 318, L51
- Pandey & Bharadwaj (2005) Pandey, B., & Bharadwaj, S. 2005, MNRAS, 357, 1068
- Peebles (1980) Peebles, P. J. E. 1980, The large scale structure of the Universe. Princeton, N.J., Princeton University Press, 1980. 435 p.,
- Press et al. (1992) Press, W. H., Teukolsky, S. A., Vetterling, W. T., & Flannery, B. P. 1992, Cambridge: University Press, —c1992, 2nd ed.,
- Springel et al. (2005) Springel et al. 2006, Nature, 435, 629
- Stoughton et al. (2002) Stoughton, C., et al. 2002, AJ, 123, 485
- Strauss et al. (2002) Strauss, M. A., et al. 2002, AJ, 124, 1810
- Sylos Labini et al. (2007) Sylos Labini, F., Vasilyev, N. L., & Baryshev, Y. V. 2007, A&A, 465, 23
- Sylos Labini et al. (2009a) Sylos Labini, F., Vasilyev, N. L., & Baryshev, Y. V. 2009a, Europhysics Letters, 85, 29002
- Sylos Labini et al. (2009b) Sylos Labini, F., Vasilyev, N. L., Pietronero, L., & Baryshev, Y. V. 2009b, Europhysics Letters, 86, 49001
- Tikhonov et al. (2000) Tikhonov, A. V., Makarov, D. I., & Kopylov, A. I. 2000, Bull. Special Astrophys. Obs., 50, 39
- Weinberg (2008) Weinberg, S. 2008, Cosmology, Oxford University Press, Oxford, UK, 2008
- Yadav et al. (2005) Yadav, J., Bharadwaj, S., Pandey, B., & Seshadri, T. R. 2005, MNRAS, 364, 601