The SAURON project - XIII. SAURON-GALEX study of early-type galaxies: the ultraviolet colour-magnitude relations and Fundamental Planes
Abstract
We present Galaxy Evolution Explorer (GALEX) far (FUV) and near (NUV) ultraviolet imaging of nearby early-type galaxies from the SAURON representative sample of E/S0 galaxies, all of which have ground-based optical imaging from the MDM Observatory. The surface brightness profiles of nine galaxies ( per cent) show regions with blue UVoptical colours suggesting recent star formation. Five of these ( per cent) show blue integrated UVoptical colours that set them aside in the NUV integrated colour-magnitude relation. These are objects with either exceptionally intense and localised NUV fluxes or blue UVoptical colours throughout. They also have other properties confirming they have had recent star formation, in particular H absorption higher than expected for a quiescent population and a higher CO detection rate. This suggests that residual star formation is more common in early-type galaxies than we are used to believe. NUV-blue galaxies are generally drawn from the lower stellar velocity dispersion ( km s-1) and thus lower dynamical mass part of the sample. We have also constructed the first UV Fundamental Planes and show that NUV blue galaxies bias the slopes and increase the scatters. If they are eliminated the fits get closer to expectations from the virial theorem. Although our analysis is based on a limited sample, it seems that a dominant fraction of the tilt and scatter of the UV Fundamental Planes is due to the presence of young stars in preferentially low-mass early-type galaxies. Interestingly, the UVoptical radial colour profiles reveal a variety of behaviours, with many galaxies showing signs of recent star formation, a central UV-upturn phenomenon, smooth but large-scale age and metallicity gradients, and in many cases a combination of these. In addition, FUVNUV and FUV colours even bluer than those normally associated with UV-upturn galaxies are observed at the centre of some quiescent galaxies. Four out of the five UV-upturn galaxies are slow rotators. These objects should thus pose interesting challenges to stellar evolutionary models of the UV-upturn.
keywords:
galaxies: elliptical and lenticular, cD – galaxies: evolution – galaxies: fundamental parameters – galaxies: photometry – galaxies: structure – ultraviolet: galaxies.1 INTRODUCTION
The dominant formation mechanism of early-type galaxies remains one of the long-standing debates of modern astrophysics. The classical monolithic model (e.g. Eggen, Lynden-Bell & Sandage, 1962; Larson, 1974) suggests that early-type galaxies form in highly efficient starbursts at high redshifts and evolve without much residual star formation from that point onward. On the other hand, the popular lambda cold dark matter (CDM) paradigm strongly suggests a hierarchical merger scenario for massive early-type galaxies (e.g. Toomre and Toomre, 1972). In this model, early-type galaxies form as the result of successive mergers and are thought to have continued or episodic star formation events.
Numerous tests discriminate between these scenarios. For example, the optical colour-magnitude relations (CMRs) of early-type galaxies consistently reveal a small scatter around the mean relation (e.g. Bower, Lucey & Ellis, 1992; Ellis et al., 1997; Stanford, Eisenhardt & Dickinson, 1998; van Dokkum et al., 2000), apparently supporting the monolithic scenario. Deep imaging surveys have however shown that many early-types possess shells, tidal features (e.g. Schweizer & Seitzer, 1992) and signatures of ongoing or recent star formation (RSF; e.g. NGC 2865, Hau, Carter & Balcells, 1999; Raimann et al., 2005). Integral-field spectroscopy now also allows to obtain spatially resolved maps of various galaxy properties. For example, we have previously highlighted the importance of central stellar discs and kinematically-decoupled cores in the SAURON sample (e.g., de Zeeuw et al. 2002, hereafter Paper II; Krajnović et al. 2008, hereafter Paper XII).
More recently, the Galaxy Evolution Explorer (GALEX) satellite opened up the ultraviolet (UV) window, allowing to probe the recent star formation history of galaxies with much greater accuracy than was previously possible with only optical information. The rest-frame UV is one order of magnitude more sensitive than the optical to the presence of hot stars, easily revealing populations younger than Gyr. Yi et al. (2005) used GALEX Medium Imaging Survey data to construct the first near ultraviolet (NUV) CMR of early-type galaxies classified by the Sloan Digital Sky Survey (SDSS). They found a remarkably large scatter towards blue colours and interpreted it as evidence of recent star formation. Kaviraj et al. (2007) and Schawinski et al. (2007) subsequently found that the fraction of early-type galaxies that experienced recent star formation in the last billion years can be greater than per cent. Young, Bendo & Lucero (2009) further concluded that the star formation rates of nearby early-type galaxies derived from mid-infrared imaging are in good agreement with the UV results. There is thus clear evidence for residual star formation in the local early-type galaxy population and for its influence on global scaling relations, at least colour-magnitude relations.
The Fundamental Plane (FP) is another key scaling relation of early-type galaxies, a two-dimensional plane in the three-dimensional manifold of their global structural parameters (effective radius, surface brightness and stellar velocity dispersion; e.g. Dressler et al. 1987; Djorgovski & Davis 1987), and may also be affected by RSF. Under the assumption of structural homology (i.e. that all early-type galaxies have the same mass distribution and kinematics), the virial theorem implies that the FP parameters should scale in a specific manner, but observations reveal a tilt of the FP away from the virial prediction. Numerous studies have investigated this, and the observed tilt has been attributed to a variation of the mass-to-light ratio across the sequence of early-type galaxies and/or to the breaking of the homology assumption (see, e.g., Dressler et al. 1987; Djorgovski & Davis 1987; Guzmán et al. 1993; Jørgensen et al. 1996; Scodeggio 1997; Pahre et al. 1998; Kelson et al. 2000; Bernardi et al. 2003; Treu et al. 2006; Cappellari et al. 2006, hereafter Paper IV; Bolton et al. 2008). Nevertheless, much debate still exists on the origin of the tilt and the scatter about the mean relation (e.g. D’Onofrio et al. 2006 and references therein).
Spatially-resolved galaxy data provide valuable information on the details of the stellar population distributions, especially when combined with UV data. Hence, we aim here to obtain a UV database matching the SAURON integral-field data, and present spatially-resolved UV and optical imaging of most early-type galaxies in the SAURON survey. Numerous investigations can be performed with such a database, but we will focus here on revisiting the effects of star formation on the scaling relations of early-types, particularly colour-magnitude relations and the Fundamental Plane. Longstanding enigmas such as the UV-upturn phenomenon (see O’Connell 1999 and references therein) are closely related.
In this paper, we thus present and discuss our UV imaging of SAURON early-type galaxies obtained with GALEX, along with ground-based optical imaging from the MDM Observatory. In § 2, we present a brief summary of the SAURON survey and our optical observations, and then describe at length the GALEX observations and surface photometry. In § 3, we discuss the UV colour-magnitude relations, the first UV Fundamental Planes, and make an attempt at interpreting radial UVoptical colour profiles. We summarize our findings in § 4.
2 OBSERVATIONS AND DATA REDUCTION
2.1 SAURON integral-field spectroscopy
The SAURON observations are aimed at determining the two-dimensional stellar kinematics (Emsellem et al. 2004, hereafter Paper III), stellar linestrengths (Kuntschner et al. 2006, hereafter Paper VI) and ionised gas kinematics (Sarzi et al. 2006, hereafter Paper V) of nearby early-type galaxies and spiral bulges in the field and clusters (see Paper II). The observations and data reduction are described in the relevant papers. Detailed dynamical modeling is also available (see, e.g., Paper IV; Emsellem et al. 2007, hereafter Paper IX; Cappellari et al. 2007, hereafter Paper X).
2.2 Optical observations
Ground-based optical imaging observations in the Hubble Space Telescope (HST) filter F555W (similar to Johnson ) were obtained using the MDM Observatory 1.3-m McGraw-Hill Telescope, as part of a large survey targeting the whole SAURON galaxy sample. The MDM observations are described in detail in Falcón-Barroso et al. (in prep.) and were reduced and calibrated in the standard manner. The field-of-view of the MDM images is with pixels, allowing for accurate sky subtraction and proper sampling of the seeing. The seeing during the observations was typically arcsec. The total magnitudes we use in this paper are also from Falcón-Barroso et al. (in prep.).
2.3 UV observations
We obtained both FUV (– Å) and NUV (– Å) images of E/S0 galaxies using the medium-depth imaging mode of GALEX, as part of an ongoing UV imaging survey of the SAURON sample (GALEX guest investigator programmes GI1–109 and GI3–041) and the GALEX Nearby Galaxy Survey (NGS; Gil de Paz et al., 2007). Of the early-type galaxies in the SAURON sample, are too close to UV-bright stars to be observed with GALEX and from our programmes have not been observed yet, similarly for galaxies from other guest investigator programmes, explaining the current sample of . The typical exposure time per field was one orbit ( s) but occasionally more. Details of the GALEX instruments, pipeline and calibration are described in Martin et al. (2005) and Morrissey et al. (2005, 2007). We note in particular a possible systematic error in the FUV and NUV zero-points of up to mag. This is not included in the uncertainties quoted in the current paper as we are mostly interested in the relative colours of our objects. The spatial resolutions of the images are approximately and FWHM in FUV and NUV, respectively, sampled with pixels.
| Galaxy | D | e | Total apparent magnitude | UV type | ||||||
| FUV | NUV | FUV | NUV | FUV | NUV | |||||
| (Mpc) | (km s-1) | (arcsec) | (mag) | (mag) | ||||||
| NGC0474 | 0.034 | 26.1 | 150 | 74 | 67 | 28.96 0.49 | 26.96 0.31 | 17.78 0.37 | 15.82 0.28 | RSF |
| NGC0524 | 0.083 | 24.0 | 235 | 17 | 39 | 25.90 0.30 | 25.82 0.26 | 17.70 0.13 | 15.88 0.15 | |
| NGC0821 | 0.110 | 24.1 | 189 | 27 | 33 | 27.21 0.50 | 25.84 0.27 | 18.10 0.36 | 15.77 0.12 | A/Z |
| NGC1023 | 0.061 | 11.4 | 182 | 44 | 70 | 26.38 0.30 | 25.76 0.25 | 16.16 0.15 | 14.53 0.12 | RSF |
| NGC2695 | 0.018 | 32.4 | 188 | 13 | 27 | 25.89 0.28 | 25.96 0.24 | 18.32 0.11 | 16.81 0.11 | UVX, A/Z |
| NGC2699 | 0.020 | 26.9 | 124 | 9 | 27 | 25.93 0.29 | 26.32 0.26 | 19.06 0.14 | 17.27 0.16 | A/Z |
| NGC2768 | 0.044 | 22.4 | 216 | 50 | 77 | 27.86 0.38 | 26.82 0.31 | 16.75 0.26 | 15.35 0.27 | |
| NGC2974 | 0.054 | 21.5 | 233 | 11 | 29 | 24.91 0.27 | 25.43 0.23 | 17.71 0.09 | 16.10 0.09 | RSF |
| NGC3032 | 0.017 | 22.0 | 90 | 2 | 3 | 20.83 0.25 | 20.43 0.20 | 16.94 0.05 | 15.78 0.01 | RSF |
| NGC4150 | 0.018 | 13.7 | 77 | 5 | 18 | 23.46 0.25 | 24.32 0.21 | 18.20 0.17 | 16.10 0.03 | RSF |
| NGC4278 | 0.029 | 16.1 | 231 | 27 | 44 | 23.63 0.25 | 24.49 0.21 | 16.41 0.08 | 15.21 0.07 | UVX, A/Z |
| NGC4374 | 0.040 | 18.5 | 278 | 38 | 65 | 25.63 0.27 | 25.42 0.23 | 15.72 0.09 | 14.35 0.08 | UVX |
| NGC4387 | 0.033 | 18.0 | 98 | 12 | 15 | 26.33 0.31 | 25.08 0.22 | 19.03 0.18 | 17.27 0.06 | |
| NGC4458 | 0.024 | 16.4 | 85 | 13 | 23 | 27.08 0.41 | 25.95 0.25 | 19.40 0.26 | 16.84 0.11 | |
| NGC4459 | 0.046 | 16.1 | 168 | 13 | 20 | 24.63 0.26 | 24.13 0.21 | 17.02 0.07 | 15.49 0.03 | RSF |
| NGC4473 | 0.028 | 15.3 | 192 | 25 | 47 | 26.09 0.29 | 25.60 0.23 | 17.11 0.11 | 15.24 0.08 | |
| NGC4477 | 0.032 | 16.7 | 162 | 30 | 33 | 27.36 0.40 | 26.04 0.25 | 17.24 0.15 | 15.48 0.08 | |
| NGC4486 | 0.022 | 17.2 | 298 | 36 | 51 | 24.29 0.26 | 24.46 0.21 | 14.50 0.06 | 13.92 0.03 | UVX |
| NGC4526 | 0.022 | 16.9 | 222 | 25 | 26 | 25.60 0.27 | 24.24 0.21 | 16.59 0.09 | 15.22 0.03 | RSF |
| NGC4546 | 0.034 | 14.1 | 194 | 23 | 54 | 26.33 0.31 | 25.85 0.24 | 17.56 0.13 | 15.41 0.13 | A/Z |
| NGC4550 | 0.039 | 15.5 | 110 | 7 | 14 | 24.30 0.26 | 24.05 0.21 | 18.05 0.18 | 16.41 0.03 | RSF |
| NGC4552 | 0.041 | 15.9 | 252 | 13 | 19 | 23.39 0.25 | 23.59 0.21 | 15.85 0.06 | 14.94 0.02 | UVX |
| NGC4564 | 0.035 | 15.9 | 155 | 5 | 21 | 23.15 0.25 | 24.65 0.21 | 17.71 0.06 | 16.09 0.04 | UVX, A/Z |
| NGC4570 | 0.022 | 17.1 | 173 | 13 | 26 | 25.00 0.26 | 25.00 0.22 | 17.52 0.08 | 15.95 0.05 | A/Z |
| NGC4621 | 0.033 | 14.9 | 211 | 11 | 35 | 23.83 0.26 | 24.93 0.22 | 16.65 0.06 | 15.25 0.05 | UVX |
| NGC5198 | 0.023 | 38.4 | 179 | 7 | 18 | 24.92 0.27 | 25.47 0.23 | 18.86 0.11 | 17.23 0.08 | UVX, A/Z |
| NGC5308 | 0.018 | 29.4 | 208 | 12 | 25 | 25.75 0.28 | 25.66 0.23 | 18.36 0.11 | 16.81 0.09 | A/Z |
| NGC5813 | 0.057 | 32.2 | 230 | 40 | 80 | 27.20 0.35 | 26.82 0.32 | 17.19 0.24 | 15.50 0.34 | A/Z |
| NGC5831 | 0.059 | 27.2 | 151 | 15 | 55 | 26.23 0.30 | 26.70 0.31 | 18.36 0.15 | 16.20 0.32 | A/Z |
| NGC5838 | 0.053 | 24.7 | 240 | 10 | 21 | 24.81 0.27 | 24.73 0.22 | 17.77 0.08 | 16.16 0.05 | |
| NGC5845 | 0.053 | 25.9 | 239 | 6 | 6 | 24.59 0.27 | 23.59 0.21 | 18.78 0.12 | 17.70 0.02 | A/Z |
| NGC5846 | 0.055 | 24.9 | 238 | 22 | 32 | 25.37 0.27 | 25.15 0.23 | 16.66 0.09 | 15.51 0.07 | UVX |
| NGC5982 | 0.018 | 51.7 | 229 | 12 | 29 | 25.19 0.27 | 25.58 0.23 | 17.76 0.08 | 16.25 0.08 | UVX, A/Z |
| NGC7457 | 0.052 | 13.2 | 78 | 37 | 43 | 26.35 0.30 | 25.89 0.25 | 18.39 0.31 | 15.83 0.13 | RSF |
Columns: (1) Galaxy identifier. (2) Galactic extinction in the NASA/IPAC Extragalactic Database (NED) from Schlegel, Finkbeiner & Davis (1998). (3) Distance from Falcón-Barroso et al. (in prep.). (4) Velocity dispersion of the luminosity-weighted spectrum within a circular aperture of from Paper IX. The uncertainty is taken as per cent. (5)–(6) Effective radius in each band. The uncertainties are taken as per cent. (7)–(8) effective surface brightness in each band and error. (9)–(10) Total apparent magnitude in each band and error. (11) UVoptical radial colour profiles classification. RSF: recent star formation. UVX: UV-upturn. A/Z: large-scale age and/or metallicity gradient.
2.4 Photometry
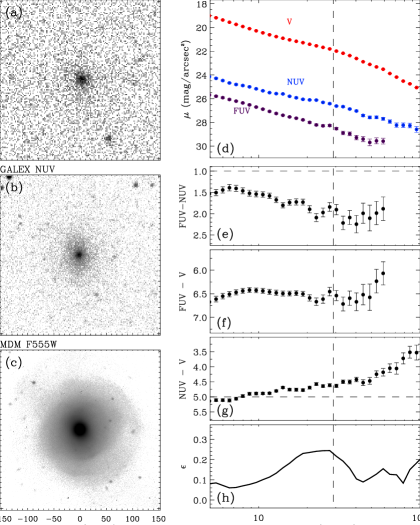
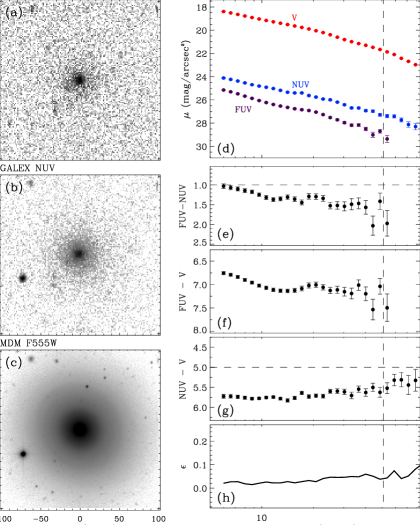
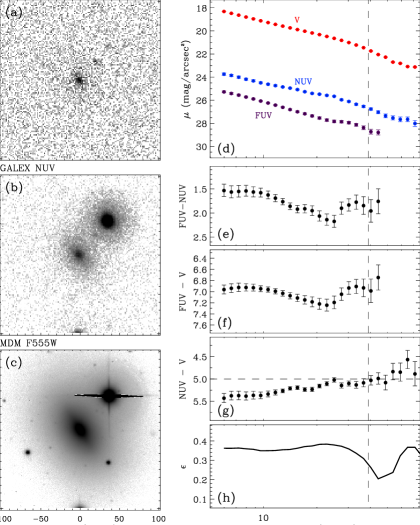
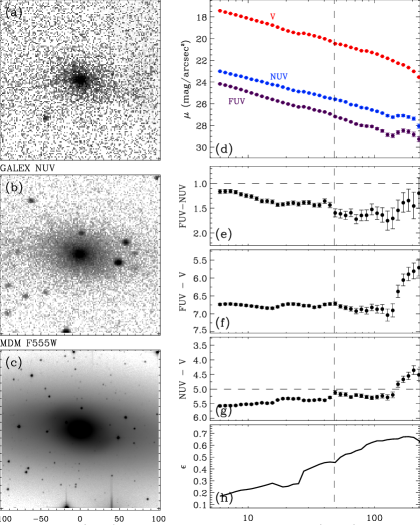
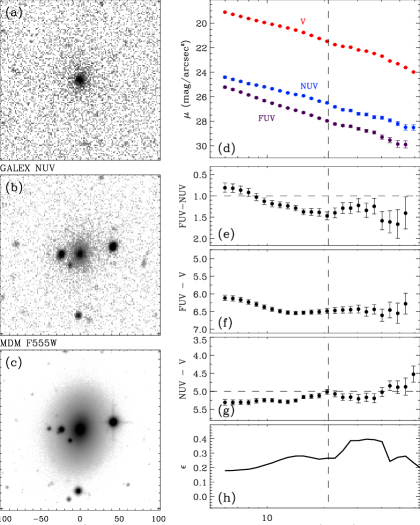
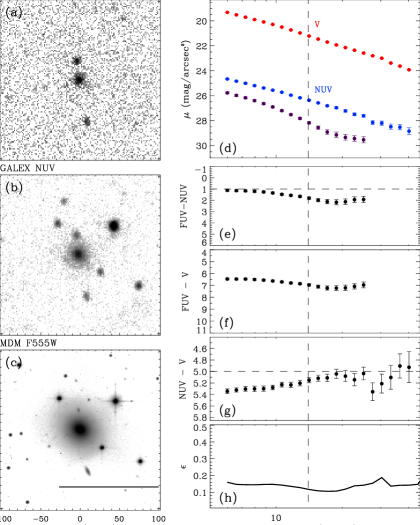
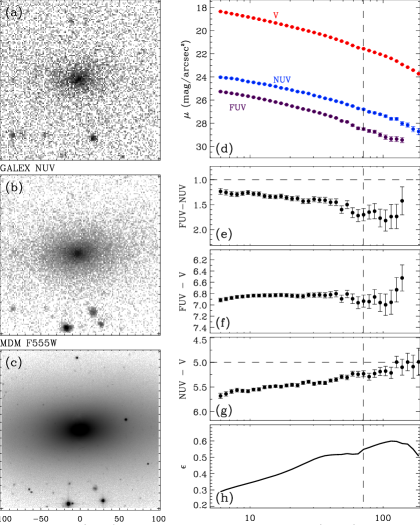
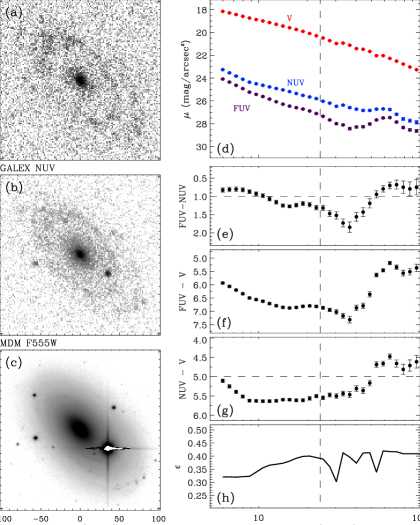
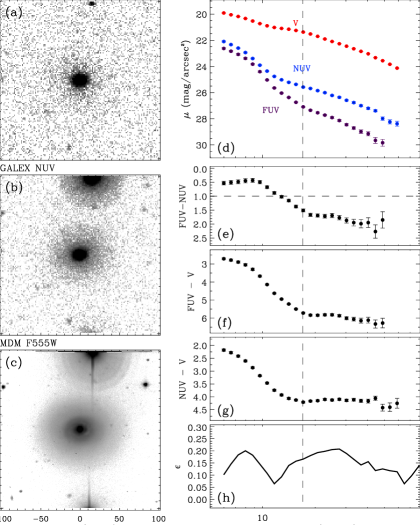
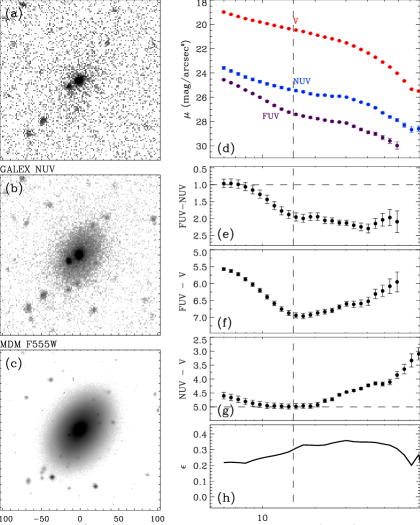
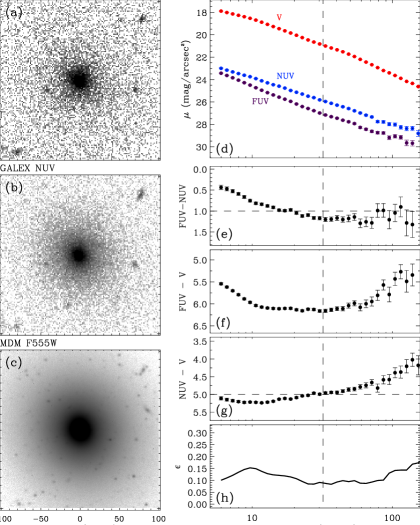
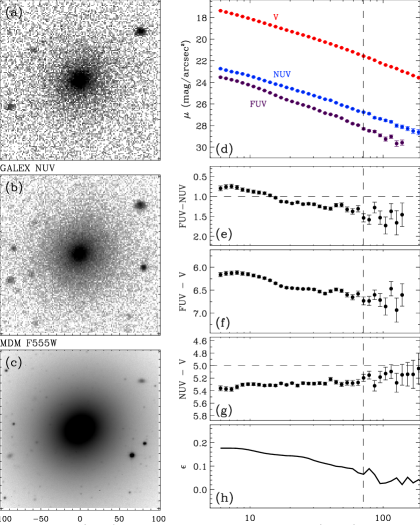
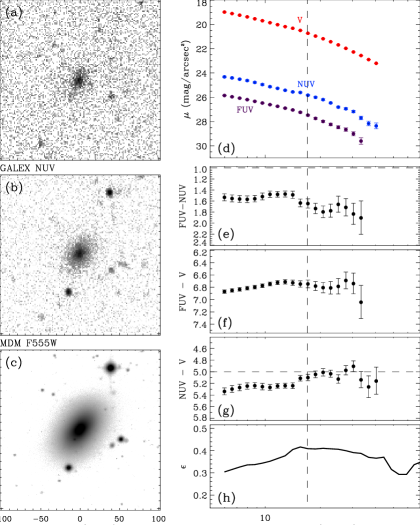
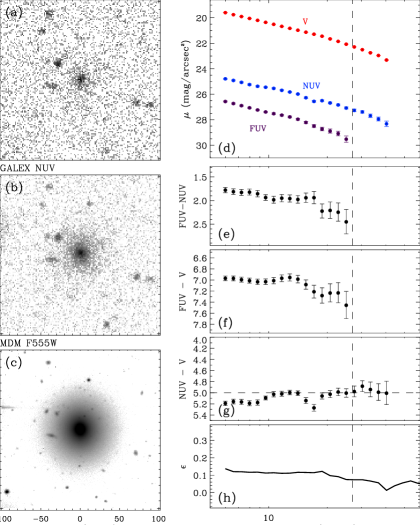
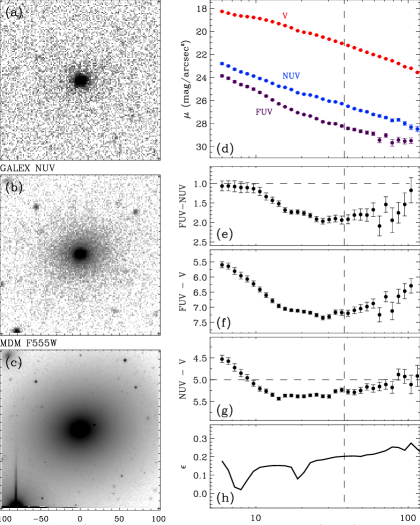
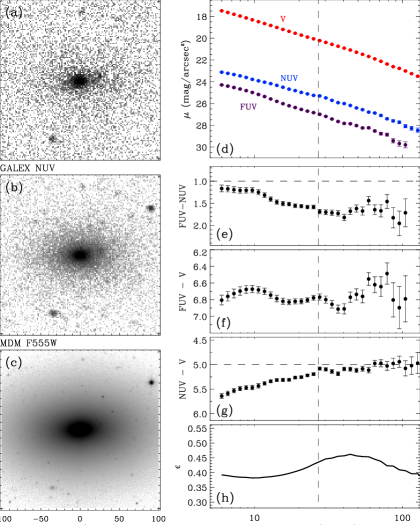
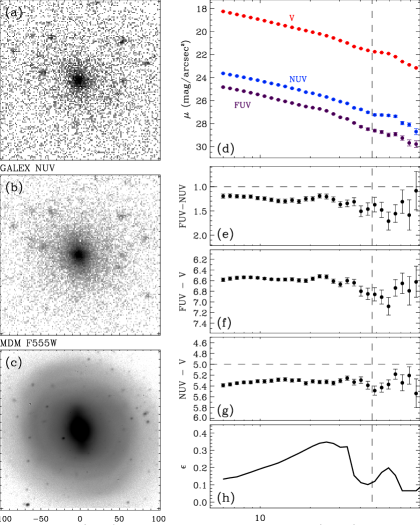
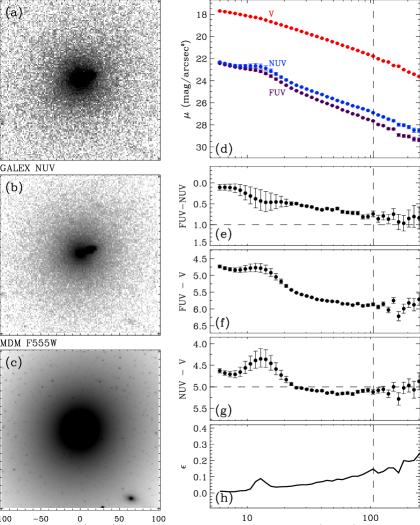
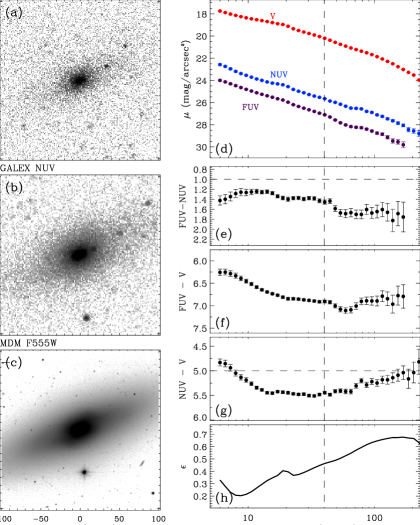
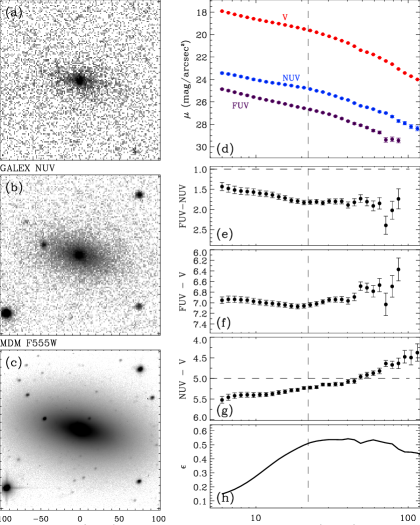
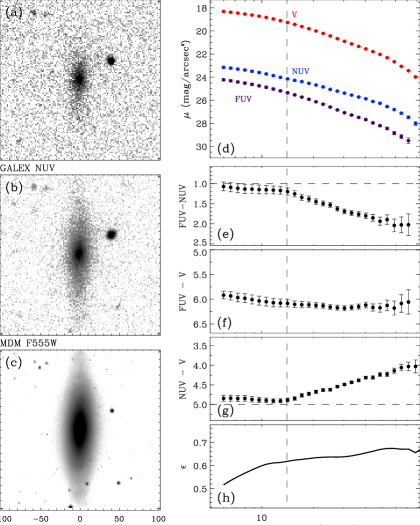
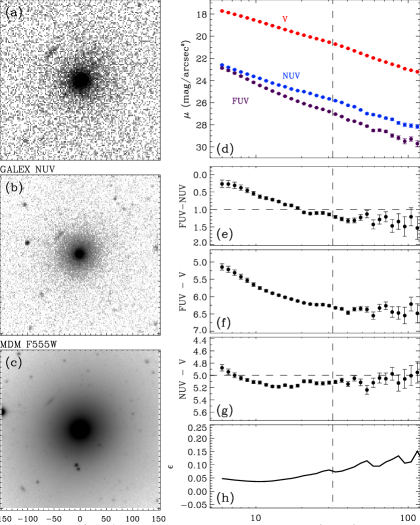
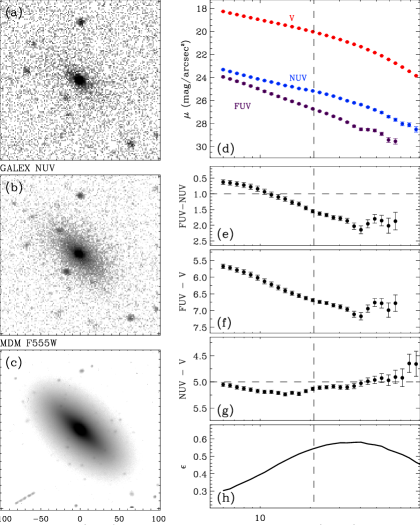
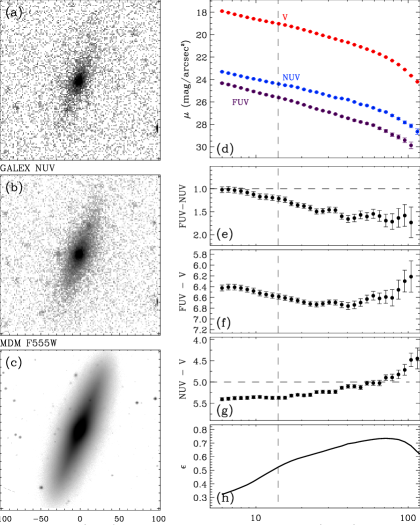
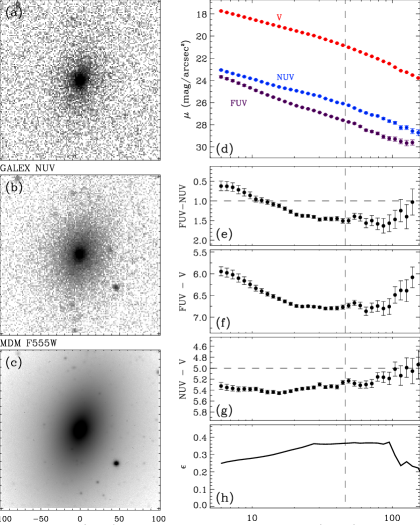
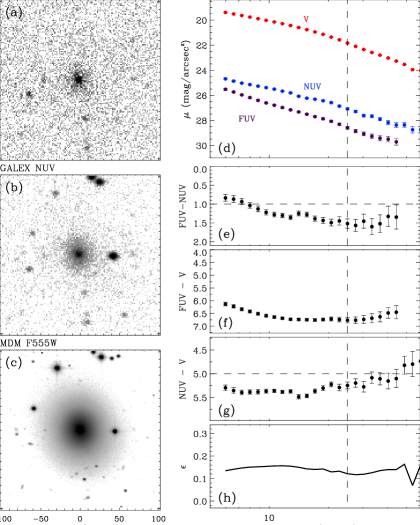
The GALEX UV images are delivered pre-processed but we undertook our own estimate of the sky values. This was calculated for each image as the mean of the sky values in – image regions after masking-out Sextractor-detected sources. Typical mean sky values were counts pixel-1 in FUV and counts pixel-1 in NUV. We computed the mean sky value uncertainty in each image from the distribution of sky values in the small regions assuming a Gaussian distritubion. These were typically counts pixel-1 in FUV and counts pixel-1 in NUV. We took the low level flat fielding errors to be negligible, so these measurements form the basis of the errors plotted in the individual FUV and NUV radial surface brightness profiles of Figure 1. At large radii, the galaxies are faint and only a few counts are detected in each pixel. Accurately determining the level of the sky, even if faint, is thus the main factor limiting the depth of the images and our surface photometry. The UV radial profiles in Figure 1 are truncated when the uncertainty in the surface brightness exceeds mag arcsec-2. The V band profiles are truncated at the same radial distance where their corresponding NUV profiles end.
We convolved the FUV and optical data to the spatial resolution of the NUV observations before any analysis, to avoid spurious colour gradients in the inner parts. We carried out surface photometry by measuring the surface brightness along elliptical annuli, using the iterative method described by Jedrzejewski (1987) and implemented in the ELLIPSE task within the STSDAS ISOPHOTE package in IRAF (Image Reduction and Analysis Facility). The centre of the isophotes was fixed to the centre of the light distribution and the position angle (PA), ellipticity () and surface brightness () were fitted as a function of the radius. Ellipses were fitted to the -band images only, which have a far superior signal-to-noise (S/N) ratio at all radii compared with the UV images, and were then imposed on the UV images so that meaningful colours could be derived. Galactic extinction was corrected with (Cardelli, Clayton & Mathis, 1989), and (Wyder et al., 2005) using reddening maps from Schlegel, Finkbeiner & Davis (1998). We present the GALEX FUV, NUV and MDM F555W images as well as the surface-brightness, colour and ellipticity radial profiles in Figure 1. The vertical dashed lines in Figure 1 show the effective radii determined by the SAURON survey at band (see Paper VI). For reference, a UV spectral slope of zero in the - plane is roughly the same as FUVNUV in AB magnitudes (shown as a horizontal line in the FUVNUV colour profiles of Figure 1). We give comments on notable features in the profiles of individual galaxies in Appendix A.

From the radial surface brightness profiles, we derived total apparent magnitudes by extrapolating the growth curves to infinity. For each profile, we first calculated the integrated apparent magnitude () within elliptical isophotes up to the radius where the uncertainty in the surface brightness reaches mag arcsec-2. We then computed the slope of the growth curve () within that region, plotted it as a function of the integrated magnitude , and fitted a straight line to the outer parts. The value of where the extrapolated value of is was taken as the total apparent magnitude. Selecting a suitable radial range for growth curve fitting was occasionally difficult in FUV because of the low S/N in the outer parts, but the errors quoted correspond to the uncertainties associated with the fit to the (slope of the) growth curve only, so they are probably slightly underestimated. This technique is described in more detail in Cairós et al. (2001) and Gil de Paz et al. (2007). The effective radius (; semi-major axis of the elliptical aperture containing half the light), the mean surface brightness within () and their uncertainties were also calculated from the growth curve. Having said that, the uncertainty in arising from different measurement methods is always larger than formal uncertainties, and a comparison of different measurements shows that it is typically per cent, which we adopt (see Falcón-Barroso et al., in prep.).
In Figure 2, we show the comparison of our magnitudes and effective radii in both FUV and NUV with those of Gil de Paz et al. (2007). The agreement is generally good. The mean of the absolute values of the total apparent magnitude differences is mag in both FUV and NUV, as expected generally somewhat larger than our formal uncertainties. For the effective radii, the mean absolute difference is per cent in FUV and per cent in NUV, so generally within our errors. The integrated UV and other properties are listed in Table 1.
3 DISCUSSION
3.1 UV colour-magnitude relations

The simplest new data product obtained from our GALEX observations is the integrated UV apparent magnitudes, from which we derive total absolute magnitudes using the distances listed in Table 1. Colour-magnitude relations are widely used to study the star formation history (SFH) of early-type galaxies. The NUV CMR (see, e.g., Yi et al., 2005; Kaviraj et al., 2007) is a particularly good tool for tracking recent star formation, owing to its high sensitivity to the presence of young stellar populations. Figure 3 shows the UV–optical CMRs. It also shows the red sequence NUV fit of Yi et al. (2005), after correcting for the sky measurement offset from the GALEX pipeline (see Gil de Paz et al., 2007). The scatter in the CMRs of Figure 3 is significant and there are clearly outliers about the red sequence relation. We henceforth attempt to quantify the effects of recent star formation on those relations.
Most UV photons are emitted by stars younger than a few hundred megayears, so they are useful to trace residual star formation, but FUV flux can also be generated by evolved hot helium-burning stars (the so-called UV-upturn phenomenon; see, e.g., Yi, Demarque & Oemler 1997 and O’Connell 1999 for reviews). Star formation studies thus usually use the NUV passband instead (Yi et al., 2005), although it is nevertheless important to know how much of the NUV flux can originate from the UV-upturn phenomenon. NGC 4552 is a famous UV-upturn galaxy; its FUV colour is one of the bluest among nearby elliptical galaxies with no sign of recent star formation. We measure a NUV colour of mag for NGC 4552, so considering the measurement error we adopt a very conservative upper limit of NUV to pick out galaxies that have experienced recent star formation. This empirical demarcation for identifying recent star formation galaxies is shown as a horizontal dashed line in the NUV colour profiles of Figure 1 and the NUV CMR of Figure 3. We henceforth assume that the relative FUV strength of NGC 4552 is the maximum that can be generated by purely old-star populations. This is an ad hoc assumption, however it is frequently made and is empirically grounded.
Using this empirical criterion, we have identified the galaxies that are likely to have experienced a recent episode of star formation in Figure 3 onward (filled symbols). We label galaxies with NUV as quiescent early-type galaxies (QST, open symbols). Furthermore, stars and concentric circles indicate Balmer absorption line strengths H Å and field galaxies, respectively. The H indices are computed within one effective radius in the optical and come from the SAURON data published in Paper VI. Supporting our empirical threshold, four out of five recent star formation candidate galaxies (NGC 3032, NGC 4150, NGC 4550 and NGC 7457) also show enhanced H line strengths, a widely-used post-starburst signature. The only exception (NGC 474) is noted for its shell structures located in the outer regions, at arcsec, and as shown in Figure 1 the total NUV flux is dominated by these outer regions, whereas the Balmer line was measured within in the optical.
A more in-depth look at Figure 3, with likely recent star formation galaxies identified, reveals that a non-negligible fraction of the scatter in the UV CMRs (and the departure from the Yi et al. 2005 red sequence relation) is due to galaxies with recent star formation. For example, the scatter in the (NUV)-MV CMR increases by per cent between least-square fits excluding and including RSF candidates. The overall fraction of galaxies with RSF is per cent (). This may appear to also agree with the result of Yi et al. (2005), but a direct comparison is not sensible because the sampling strategies are radically different. It should also be noted that no clear dependence of FUV or FUVNUV on is visible in our sample. Finally, environment does not appear to play a significant role in star formation, as the RSF galaxies selected contain both field and cluster galaxies. We recall however that the densest environment probed by the SAURON survey is that of the Virgo cluster of galaxies (see Paper II), and that our sample is admittedly too small to robustly investigate environmental effects.


We also plot the colour- (integrated stellar velocity dispersion within ) and colour-mass (virial mass estimate) relations in Figure 4. The dynamical mass estimates are of the form (Paper IV). Recent star formation galaxies generally have lower velocity dispersions and correspondingly smaller virial masses than the majority of red early-type galaxies, and there is no RSF early-type galaxy with a velocity dispersion km s-1 (see also Schawinski et al., 2006). This implies that only low-mass early-type galaxies have formed stars recently, confirming the results of Schawinski et al. (2007). In addition, the more massive (high-velocity dispersion) early-type galaxies tend to be bluer in both FUV and FUVNUV, confirming earlier studies (e.g. Burstein et al., 1988; Donas et al., 2007).
Interestingly, using Spitzer Infrared Array Camera (IRAC) imaging and Infrared Spectrograph (IRS) spectroscopy, Shapiro et al. (in prep.) surveyed the mechanisms driving star formation in the SAURON early-type galaxies, and found that star formation happens exclusively in fast-rotating systems (see Paper IX). All of our recent star formation galaxies are also classified as star-forming galaxies in their survey, except again for NGC 474, and all are fast-rotating except NGC 4550, the peculiar galaxy with co-spatial counter-rotating discs (extensively discussed in Paper IX).
| RSF | Partial RSF | QST | |
|---|---|---|---|
| Number of sample galaxies | |||
| Galaxies detected in CO | |||
| Rate (percent) | |||
| Note: Errors assume a binomial distribution. |
Our star formation interpretation is also consistent with the results of surveys of the molecular gas emission in early-type galaxies by Combes, Young & Bureau (2007), Crocker et al. (2008) and Young, Bureau & Cappellari (2008). CO emission is detected in three of the RSF candidates (NGC 3032, NGC 4150 and NGC 4550). In the case of NGC 7457, a molecular gas mass of was reported by Welch & Sage (2003), but Combes et al. (2007) later failed to detect it. NGC 474 was also not detected by Combes et al. (2007), but the arcsec primary beam did not encompass the shells and strong NUV emission. We summarize the CO detection rates of our sample galaxies in Table 2, where we have divided the sample into three categories: RSF, partial RSF and quiescent galaxies. Again, RSF are galaxies selected by the empirical criterion NUV. Partial RSF galaxies do not satisfy the overall blue colour criterion in integrated NUV, but they show significant blue regions in their radial profiles. Quiescent galaxies have NUV at essentially all radii. The CO detection rate decreases monotonically from RSF to quiescent galaxies, thus supporting our RSF identifications and suggesting, unsurprisingly, that CO-rich galaxies tend to have had more recent star formation.
3.2 UV Fundamental Planes


Early-type galaxies follow a correlation between total luminosity and central velocity dispersion of the form , where with considerable scatter. We present this Faber-Jackson relation (Faber & Jackson, 1976) for our sample galaxies in Figure 5 for both FUV and NUV bands, using the same symbols as in Figure 3 and with a line of slope overlayed. It is striking that the galaxies previously identified as RSF are among the greatest outliers in both relations, where they are responsible for much of the total scatter. When RSF early-types are included, the scatter increases by and per cent in the FUV and NUV, respectively, compared to that when only quiescent galaxies are considered111For reference, simple linear fits to the whole sample yield the slopes of (FUV) and (NUV), whereas for the quiescent sub-sample we find (FUV) and (NUV).. This is consistent with the conclusions from our analysis of the colour-magnitude relations in the previous sub-section.
We now consider the Fundamental Plane (Djorgovski & Davis, 1987; Dressler et al., 1987), a relation between the photometric effective radius (), the mean surface brightness within () and the effective stellar velocity dispersion () of the form
| (1) |
where , and are constant coefficients derived by minimizing the residuals from the plane, and and are expected from the virial theorem if the galaxies form a homologous family with a constant mass-to-light ratio. Just as for Faber-Jackson, our velocity dispersions are measured in the optical (roughly band), while our photometric quantities are measured in the UV. The Fundamental Plane of course implicitly relies on all quantities used in the virial theorem being measured for the same stellar population. Our UV Fundamental Planes are thus somewhat hybrid, and one should keep in mind that this may introduce some biases (because of both differing apertures and wavebands). However, as UV-derived stellar kinematics is still some time away, this approach is necessary and nevertheless illuminating.
The coefficients and measured by Jørgensen et al. (1996) are and in the Gunn -band, respectively. Early investigations suggested that a variation of the coefficient in different filters would be expected if there were a systematic variation of the mass-to-light ratio of the stellar populations with galaxy luminosity or mass (e.g. Prugniel & Simien, 1996). Pahre, De Carvalho & Djorgovski (1998) indeed reported an increase of the slope with increasing wavelength (from to ), although Bernardi et al. (2003) found that the FP coefficients were approximately the same in , , and bands using a much larger but more distant sample of early-type galaxies from SDSS. Meanwhile, Trujillo, Burkert & Bell (2004) suggested that the FP tilt is mostly driven by non-homology and that stellar population effects account for only a small fraction of it. Early-types in field environments are also generally more diverse and are found to show a greater scatter in the Fundamental Plane (see, e.g., De Carvalho & Djorgovski, 1992; Zepf & Whitmore, 1993). These authors thus suggested that environment plays an important role in the process of galaxy formation and evolution. Recently, new approaches have aimed to elucidate the FP tilt, for example via gravitational lensing (Treu et al., 2006; Bolton et al., 2008) and stellar dynamical modeling (Paper IV). These studies differ from previous ones in that they do not depend on simple virial assumptions, but measure accurate dynamical masses directly. Using two different approaches, they consistently conclude that the tilt is almost entirely due to a genuine mass-to-light ratio variation and not to non-homology. However, it still remains unclear just how much of this variation can be attributed to a change in the dark matter fraction or to differences in the stellar populations.


| Band | Scatter | Population | ||
|---|---|---|---|---|
| FUV | 1.09 | 0.22 | 0.17 | All |
| FUV | 1.25 | 0.29 | 0.14 | QST |
| NUV | 1.11 | 0.23 | 0.14 | All |
| NUV | 1.82 | 0.30 | 0.08 | QST |
For the first time, we present in Figures 6 and 7 the Fundamental Planes in the FUV and NUV bands, using again the same symbols as in Figure 3. Table 3 lists the FP coefficients and scatter at both FUV and NUV, obtained from a least-square fit by minimizing the variations to the planes. Fits including and excluding RSF galaxies are listed. As mentioned above, RSF galaxies tend to have lower velocity dispersions and smaller effective radii and thus smaller masses than the bulk of the sample galaxies. Crucially, RSF galaxies systematically deviate from the best-fit planes so as to create shallower slopes, and they significantly increase the scatters. This is clearly shown by both Figures 6 and 7 and the FP parameters listed in Table 3. Although our sample is limited, this indicates that lower mass galaxies, forming a larger amount of young stars, more greatly (and systematically) deviate from the plane defined by the quiescent galaxies.
The long-wavelength -band slope is less sensitive to contamination from young stellar populations than optical bands (; see Pahre et al. 1998). Considering our NUV Fundamental Plane fit for the entire sample, our slope is significantly different from both the virial expectation and the -band value. However, comparing our NUV-derived slope of for quiescent galaxies only, we recover all of the -band slope and almost all of the tilt away from the virial expectation. We thus conclude that a significant fraction of the FP tilt and scatter is due to low-mass early-type galaxies with stellar populations significantly younger that those of high-mass galaxies, thus reducing their mass-to-light ratios. The FUV Fundamental Plane is more complicated to interpret because of the additional presence of old but hot stars (UV upturn phenomenon), but a similar if weaker trend is observed.
The tilt of the Fundamental Plane was also considered in Paper IV using -band photometry and sophisticated dynamical modeling. The main result to emerge was a clear, continuous and monotonic increase of the total dynamical mass-to-light ratio with velocity dispersion, consistent with the FP tilt. As can be seen here in Figure 4, the NUV blue galaxies affecting the tilt of the UV Fundamental Planes also have some of the smallest velocity dispersions and lowest virial masses. Furthermore, although there is non-negligible scatter, clear (NUV)- and (FUVNUV)- (or (NUV)- and (FUVNUV)-) relations are observed. The current results thus seem entirely consistent with that of Paper IV. We are simply picking up the galaxies with the largest and/or most recent star formation events here with our integrated NUV criterion.
Many studies have also exploited the projection of the Fundamental Plane onto the plane defined by and , i.e. the Kormendy relation (Kormendy, 1977). A clear advantage of this relation is that it is based on photometric parameters only, which are easily accessible even at high redshifts. All of our sample galaxies follow the Kormendy relation, and we note that our UV Kormendy relation slopes ( and at FUV and NUV, respectively, see Figures 6 and 7) are in rough agreement with the optical one ( in Hamabe & Kormendy 1987). It may however be significant that, compared to the mean trends, RSF galaxies tend to be slightly offset toward smaller and/or fainter objects.
3.3 UV radial colour profiles
We use the radial colour profiles to discuss the stellar populations of the sample galaxies. We discuss our criteria to classify them in groups exhibiting similar properties below, and then discuss in more detail galaxies with signs of recent star formation.
First, our main tool are the NUV radial colour profiles. As for integrated magnitudes, we classify a galaxy as having had recent star formation if its NUV profile is below for all or a significant portion of the radii probed. Galaxies included in this category are NGC 474, NGC 1023, NGC 2974, NGC 3032, NGC 4150, NGC 4459, NGC 4526, NGC 4550 and NGC 7457. Having said that, NUVoptical colours normally show negative slopes (the central regions being redder) due to variations in the properties of the underlying stellar populations, mainly age and metallicity. It is well-known that there is a significant age-metallicity degeneracy (see, e.g., Worthey, 1994), whereby it is difficult to distinguish the effects of a small change in age from those of a small change in metallicity. Therefore, and even though we recognise the qualitative aspect of such a criterion, if only a small part – usually outside the effective radius – of the UVoptical colour profiles goes smoothly and only a little below the NUV cut, we consider it as having been caused by a simple metallicity gradient rather than residual star formation. In other words, localised regions with NUV are only classified as recently star-forming if the changes in colour are abrupt. The galaxies exhibiting this behavior include NGC 821, NGC 2699, NGC 4546, NGC 4570, NGC 5308, NGC 5813, NGC 5831 and NGC 5845. Their integrated colours are all redder than the NUV colour threshold.
Second, we consider the FUVNUV profiles. If a galaxy without evidence of recent star formation has a central region with FUVNUV, we identify it as a UV-upturn galaxy. These galaxies include NGC 4374, NGC 4486, NGC 4552, NGC4621 and NGC 5846. As expected, these galaxies are among the most luminous and most massive in our sample. All except NGC 4621 are slow-rotators (see Paper IX). Significantly, some UV-upturn galaxies have extreme FUVNUV and FUV colours at small radii, bluer than the integrated aperture colours of classic UV-upturn galaxies dating from the International Ultraviolet Explorer (IUE) era. As these galaxies provided important constraints on stellar evolutionary models of the UV-upturn, it will be interesting to revisit the models with the current data. It is also probably worthwhile to point out that a number of galaxies exhibit evidence for both a UV-upturn (FUVNUV in the centre) and a substantial age or metallicity gradient (NUV in the outer parts). These galaxies are NGC 2695, NGC 4278, NGC 4564, NGC 5198 and NGC 5982. They probably harbour milder forms of the UV-upturn phenomenon, where neither the UV-upturn nor large-scale stellar population gradients dominates.
Finally, we note that some galaxies exhibit no evidence for recent star formation or a UV-upturn, and no substantial large-scale age and/or metallicity gradient. These galaxies are NGC 524, NGC 2768, NGC 4387, NGC 4458, NGC 4473, NGC 4477 and NGC 5838.
Of the nine galaxies with convincing evidence for recent star formation, five (NGC 474, NGC 1023, NGC 2974, NGC 4459 and NGC 4526) show blue UVoptical colours in some regions only (as opposed to all radii). Interestingly, this appears connected to kinematic (sub-)structures detected in SAURON and other studies. The case of NGC 474, known for its shells (e.g. Turnbull, Bridges & Carter, 1999) and strong misalignment between the kinematic and photometric major axes (see Paper III), shows blue UVoptical colours and enhanced H line strength at large radii. NGC 1023, with a prominent twist in the centre of the velocity map (Paper III), reveals a UV blob on the eastern side of the galaxy and blue UVoptical colours in the same region, probably related to an interacting gas-rich dwarf galaxy (see Morganti et al. 2006 for H I observations). The presence of a UV-prominent outer ring related to a bar in NGC 2974 was discussed by Jeong et al. (2007). Blue UVoptical colours in this galaxy are observed in the central and outer regions. In the case of NGC 4459, blue UVoptical colours are observed only in the centre. Paper VI shows that this galaxy has strong H absorption within a central dust ring associated with a decoupled stellar and ionised gas disc (Paper III and Paper V, respectively). NGC 4526 is a similar object appearing more edge-on. Both NGC 4459 and NGC 4526 also harbor central molecular gas discs (Young et al., 2008).
On the other hand, of the nine galaxies with recent star formation, NGC 3032, NGC 4150, NGC 4550 and NGC 7457 show overall blue UVoptical colours. NGC 3032 shows the bluest UVoptical colour in our sample and has a prominent peak in the H map suggesting recent and ongoing star formation. McDermid et al. (2006) identified two types of kinematically-decoupled components (KDCs) among the SAURON sample: compact KDCs, which are often young and occur in fast-rotating galaxies, and kiloparsec-scale KDCs, with homogeneously old populations in slow-rotating galaxies (see also Paper IX). NGC 3032, NGC 4150 and NGC 7457 all have small-scale KDCs (Paper III) and are considered fast rotators (Paper IX). NGC 3032 and NGC 4150 further have substantial molecular gas discs (Young et al., 2008). In the case of NGC 4550, with two counter-rotating stellar discs (see, e.g., Rubin, Graham & Kenney, 1992; Rix et al., 1992), the H line strength is elevated in the central region along the major axis (Paper VI). Its molecular gas content and detailed star formation history are discussed in Crocker et al. (2008). NGC 7457 has a controversial CO detection discussed previously (see Welch & Sage 2003 and Combes et al. 2007).
4 Summary
We have presented GALEX FUV and NUV imaging along with ground-based F555W imaging from the MDM Observatory for early-type galaxies from the SAURON survey sample. Nine of them show extended blue UVoptical colours, hinting at recent star formation. Five of these are also classified as RSF early-types by our integrated colour-magnitude relation criterion. Supporting the findings from the UV colour-magnitude relation technique, four out of the five candidate RSF galaxies also show enhanced H absorption line strengths, a widely-used post-starburst signature. The only exception (NGC 474) is noted for its outer shells. Roughly per cent of the early-type galaxies in our sample are therefore classified as RSF early types. Considering that the UV flux from a starburst is only detectable for roughly Gyr, this implies that residual star formation has been common in early-type galaxies even up to the present day. This star formation interpretation is also consistent with the results of molecular gas surveys, as the CO detection rate is roughly per cent in RSF early-type galaxies, much higher than in quiescent systems.
The velocity dispersions of these galaxies with evidence of recent star formation are among the lowest in the sample, and none has km s-1, consistent with the independent work of Schawinski et al. (2007). Recent star formation early types also tend to have smaller effective radii and thus smaller (virial) masses. Despite the limited number statistics, a key result from the present study is that RSF early types change the slopes of scaling relations (colour-magnitude relations and Fundamental Planes) and dominate the scatters in them. Most notably, much of the FP tilt and scatter can now be explained by the fact that the properties of a substantial fraction of early-type galaxies are influenced by RSF, systematically biasing their mass-to-light ratios, especially at low masses. The UV Fundamental Planes become significantly closer to the virial expectation (and tighter) when only quiescent early-type galaxies are considered. The same must be true at optical wavelengths, although the effect will be smaller. Our result appears consistent with the M/L - relation derived in Paper IV, although the current colour threshold only picks up the most extreme objects.
The radial UVoptical colour profiles not only reveal recent star formation galaxies, but also a number of galaxies with smooth large-scale age and/or metallicity gradients. Similarly, a number of galaxies exhibiting the UV-upturn phenomenon are identified. Some have bluer FUVNUV and FUV colours at small radii than the integrated aperture colours of classic UV-upturn galaxies. A number of galaxies show both a central UV-upturn and large-scale gradients. This diversity of behaviours will, in due time, need to be explained and reproduced by stellar population models.
Early-type galaxies are no longer thought to be simple. Many of them have kinematic anomalies and sub-structures that are non-trivial to interpret. We have shown here that they are also composed of multiple generations of stars widely separated in age. This is consistently found by other short-wavelength as well as far-infrared studies, mainly aided by space experiments. The presence of young stars in seemingly old populations is no longer debatable, yet it is still unclear what causes and regulates this residual star formation. We believe that our database, spatially resolving nearby early-type galaxies, will be key to answering some of those questions.
Acknowledgments
The authors thank the anonymous referee for useful comments which led to improvements in the paper. This work was supported by the Korea Research Foundation Grant funded by the Korean government (KRF-C00156) to SKY. MB acknowledges support from NASA through GALEX Guest Investigator program GALEXGI04-0000-0109. MB and SKY are grateful to the Royal Society for an International Joint Project award (2007/R2) supporting this work. RLD acknowledges support from the Royal Society in the form of a Wolfson Merit Award. MB and RLD are also grateful for postdoctoral support through STFC rolling grant PP/E001114/1. The STFC Visitors grant to Oxford also supported joint visits. GvdV acknowledges support provided by NASA through Hubble Fellowship grant HST-HF-01202.01-A awarded by the Space Telescope Science Institute, which is operated by the Association of Universities for Research in Astronomy, Inc., for NASA, under contract NAS 5-26555. MC acknowledges support from a STFC Advanced Fellowship (PP/D005574/1). Based on observations made with the NASA Galaxy Evolution Explorer. GALEX is operated for NASA by the California Institute of Technology under NASA contract NAS5-98034. Photometric data were also obtained using the 1.3m McGraw-Hill Telescope of the MDM Observatory. Part of this work is based on data obtained from the ESO/ST-ECF Science Archive Facility. This project made use of the HyperLeda database (http://leda.univ-lyon1.fr) and the NASA/IPAC Extragalactic Database (NED) which is operated by the Jet Propulsion Laboratory, California Institute of Technology, under contract with the National Aeronautics and Space Administration.
References
- Bender et al. (1992) Bender R., Burstein D., Faber S. M., 1992, ApJ, 399, 462
- Bernardi et al. (2003) Bernardi M. et al., 2003, AJ, 125, 1866
- Bolton et al. (2008) Bolton A. S., Treu T., Koopmans L. V. E., Gavazzi R., Moustakas L. A., Burles S., Schlegel D. J., Wayth R., 2008, ApJ, 684, 248
- Bower et al. (1992) Bower R. G., Lucey J. R., Ellis R., 1992, MNRAS, 254, 589
- Burstein et al. (1988) Burstein D., Bertola F., Buson L. M., Faber S. M., Lauer T. R., 1988, ApJ, 328, 440
- Cairós et al. (2001) Cairós L. M., Caon N., Vílchez J. M., González-Pérez J. N., Muño-Tuñón C., 2001, ApJS, 136, 393
- Cardelli et al. (1989) Cardelli J. A., Clayton G. C., Mathis J. S., 1989, ApJ, 345, 245
- Paper IV (2006) Cappellari M. et al., 2006, MNRAS, 366, 1126 [Paper IV]
- Paper X (2007) Cappellari M. et al., 2007, MNRAS, 379, 418 [Paper X]
- Ciotti & Bertin (1999) Ciotti L., Bertin G., 1999, A&A, 352, 447
- Combes et al. (2007) Combes F., Young L. M., Bureau M., 2007, MNRAS, 377, 1795
- Crocker et al. (2008) Crocker A. F. et al., 2009, MNRAS, 393, 1255
- De Carvalho & Djorgovski (1992) De Carvalho R. R., Djorgovski S. G., 1992, ApJL, 389, L49
- Djorgovski & Davis (1987) Djorgovski S., Davis M., 1987, ApJ, 313, 59
- Dressler et al. (1987) Dressler A., Lynden-Bell D., Burstein D., Davies R. L., Faber S. M., Terlevich R. J., Vegner G., 1987, ApJ, 313, 42
- Paper II (2002) de Zeeuw P. T. et al., 2002, MNRAS, 329, 513 [Paper II]
- de Zeeuw & Franx (1991) de Zeeuw P. T., Franx M., 1991, ARA&A, 29, 239
- Donas et al. (2007) Donas J. et al., 2007, ApJS, 173, 597
- D’Onofrio et al. (2006) D’Onofrio M., Valentinuzzi T., Secco L., Caimmi R., Bindoni D., 2006, NewA Rev., 50, 447
- Eggen et al. (1962) Eggen O. J., Lynden-Bell D., Sandage A. R., 1962, ApJ, 136, 748
- Ellis et al. (1997) Ellis R. S. et al., 1997, ApJ, 483, 582
- Paper III (2004) Emsellem E. et al., 2004, MNRAS, 352, 721 [Paper III]
- Paper IX (2007) Emsellem E. et al., 2007, MNRAS, 379, 401 [Paper IX]
- Faber & Jackson (1976) Faber S. M., Jackson R. E., 1976, ApJ, 204, 668
- Faber et al. (1989) Faber S. M., Wegner G., Burstein D., Davies R. L., Dressler A., Lynden-Bell D., Terlevich R. J., 1989, ApJS, 69, 763
- Faber et al. (1997) Faber S. M. et al., 1997, AJ, 114, 1771
- Gil de Paz et al. (2007) Gil de Paz A. et al., 2007, ApJS, 173, 185
- Guzmán et al. (1993) Guzmán R., Lucey J. R., Bower R. G., 1993, MNRAS, 265, 731
- Hau et al. (1999) Hau G. K. T., Carter D., Balcells M., 1999, MNRAS, 306, 437
- Hudeson et al. (1997) Hudson M. J., Lucey J. R., Smith R. J., Steel J., 1997, MNRAS, 291, 488
- Jedrzejewski (1987) Jedrzejewski R. I., 1987, MNRAS, 226, 747
- Jeong et al. (2007) Jeong H., Bureau M., Yi S. K., Krajnović D., Davies R. L., 2007, MNRAS, 376, 1021
- Jørgensen et al. (1996) Jørgensen I., Franx M., Kjærgaard P., 1996, MNRAS, 280, 167
- Kaviraj et al. (2007) Kaviraj S. et al., 2007, ApJS, 173, 619
- Kelson et al. (2000) Kelson D. D., Illingworth G. D., van Kokkum P. G., Franx M., 2000, ApJ, 531, 184
- Khochfar & Burkert (2005) Khochfar S., Burtert A., 2005, MNRAS, 359, 1379
- Kormendy (1977) Kormendy J., 1977, ApJ, 217, 406
- Paper XII (2008) Krajnović D. et al. 2008, MNRAS, 390, 93
- Hamabe & Kormendy (1987) Hamabe M., Kormendy J., 1987, in IAU Symposium 127, Structure and Dynamics of Elliptical Galaxies, ed. T. de Zeeuw (Dordrecht: Reidel), 379
- Kormendy & Bender (1996) Kormendy J., Bender R., 1996, ApJ, 464, L119
- Paper VI (2006) Kuntschner H. et al., 2006, MNRAS, 369, 497 [Paper VI]
- Larson (1974) Larson R. B., 1974, MNRAS, 166, 385
- Martin et al. (2005) Martin D. C. et al., 2005, ApJ, 619, L1
- Paper VIII (2006) McDermid R. M. et al., 2006, MNRAS, 373, 906 [Paper VIII]
- Morganti et al. (2006) Morganti R. et al., 2006, MNRAS, 371, 157
- Morrissey et al. (2005) Morrissey P. et al., 2005, ApJ, 619, L7
- Morrissey et al. (2007) Morrissey P. et al., 2007, ApJS, 173, 682
- Nolan et al. (2007) Nolan L. A., Dunlop J. S., Panter B., Jimenez R., Heavens A., Smith G., 2007, MNRAS, 375, 371
- O’Connell (1999) O’Connell R. W., 1999, ARA&A, 37, 603
- Pahre et al. (1998) Pahre M. A., Djorgovski S. G., De Carvalho R. R., 1998, AJ, 116, 1591
- Pahre et al. (1998) Pahre M. A., De Carvalho R. R., Djorgovski S. G., 1998, AJ, 116, 1606
- Prugniel & Simien (1996) Prugniel Ph., Simien F., 1996, A&A, 309, 749
- Raimann et al. (2005) Raimann D., Storchi-Bergmann T., Quintana H., Hunstead R., Wisotzki L., 2005, MNRAS, 364, 1239
- Rix et al. (1992) Rix H.-W., Franx M, Fisher D., Illingworth G., 1992, ApJ, 400, L5
- Rubin, Graham & Kenney (1992) Rubin V. C., Graham J. A., Kenney J. D. P., 1992, ApJ, 394, L9
- Paper V (2006) Sarzi M. et al., 2006, MNRAS, 366, 1151 [Paper V]
- Schawinski et al. (2006) Schawinski K. et al., 2006, Nature, 442, 888
- Schawinski et al. (2007) Schawinski K. et al., 2007a, ApJS, 173, 512
- Schlegel et al. (1998) Schlegel D. J., Finkbeiner D. P., Davis M., 1998, ApJ, 500, 525
- Schweizer & Seitzer (1992) Schweizer F., Seitzer P., 1992, AJ, 104, 1039
- Scodeggio (1997) Scodeggio M., 1997, Ph.D. thesis, Cornell Univ.
- Stanford et al. (1998) Stanford S. A., Eisenhardt P. R. M., Dickinson M., 1998, ApJ, 492, 461
- Toomre and Toomre (1972) Toomre A., Toomre J., 1972, ApJ, 178, 623
- Treu et al. (2006) Treu T., Koopmans L. V. E., Bolton A. S., Burles S., Moustakas L. A., 2006, ApJ, 640, 662
- Trujillo et al. (2004) Trujillo I., Burkert A., Bell E., 2004, ApJ 600, 39
- Turnbull, Bridges & Carter (1999) Turnbull A. J., Bridges T. J., Carter D., 1999, MNRAS, 307, 967
- van den Bosch & Emsellem (1998) van den Bosch F. C., Emsellem E., 1998, MNRAS, 298, 267
- van Dokkum et al. (2000) van Dokkum P. G., Franx M., Fabricant D., Illingworth G. D., Kelson D. D., 2000, ApJ, 541, 95
- Welch & Sage (2003) Welch G. A., Sage L. J., 2003, ApJ, 584, 260
- Wernli, Emsellem & Copin (2002) Wernli F., Emsellem E., Copin Y., 2002, A&A, 396, 73
- Worthey (1994) Worthey G., 1994, ApJS, 95, 107
- Wyder et al. (2005) Wyder T. K. et al., 2005, ApJL, 619, L15
- Yi et al. (1997) Yi S., Demarque P., Oemler A. J., 1997, ApJ, 486, 201
- Yi et al. (2005) Yi S. K. et al., 2005, ApJL, 619, L111
- Young et al. (2008) Young L. M., Bureau M., Cappellari M., 2008, ApJ, 676, 317
- Young et al. (2009) Young L. M., Bendo G. J., Lucero D. M., 2009, AJ, 137, 3053
- Zepf & Whitmore (1993) Zepf S. E., Whitmore B. C., 1993, ApJ, 418, 72
Appendix A Description for individual galaxies
We briefly comment here on the GALEX and MDM surface brightness profiles of the E/S0 galaxies presented in this paper. Individual comments on the stellar kinematics, the emission-line maps and the line strength structures are given in Paper III, Paper V and Paper VI, respectively.
- NGC 474:
-
This galaxy (Arp 227), noted for its shell structures (e.g. Turnbull, Bridges & Carter, 1999), shows blue NUV colours except in the central regions. The H absorption line strength rises toward larger radii (Paper VI). Considering the UV colours, it seems that young stellar populations are present in the outer parts.
- NGC 524:
-
This galaxy shows red colours in both the FUV and the NUV colour profile, making a good example of a quiescent elliptical galaxy.
- NGC 821:
-
This edge-on galaxy with a rapidly rotating disc-like component (Paper III) shows red FUVNUV and UV colours except outside the effective radius.
- NGC 1023:
-
This SB0 galaxy shows a tilt in the FUV and NUV surface brightness profiles around arcsec, a central concentration in all metal lines (Paper VI) and significantly negative values of both and (Paper III). We discovered a strong NUV blob, constituting strong evidence for recent/ongoing star formation, just outside the galaxy. This is likely the result of a tidal interaction between NGC 1023 and a neighboring gas-rich galaxy (see Morganti et al., 2006).
- NGC 2695:
-
This galaxy shows blue FUVNUV colours in the central regions with a high amplitude in . The UV colours become bluer toward larger radii, albeit with large uncertainties. We thus consider this a red galaxy.
- NGC 2699:
-
The mean velocity map of this galaxy shows a rapidly rotating component around arcsec (Paper III). Similar to NGC 2695, it shows moderately blue NUV colours only in the outer parts.
- NGC 2768:
-
This galaxy with a cylindrical velocity field shows red colours in the UV colour profiles.
- NGC 2974:
- NGC 3032:
-
Blue UV colours are observed everywhere, suggesting a strong ongoing starburst. This galaxy also shows strong H absorption with negative Mg and Fe5270s line strength gradients (Paper VI).
- NGC 4150:
- NGC 4278:
-
This galaxy shows blue FUVNUV colours within arcsec, suggesting a strong FUV flux. It also has the strongest line emission (Paper V).
- NGC 4374 (M84):
-
This giant elliptical galaxy shows a similar FUVNUV colour trend as that in NGC 4278. It is known for its BL Lac nucleus and shows strong ionised-gas emission (Paper V).
- NGC 4387:
-
This boxy galaxy shows red UV colours.
- NGC 4458:
-
The FUV image of this galaxy exhibits an indistinct shape except for the central regions. This faint disc-like object also has a small central kinematically-decoupled core (Paper III).
- NGC 4459:
-
This galaxy with a central dust ring (Paper V) shows blue UV colours within arcsec, coincident with an intense H absorption line strength and molecular gas.
- NGC 4473:
-
This galaxy with a high velocity dispersion along the major axis likely resulting from substantial counter-rotation (Paper III) shows extended UV emission in the outskirts.
- NGC 4477:
-
This galaxy with a prominent misalignment between the stellar kinematic and photometric major axes (Paper III shows overall red UV colours.
- NGC 4486 (M87):
-
This galaxy with a prominent jet shows blue UV colours in the central regions, almost certainly related to nuclear activity. The jet also induces large errors in the surface brightness profiles.
- NGC 4526:
- NGC 4546:
-
This galaxy shows moderately blue NUV colours in the outer parts. These could be related to the likely presence of a bar and associated star formation.
- NGC 4550:
- NGC 4552 (M89):
-
This famous UV-upturn galaxy shows very blue FUVNUV colours in the centre.
- NGC 4564:
-
This elongated galaxy with a disc-like component (Paper III) shows blue FUVNUV colours within the inner arcsec.
- NGC 4570:
-
This fast-rotating edge-on galaxy shows slightly blue UV colours in the outer parts. The presence of a bar was claimed by van den Bosch & Emsellem (1998).
- NGC 4621:
- NGC 5198:
-
This galaxy with a central kinematically-decoupled core shows blue FUVNUV colours in the centre that may indicate the presence of a UV upturn.
- NGC 5308:
-
This edge-on disc galaxy shows red UV colours.
- NGC 5813:
-
This galaxy with a well-known kinematically decoupled core shows marginally blue NUV colours in the outer parts.
- NGC 5831:
-
Like NGC 5813, this galaxy with a kinematically-decoupled core shows blue NUV colours in the outer regions. There is a small bump in both FUV and NUV surface brightness profiles around arcsec.
- NGC 5838:
-
This fast-rotating object shows red NUV colours throughout.
- NGC 5845:
-
This compact elliptical galaxy shows a small bump in the NUV profile at a radius of arcsec, with a corresponding distinct peak in the velocity map related to the central disk.
- NGC 5846:
-
Similar to NGC 4552 and NGC 4564, this bright giant elliptical galaxy shows blue FUVNUV colours in the centre that are suspected to be a UV upturn, with marginally blue NUV colours.
- NGC 5982:
-
This galaxy with a kinematically-decoupled core shows blue FUVNUV colours in the centre.
- NGC 7457:
-
This kinematically-decoupled-core galaxy shows blue NUV colours throughout, suggesting recent star formation. The H absorption is also high everywhere (Paper VI).