The Jets and Disc of SS 433 at Super-Eddington Luminosities
Abstract
We examine the jets and the disc of SS 433 at super-Eddington luminosities with by time-dependent two-dimensional radiation hydrodynamical calculations, assuming -model for the viscosity. One-dimensional supercritical accretion disc models with mass loss or advection are used as the initial configurations of the disc. As a result, from the initial advective disc models with =0.001 and 0.1, we obtain the total luminosities and erg s-1. The total mass-outflow rates are and yr-1 and the rates of the relativistic axial outflows in a small half opening angle of are about yr-1: the values generally consistent with the corresponding observed rates of the wind and the jets, respectively. From the initial models with mass loss but without advection, we obtain the total mass-outflow and axial outflow rates smaller than or comparable to the observed rates of the wind and the jets respectively, depending on . In the advective disc model with , the initially radiation-pressure dominant, optically thick disc evolves to the gas-pressure dominated, optically thin state in the inner region of the disc, and the inner disc is unstable. Consequently, we find remarkable modulations of the disc luminosity and the accretion rate through the inner edge. These modulations manifest themselves as the recurrent hot blobs with high temperatures and low densities at the disc plane, which develop outward and upward and produce the QPOs-like variability of the total luminosity with an amplitude of a factor of 2 and quasi-periods of 10 – 25 s. This may explain the massive jet ejection and the QPOs phenomena observed in SS 433.
keywords:
accretion, accretion discs – black hole physics – hydrodynamics – radiation mechanism: thermal– X-rays:individual: SS 433.1 Introduction
Disc accretion is an essential process for such phenomena as energetic X-ray sources, active galactic nuclei, and protostars. Since the early works by Pringle & Rees (1972) and Shakura & Sunyaev (1973), a great number of papers have been devoted to studies of the disc accretion onto gravitating objects. When the accretion rate is not too high, the accretion disc luminosity is directly in proportion to the accretion rate and can be successfully described by the Shakura-Sunyaev (S-S) model. However, for the supercritical accretion rate, matter flows out of the disc, and the rate of accretion onto the central black hole is reduced, regulating the luminosity to the Eddington limit. The galactic microquasar SS 433 is a promising super-critically accreting sterllar-mass black hole candidate and has stimulated numerous studies, because it displays remarkable observational features, such as its extremely high energy, two oppositely directed relativistic jets, and the precessing motion of the jets. Although a number of observational and theoretical studies on SS 433 have been published (for detailed reviews see Margon 1984; Fabrika 2004), there are still many problems of the jets and the disc to be solved. The super-Eddington accretion discs are generally expected to possess vortex funnels and radiation-pressure driven jets from geometrically thick discs (Shakura & Sunyaev, 1973; Lynden-Bell, 1978; Fukue, 1982; Calvani & Nobili, 1983). Such supercritical disc models have been numerically examined by two-dimensional radiation hydrodynamical calculations (Eggum, Coroniti & Katz, 1985, 1988; Okuda, 2002; Okuda et al., 2005; Ohsuga et al., 2005; Ohsuga, 2007; Ohsuga & Mineshige, 2007), especially focussing on the puzzling X-ray source SS 433 (Eggum, Coroniti & Katz, 1985, 1988; Okuda, 2002; Okuda et al., 2005). However, these works leave something to be desired as far as SS 433 is concerned, because the accretion rates adopted in these studies are very small, compared with those estimated for SS 433. In this paper, we examine the properties of the jets and the disc of SS 433 with the plausible supercritical accretion rate. We perform time-dependent two-dimensional radiation hydrodynamical calculations, using 1D models of the supercritical accretion disc models with mass loss or advection (Lipunova, 1999) as initial disc configurations.
| ( | ||||||||
| ML-1 | ||||||||
| ML-2 | 0.1 | |||||||
| AD-1 | ||||||||
| AD-2 | 0.1 | |||||||
| Observation | – | – | – | – | – | – | – | – |
2 Supercritical accretion disc models with mass loss and advection
Our previous studies of SS 433 (Okuda, 2002; Okuda et al., 2005) are based on the initial discs by S-S model with . Here, is the input accretion rate normalized to the Eddington critical accretion rate , where is the Eddington luminosity, the gravitational constant, the black hole mass, the Thomoson scattering opacity, the velocity of light, and the conversion efficiency of the energy of the accreting matter into radiation. Adopting , we have g s-1 and erg s-1 for . In this paper we consider , which corresponds to and is a more plausible value for SS 433 (Fabrika, 2004). The S-S disc with such a high accretion rate is geometrically too thick and becomes invalid against assumptions used. When the accretion rate is very high, the disc luminosity exceeds the Eddington luminosity and matter flows out of the disc surface, causing the accretion rate onto the central object to decrease. The outflow takes place inside the radius at which the disc thickness becomes comparable to the disc radius. This radius is called a spherization radius (Shakura & Sunyaev, 1973). Lipunova (1999) proposed supercritical disc models, taking account of mass loss and advection through the accretion discs, which were applied to SS 433 and the ultraluminous X-ray sources (ULXs) by Poutanen et al. (2007). In their models with mass loss, it is assumed that a fraction of the radiation energy flux is spent on the production of the outflow within the spherization radius. For , if advection is neglected, we obtain analytical solutions (Lipunova, 1999) for the disc variables at the disc plane, and the ratio is estimated to be , where is the Schwarzschild radius. The accretion rate in the disc within the spherization radius is given by
| (1) |
This law has the asymptotic form
| (2) |
The temperature and the density in the central plane of the disc are approximately given in the region of by
| (3) |
| (4) |
where is the viscosity parameter.
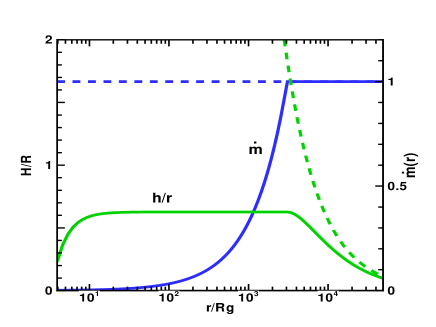
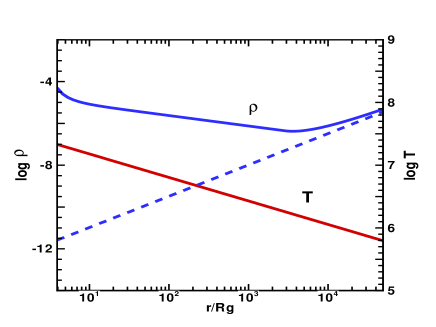
Figs 1 and 2 show the accretion rate , the relative disc thickness , the central plane temperature , and the density for the 1D model with mass loss and the viscosity parameter , along with the solution for S-S model without mass loss. Outside the spherization radius the solutions are identical.
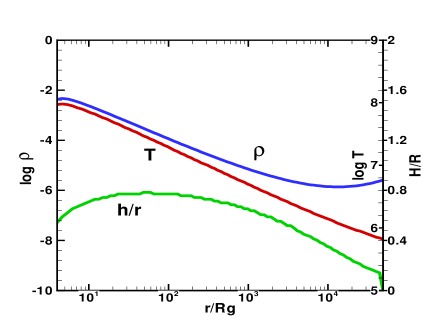
The disc at the supercritical accretion rates becomes geometrically thick. The emission from the surface of a thick disc is not an efficient cooling mechanism, and the advective transport of the viscously generated heat becomes important in the energy balance equation (Paczyński & Bisnovatyi-Kogan, 1981). An advection-dominated disc model at moderately super-Eddington accretion rates was first proposed by Abramowicz et al. (1988). A supercritical disc with even higher accretion rates was approached by Lipunova (1999), where mass loss and advection were included, and the discs were geometrically thick ( at maximum) but not so thick as it followed from S-S model (). Fig. 3 shows a solution for the advective supercritical disc with mass loss for and . This solution and the analytic solution for the disc with mass loss, described above, are used in the current work as initial configurations of the disc in the 2D numerical model.
3 Numerical Methods
A set of relevant equations for the numerical calculation consists of six partial differential equations for the density, the momentum, and the thermal and radiation energy. These equations include the full viscous stress tensor, the heating and cooling of the gas, and the radiation transport. The pseudo-Newtonian potential (Paczyński & Wiita, 1980) is adopted in the momentum equation. The radiation transport is treated in the gray, flux-limited diffusion approximation (Levermore & Pomraning, 1981). We use spherical polar coordinates (,,), where is the radial distance, is the angular distance measured from the equatorial plane of the disc, and is the azimuthal angle. The above set of differential equations is numerically integrated in time using a finite-difference method, which is an improved version of that described in Kley (1989). The method is based on an explicit-implicit finite difference scheme, whose details are described by Okuda, Fujita & Sakashita (1997) and Okuda et al. (2005). The computational domain is divided into grid cells, where grid points (=100) in the radial direction are spaced logarithmically as and grid points (=150) in the angular direction are equally spaced, but more refined near the equatorial plane, typically with for and for , in order to resolve the structure of the accretion disc. Although the radial mesh-sizes do not have a fine resolution to examine detailed disc structure, we consider the mesh-sizes to be sufficient for examination of the global behavior of the disc, the jets, and the wind mass-outflow rates.
3.1 Model Parameters
We consider a Schwarzschild black hole with mass and take the inner-boundary radius and the outer boundary radius of the spherical computational domain cm). For the kinematic viscosity, we adopt the usual - model. In Table 1, we give the parameters of the discs with mass loss (ML) and advection (AD), where is the input accretion rate, and is the viscosity parameter. Starting with 1D solutions described in section 2, we perform time integration of the equations until a quasi-steady solution is obtained.
3.2 Initial Conditions
The initial conditions consist of a dense, optically thick accretion disc and a rarefied optically thin atmosphere around the disc. Physical variables and at the equatorial plane for are given by the 1D solutions for the supercritical discs with mass loss or advection. We construct the vertical structure of the disc in the approximation of the hydrostatic and radiative equilibrium by integrating the relevant equations with given boundary values at the equatorial plane. As for the initial atmosphere around the disc, assuming that the gas is in the optically thin limit and in the radially hydrostatic equilibrium, we have
| (5) |
| (6) |
where is the radial component of the radiative flux , the radiation energy density, the flux-limiter, the electron-scattering opacity, and the total pressure. Furthermore, if it is assumed that the flux-limiter is constant and that the radiation pressure is dominant throughout the gas, we have for the initial radiation energy density and the density , from the above equations,
| (7) |
| (8) |
Actually, the flux-limiter is taken to be . However, we note that a particular initial distribution of the gas around the disc does not influence the results at the sufficiently late simulation times.
3.3 Boundary Conditions
Physical variables at the inner boundary, except for the velocities, are calculated by extrapolation of the variables near the boundary. We impose limiting conditions that the radial velocities at the inner boundary are given by a fixed free-fall velocity and the angular velocities are zero. On the rotational axis and the equatorial plane, the meridional tangential velocity is zero and all scalar variables must be symmetric relative to the axis and the plane. The outer boundary at is divided into two parts. One is the disc boundary through which matter is entering from the outer disc. At this outer-disc boundary we assume a continuous inflow of matter with a constant accretion rate . The other part is the outer boundary region above the accretion disc. We impose free-floating conditions on this outer boundary and allow for outflow of matter, whereas any inflow is prohibited here. We also assume the outer boundary region above the disc to be in the optically-thin limit, .
4 Numerical Results
In order to obtain a reliable configuration of the jet, the simulation time should be longer than the jet arrival time at the outer boundary. On the other hand, to get a steady state of a viscous disc in a region of radius , we need the simulation time longer than the characteristic dynamical time and the viscous time-scale . These times are given as follows:
| (9) |
| (10) |
and
| (11) |
where and are the Keplerian angular velocity and the typical jet velocity. For the supercritical disc of SS 433, we have and . Large-scale mass loss sets in near the spherization radius of the disc at . For this radius and , the maximum time of , , and is . We set this time as an approximate computational goal, exceeding it in the cases of models ML-2 and AD-2 in order to examine the disc instability. Whereas the quasi-steady values of the luminosities are almost attained at the final phases, the simulation times are still not sufficient for the disc and the outflow to settle into a completely steady state, because the input accretion rate is not equal to the total mass-outflow rate plus the mass-flux rate of the falling gas into the black hole. In spite of the limited computational time, we are able to derive the general properties of the disc and the outflow.
The luminosity curve is a good measure to check if a steady state of the disk and the outflow is attained. The total luminosity and the disc luminosity are calculated as , where the surface integral is taken over the outer boundary surface and the disc surface, respectively. The disc surface is placed at the height where the density drops to a tenth part of the value at the equatorial plane. This lead to some uncertainty in because the vertical structure of a geometrically thick disc is treated rather approximately.
To compare with the observational data for SS 433, we calculte the total mass-outflow rate and the “axial outflow” rate . The value is calculated for the entire outer-boundary surface and corresponds to the observed mass-outflow in the wind of SS 433. Observations indicate that the opening angle of the X-ray and optical jets is (Marshall, Canizares & Schulz, 2002; Fabrika, 2004). Throughout the paper, we call the relativistic outflow through the outer base of the cone directed along the rotational axis with the half opening angle of “the axial outflow”. The mass-flux rate of the axial outflow should correspond to the mass-outflow rate in the jets of SS 433, provided the size of the present computational domain is comparable to the distance of the observed jets from the central source. In order to check the total mass-flux rate, we also calculate the mass-flux rate of the gas falling through the inner boundary into the black hole.
In Table 1 we give , , , , and at the final simulation time for each of the models. Values , , and show QPOs-like features in model AD-2; Table 1 shows their averaged values around the final phase. In the columns for and , one can see the observational mass-outflow rate in the wind and the jets of SS 433 (Dopita & Cherepashchuk, 1981; van den Heuvel, 1981; Kotani, 1998; Marshall, Canizares & Schulz, 2002; Cherepashchuk et al., 2003; Fabrika, 2004).
4.1 Cases of ML-1 and ML-2 with mass loss
In the model ML-1, the initial disc is radiation-pressure dominant and optically thick. The perturbed density and temperature waves are generated initially near the inner edge, and then heating and cooling waves move up and down between the inner edge and the radius of , raising the disc temperature to K. As a result, the gas-pressure dominat, optically thin region is formed in the innermost region. The process is repeated for a while, then stops after . Finally, we get stable, optically thick, and radiation-pressure dominant disc. The resultant disc temperatures at the equatorial plane are not different significantly from the initial temperatures of the disc, while the densities are enhanced by a factor of 10 – 30 in the region of . The final luminosities and erg s-1 are one order of magnitude larger than the Eddington luminosity. The total mass-outflow rate is less by an order than the mass-outflow rate of the wind observed in SS 433, and the rate of the axial outflow is marginally in the range of the observed mass-outflow rate of the jets.
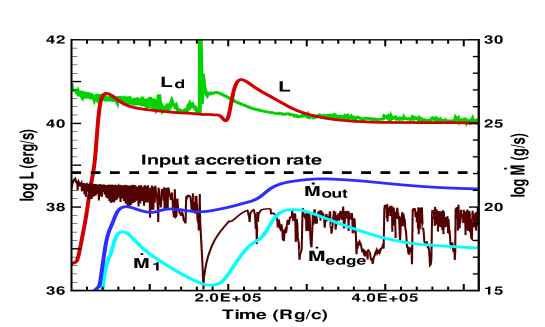
Fig. 4 shows the time evolutions of , , , , and for model ML-2 with the viscosity parameter =0.1. The total luminosity becomes comparable to the disc luminosity at the time , which is the photon transit time from the inner edge to the outer boundary. The total luminosity erg s-1 obtained finally is greater by a factor of 6 than the Eddington luminosity.
The initial disc of ML-2 is radiation-pressure dominant and optically thick throughout the whole disc region. In the same way as in the case of ML-1, the perturbations of density and temperature, generated initially near the inner edge, propagate outward and inward as heating and cooling waves, and the high temperature, gas-pressure dominant, optically thin region is formed in the inner disc. The instability in the optically thin region is never damped, as indicated by in Fig. 4, and appears as an oscillating hot blob with a variable size of 10 – 100 at the equatorial plane. After a large-scale hot blob at , the instability persists but the absolute variation amplitude of becomes smaller. In spite of the considerable variability of , the modulations of and are weak, except for the phase of the large-scale blob, and become negligible at the later phase. At the final phase, the first outward heating wave reaches the spherization radius and merges into the outer Shakura-Sunyaev disc, and the whole disc tends to settle gradually into a steady state. Eventually, the disc evolves into two zones: the gas-pressure dominant and optically thin inner disc and the radiation-pressure dominant and optically thick outer disc.
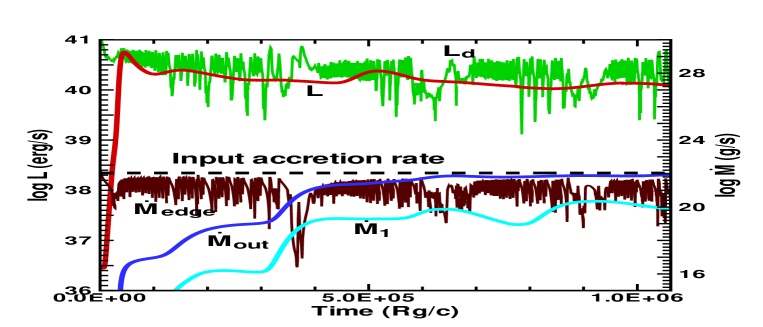
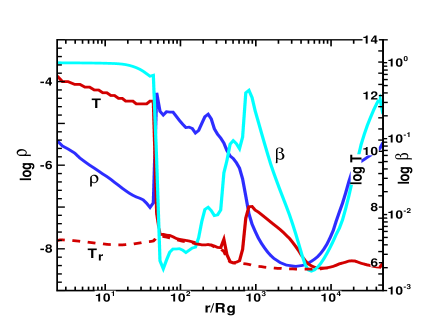
Fig. 5 shows the radial profiles of density (g ), gas temperature (K), radiation temperature (K), and ratio of the gas pressure to the total pressure on the equatorial plane at for model ML-2. The radiation temperature is defined as , where is the radiation density constant. When the gas is fully optically thick, the gas temperature should be equal to the radiation temperature . When the gas becomes optically thin, is much lower than as it is found in Fig. 5. Initially, the radiation temperature and the gas temperature are K near the inner edge of the optically thick disc. However, after some time, the gas temperature near the inner edge goes up to – K and is variable by a factor of 10. Similarly, the radiation temperature is also modulated between – K in the region of . The gas-pressure dominant, hot, optically thin inner disc is separated from the radiation-pressure dominant outer disc by the transition region at . The gas variables and vary sharply across the transition region, but the radiation temperature is smooth everywhere.
Figs 6 and 7 show the contours of density (g cm-3 ) and temperature (K) with the velocity vectors of the gas near the spherization radius at for model ML-2. Here we see a rarefied, hot, and optically thin high-velocity outflow region and a dense, cold, and geometrically thick disc. The outflow propagates with relativistic velocities of 0.08 – 0.2 along the Z-axis. The disc is geometrically thick with 0.7 – 1 in the region of and the large-scale outflow sets in the region. In the high-velocity region along the rotational axis, the temperature is as high as K and the density is as low as – 1 g cm-3.
4.2 Cases of AD-1 and AD-2 with advection
Fig. 8 shows the time evolutions of , , , , and for model AD-1. The evolutionary features of the disc is very similar to the case of ML-1. Finally, we get stable, optically thick, and radiation-pressure dominant disc with the maximum disc temperature K in the innermost region. The total luminosities and erg s-1 in models AD-1 and AD-2 are in the same range as those in models ML-1 and ML-2. The total mass-outflow rates are and yr-1 and the rates of the relativistic axial outflow are and yr-1 in models AD-1 and AD-2 respectively. These values of and are consistent with the corresponding observed rates of the wind and the jets.
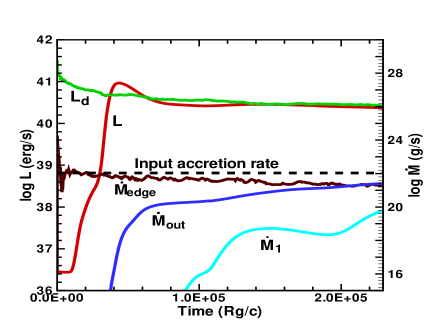
Fig. 9 shows the time evolutions of , , , , and for model AD-2. In this case, we find the remarkable variabilities of , , and and, to examine their properties, we took a long simulation time ( 100 s). The high-velocity jets propagate vertically to the disc plane and expand gradually from the rotational axis with increasing time. After the time , the jets arrive at the outer boundary in the polar direction, and the mass outflow begins and gradually approaches the steady state. In model AD-2, most of the accreting matter is flown out as wind and only 10 percent of the input matter is swallowed into the black hole.
The modulations of in AD-2 show two types of variability: (1) the small amplitude variations with a short time-scale, (2) the large amplitude variations with a long time-scale. The disc luminosity is also modulated by a factor of a few to ten, synchronously with . The variations with the small amplitude and short periods strongly influence the disc luminosity but not the total luminosity measured at the distant outer boundary. If the atmosphere between the disc surface and the outer boundary was fully optically thin, the total luminosity would suffer from the same modulations as the disc luminosity. However, in the supercritical accretion flow with high input density, only the large modulations with the long periods contribute to the total luminosity, due to the atmospheric absorption around the disc. These modulations behave as QPOs-like variabilities. In Fig. 10, we plot the power density spectra of , , and and recognize the QPOs-like features of these spectra with characteristic signals of – and 0.5 – 2 Hz for and . Only longer-period variations are obtained for ; therefore, we expect modulations of the observed luminosity with the quasi-periods between 10 and 25 s.
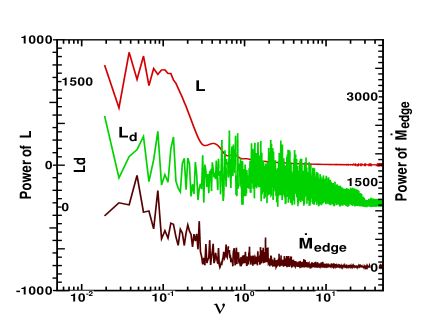
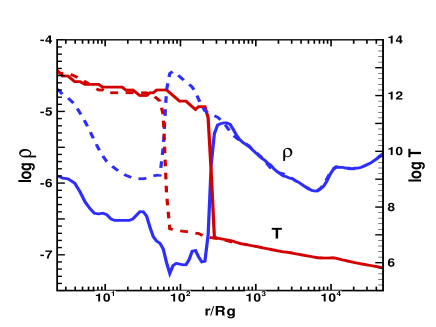
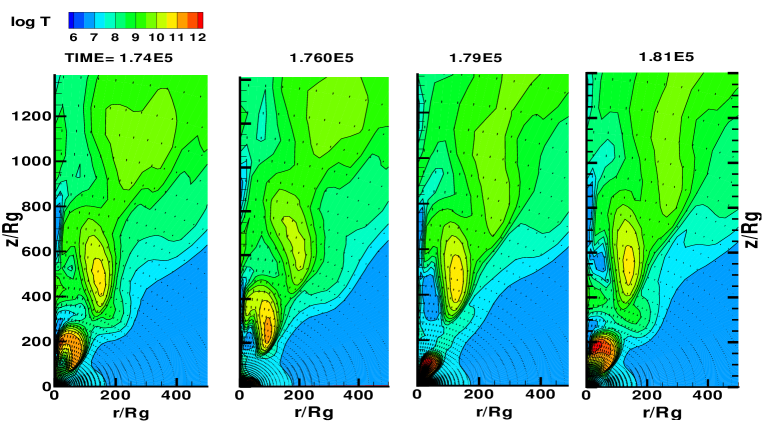
Fig. 11 shows the radial profiles of density (g ) and temperature (K) at the equatorial plane for (dashed lines) and (solid lines) for model AD-2. Similarly to the case of model ML-2, the disc obtained in model AD-2 consists of three regions: (1) the gas-pressure dominant, optically thin disc in the inner region, (2) the advection-dominated, radiation-pressure dominant, optically thick disc in the intermediate region, (3) the outer radiation-pressure dominant, optically thick Shakura-Sunyaev disc at . The regions (1) and (2) are sharply separated by the critical radius . The critical radius moves randomly up and down, and usually reaches with a heating wave, advancing sometimes to 100 – 200 and rarely to the maximum radius , then recedes to the inner edge with a cooling wave. These instabilities in the inner disc lead to recurrent hot blobs with high temperatures and low densities, like bubbles in the boilling water. The hot blobs typically grow to the size of in the disc plane, go up with increasing size, and finally decay at . The time evolution of the hot blobs is shown in Fig. 12.
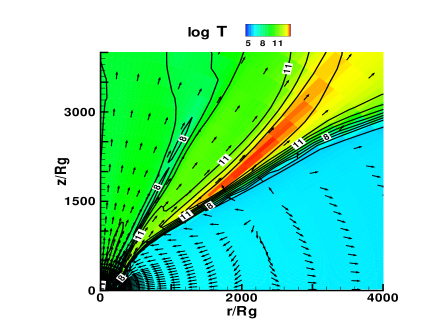
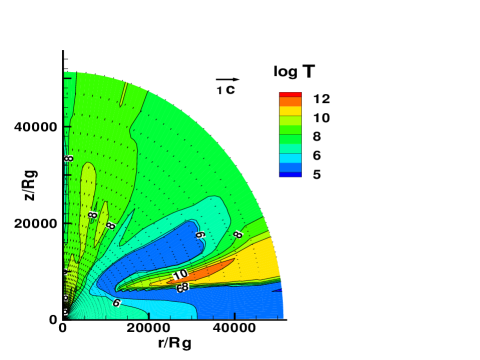
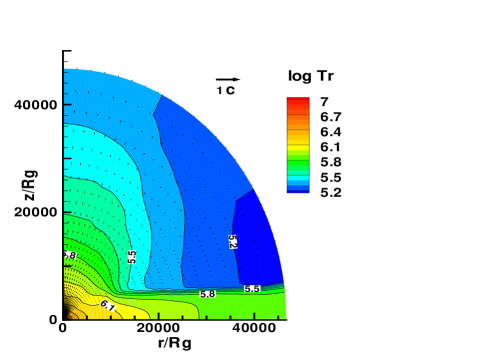
Figs 13 and 14 show the contours of gas temperature (K) and radiation temperature (K) with velocity vectors in the whole computational domain at for model AD-2. The gas temperature in the high-velocity jets region is as high as K at cm and because the jet region is mildly optically thin, but in the outer optically thick disc. From Fig. 14, we find that the contours of , as well as the contours of radiation energy density , show an anisotropic distribution of radial component of the radiative flux , where . Actually, the radial components in the direction of exceed those in the direction of by a factor of 5 – 7.
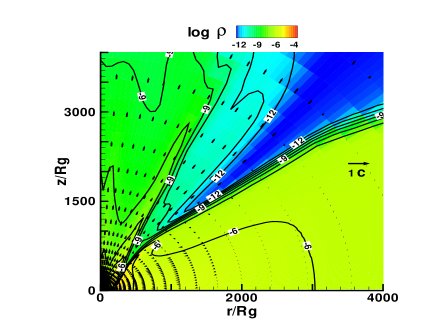
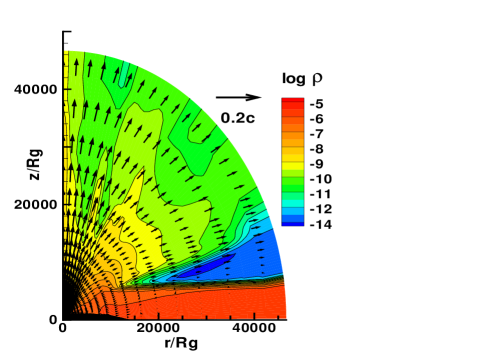
Fig. 15 shows the contours of density with magnified velocity vectors over the whole computational domain, where the velocity vector of 0.2 is denoted in the legend. From detailed analyses of the density contours and the velocity vectors, we recognize three characteristic outflows originating in the different regions of the disc shown in Fig.11: (1) the most relativistic axial outflow with velocities 0.1 – 0.3 ejected perpendicularly to the innermost hot, optically thin disc, (2) the high-velocity (0.1 – 0.05) outflow within a half opening angle ejected from the advection-dominated, optically thick disk in the intermediate region, (3) the slow outflow with velocities flowing from the disc region near the spherization radius. The slow outflow (3) from the outer disc, interacting with the high-velocity outflow (2), is blown obliquely beneath the high-velocity flow and is accelerated up to the velocities of 0.002 – 0.05 for at the outer boundary. The present result for the supercritical disc with shows a broader opening angle of the entire outflow from the disc, comparing with in the previous study with (Okuda et al., 2005). This is due to the reason that the supercritical disc with a very high accretion rate has a very large spherization radius, where a massive outflow (3) is going out distortedly from the disc.
5 Instability of advection-dominated disc
The initial discs in all cases considered here are radiation-pressure dominant and optically thick throughout the whole disc region. Therefore, their stability may be supposedly interpreted in terms of the slim disc model at highly super-Eddington luminosity; that is, these discs should be stable against the local and global perturbations. Actually, the time evolution of the disc in models ML-1 and AD-1 with small eventually shows stable features. On the other hand, just at the beginning of the simulations in ML-2 and AD-2, the unstable behaviors of the accretion rate at the inner edge and the disc luminosity are revealed. This can be attributed to the fact that the gas-pressure dominant, optically thin, high temperature state is triggered in the innermost region of the disc due to initial perturbations of the disc variables. The optically thin disc region, as that developing repeatedly in model AD-2, is not attained finally in models ML-1 and AD-1, because the disc densities in these models are much higher than those in ML-2 and AD-2 due to in the initial disc.
The thermal instability of advection-dominated one-temperature discs was examined by Kato, Abramowicz & Chen (1996). It was shown that, in the case of - viscosity, the optically thin advective disc is unstable against local perturbations if the viscosity parameter is small, but that two-dimensional analysis is necessary to investigate stability if is large. The stability of an optically thin, advection-dominated accretion disc with large was examined by 1D time-dependent numerical simulations (Manmoto et al., 1996), and it was found that any disturbance added onto the accretion flow at large radii does not decay rapidly and continue to be present as fluctuations in the X-ray emission of an accretion disc, though the global disc structure is not modified. From the present simulations, we find that the inner, optically thin, gas-pressutre dominant disc in model AD-2 becomes unstable eventually; the disc luminosity fluctuates, though the total luminosity at the outer boundary does not vary significantly. Thus, our two-dimensional calculations of the advection-dominated discs confirm the above theoretical and 1D numerical results. On the other hand, for model ML-2 with large , we find that , , and are modulated by a factor of 3 – 10 in the innermost region of the optically thin disc, that is, the disc is locally unstable. However, no significant modulation of the disc luminosity is found especially at the later phases. This is attributed to the fact that, in model ML-2, the absolute value of the local accretion rate in the inner region and its variation amplitude are small compared with the input accretion rate. Therefore, the modulations do not influence the luminosities of and , because the resultant gravitational energy release due to the accreting gas could not contribute largely to the total radiation.
6 Comparison with SS 433
SS 433 is a typical stellar-mass black-hole candidate with a highly super-Eddington luminosity. The present results can be compared with the observations of SS 433, because the model input accretion rate ( is in the observed range of SS 433 mass transfer rate (Fabrika, 2004).
The unique jet velocity (=0.26 ) of SS 433 is explained in terms of the relativistic velocity of plasma accelerated by the radiation-pressure force in the inner disc. The X-ray spectral lines from the gas moving with relativistic velocities are emitted in the very hot, optically thin region along the rotational axis. The temperature – K and the density – g cm-3 obtained in the present simulations at distances cm cm in the conical axial outflow are generally consistent with the values – K and – g cm-3, obtained by fitting the model of X-ray jet emission lines produced at distances up to cm from the jet base (Marshall, Canizares & Schulz, 2002).
In models AD-1 and AD-2, we obtain the total mass-outflow rates ( and yr-1) and the axial mass-outflow rates ( and yr-1) comparable with the observed wind ( – yr-1) and jet ( – yr-1) mass-ouflow rates, respectively. On the other hand, the mass-outflow rate in ML-1 and the axial outflow rate in ML-2 are by more than an order of magnitude lower compared with the corresponding observed values of the wind and jets, respectively.
The observed half opening angle of SS 433 jets is found to be very small, about , in the distant region of – cm for the X-ray jets (Marshall, Canizares & Schulz, 2002) and – cm for optical jets (Fabrika, 2004). Our computational domain ( cm ) is located roughly at the base of the observed X-ray jet, and the obtained half opening angle for the high-velocity outflow with radial velocities of is rather large, . The relatively large half opening angles of high-velocity flows, – 60∘, have been also found in other numerical studies of the supercritical accretion discs (Eggum, Coroniti & Katz, 1985, 1988; Okuda, 2002; Okuda et al., 2005; Ohsuga et al., 2005; Ohsuga, 2007), and in SS 433 such large opening angles of the high-velocity flow were at odds with observations. The question in the previous studies was how to collimate the high-velocity flow to a smaller angle. In the present study, this is not a problem. Indeed, the mass-outflow rates obtained for the relativistic axial outflow in the half opening angle of are sufficiently high to explain the observed mass-outflow rate of SS 433 jets, as far as the results of AD-1 and AD-2 are considered. However, we have another question, why the relativistic axial outflow in our simulations is rather undistingishable from the broader high-velocity outflow, while X-ray and optical jets of SS 433 are so brilliantly observed as the hot relativistic streams with a small opening angle in a region far beyond the present computational domain.
We interpret the small opening angles of the jets in terms of the proposal (Marshall, Canizares & Schulz, 2002; Fabrika, 2004) that the observed expansion velocity in the transverse direction of the jets coincides with the sound velocity in the region with a temperature K (Marshall, Canizares & Schulz, 2002) and that the half opening angle observed in the distant region at cm should be equal to , where . From our hydrodynamical results, in the axial flow we have and K, which agrees very well with the idea above. We suggest that, if future observations resolve the jets deeper to the central source, the jets (high-velocity outflows) will be viewed with large opening angles, .
Studying H and He absorption lines during the precessing motion of SS 433 disc, Fabrika (2004) derives the wind velocity of SS 433 as a function of the angle from the disc plane: . This gives velocities – 2000 km s-1 (0.001 – 0.007) for , which are smaller by a factor of 2 – 6 than the radial velocities 0.002 – 0.04 at the outer boundary in our simulations. The high wind velocity 1500 km s-1 (=0.005) was suggested from analysis of HeII emission near angles 70 – 80∘ (Fabrika, 2004). However, we obtain higher outflow velocities in these directions, 0.08 – 0.1. Therefore, we have to presume some mechanism of decelerating the high-velocity flow in the distant region, such as interactions with the walls of gas cocoon surrounding the axial funnels where the jets expand.
Although the absolute luminosity of SS 433 is not directly observed, the kinematic luminosity is generally estimated to be erg s-1 (Kotani, 1998), which is consistent with 1 – 2.5 erg s-1 obtained in all cases. The absolute luminosity of SS 433 is interesting because it is the maximum luminosity among the accreting stellar-mass black holes. The compact objects in the recently observed ULXs are considered as stellar-mass black hole or intermediate mass black hole, depending on whether their luminosity far exceeds the Eddington luminosity or lies at sub-Eddington values (Mushotzky, 2004). The total luminosities obtained here are higher by a factor of 3 than that given by the estimate obtained numerically in 1D model (Lipunova, 1999) and are higher by more than an order than the Eddington luminosity erg s-1. The collimated outflows in our simulations also lead to the outgoing radiation directed along the rotational axis. Actually, from the anisotropic radiation field obtained at the outer boundary for each model, we have the radial component – erg s-1 cm-2 of the radiative flux in the cone with a half opening angle . If an observer within this cone assume the radiative flux to be isotropic over the entire surface, the apparent luminosity is – erg s-1. Thus, SS 433 can be a representative of the supercritically accreting stellar-mass black hole candidate, observed as the ULXs in nearby galaxies (King et al., 2001; Fabrika, Abolmasov & Karpov, 2006; Begelman, King & Pringle, 2006).
We should pay attention to the remarkable modulations of and in model AD-2. Their power spectra show QPOs-like signals at – and 0.5 – 2 Hz, but only the larger amplitude modulations survive as small modulations of the total luminosity with a quasi-period of 10 – 25 s, as mentioned in subsection 4.2. These instabilities develop as the recurrent hot blobs with variable size rising through the accretion disc and the polar funnel region. Such inhomogeneties could cause the luminosity modulations. Although occasional massive jet ejections, which are recognized as a clustering of flare events in radio light curves, were exhibited by Microquasars, such as SS 433 (Fiedler, 1987) and GRS 1915+105 (Foster, 1996), X-ray observations of these events in SS 433 have been hardly performed so far, because the massive jet ejections are rare, short, and aperiodic. Nevertheless, Kotani et al. (2006) reported recently a variety of new phenomena, including a QPO-like feature near 0.1 Hz, rapid time variability, @and shot-like activities, and suggested that an irregular massive jet ejection might be caused by the formation of small plasma bullets or knots in the continuously emanating flow. We propose that the observed QPO-like phenomena in SS 433 can be explained in terms of the recurrent hot blob phenomena found in model AD-2.
7 Concluding remarks
We examined the jets and the disc of SS 433 with by time-dependent two-dimensional radiation hydrodynamical calculations, assuming -model for the viscosity. The initial discs are given by 1D supercritical disc models with mass loss or advection. As the result, the total luminosities obtained are 1 – 2.5 erg s-1, which are 6 to 10 times higher than the Eddington luminosity for . From the initial models with advection, we obtain the total mass-outflow rates and yr-1, and the relativistic axial outflow rates yr-1. These outflow rates agree well with the observed mass-outflow rates of the wind and the jets in SS 433. On the other hand, from the initial models with mass loss but without advection, we obtain the total mass-outflow rates and the axial outflow rates smaller than or comparable to the observed rates of the wind and the jets respectively, depending on . Still, while the mass-flow rate of the axial outflow agrees well with the observed mass-outflow rate of SS 433 jets covering the same half opening angle , a problem is to be solved, why in the simulations the axial outflow is not distinguishable from the other high-velocity flow.
The calculated radial velocities of the high-velocity outflow at the outer boundary around the disc are larger by a factor of 2 – 6 than the observed wind velocities (Fabrika, 2004), which are given as a function of the elevation angle from the disc plane of SS 433. Thus, for the radial velocities to be consistent with the observed wind velocities, the outflow gas except the relativistic axial outflow must be decelerated in the distant region beyond the present computational domain by some mechanism, such as interaction with the inhomogeneous matter or the gas cocoon around the SS 433 disc.
The initial advective disc with large evolves to the gas-pressure dominant, optically thin state in the inner region. The inner disc generates instabilities in agreement with the previous stability analyses of the advection-dominated optically thin discs. As a result, we find remarkable modulations of the mass-inflow rate at the inner edge and the disc luminosity. The modulations of present two types of variability; (1) the small amplitude variations with short time-scales of 0.5 – 2 s, (2) the large amplitude variations with long time-scales of 10 – 25 s. Only the variability (2) survives in the total luminosity because of the atmospheric absorption around the accretion disc. The disc instability results in the recurrent hot blobs, which develop outward and upward and produce QPOs-like phenomena in the total luminosity with the quasi-periods of 10 – 25 s. The QPOs-like behavior of the luminosity and the hot blobs phenomena found here may explain the recent observations of a variety of new phenomena in SS 433, such as a QPO-like feature near 0.1 Hz, rapid time variability, and a shot-like activity ascribed to the formation of small plasma bullets.
Acknowledgments
G. V. Lipunova has been supported by the Russian Foundation for Basic Research (project 09-02-00032). G. V. Lipunova is grateful to the Offene Ganztagesschule of the Paul-Klee-Grundschule (Bonn, Germany) and Stadt Bonn for providing a possibility for her full-day scientific activity.
References
- Abramowicz et al. (1988) Abramowicz M. A., Czerny, B., Lasota, J. P., Szuszkiewicz, E., 1988, ApJ, 332, 646
- Begelman, King & Pringle (2006) Begelman M. C, King A. R., Pringle J. E., 2006, MNRAS, 370, 399
- Calvani & Nobili (1983) Calvani M., Nobili L., 1983, in Astrophysical jets, ed. A. Ferrari & A. G. Pacholczyk (Dordrecht: Reidel), 189
- Cherepashchuk et al. (2003) Cherepashchuk A. M., Sunyaev R. A., Seifina E. V., Panchenko I. E., Molkov S. V., Postnov K. A., 2003, A&A, 411, L441
- Dopita & Cherepashchuk (1981) Dopita M. A., Cherepashchuk A. M., 1981, Vistas Astron., 25, 51
- Eggum, Coroniti & Katz (1985) Eggum G. E., Coroniti F. V., Katz J. I., 1985, ApJ, 298, L41
- Eggum, Coroniti & Katz (1988) Eggum G. E., Coroniti F. V., Katz J. I., 1988, ApJ, 330, 142
- Fabrika (2004) Fabrika S., 2004, Astrophysics and Space Physics Reviews, 12, 1
- Fabrika, Abolmasov & Karpov (2006) Fabrika S., Abolmasov P., Karpov S., 2006, in Proceedings IAU Symposium No. 238, Black Holes : from Stars to Galaxies - across the Range of Masses.
- Fiedler (1987) Fiedler R. L., Johnston K. J., Spencer J. H., Waltman E. B., Florkowski D. R., Matsakis D. N., Josties F. J., Angerhofer P. E. Klepczynski W. J., McCarthy D. D., 1987, AJ, 94, 1244
- Foster (1996) Foster R. S., Waltman E. B., Tavani M., Harmon B. A., Zhang S. N., Paciesas W. S., Ghigo F. D., 1996, ApJ, 467, L81
- Fukue (1982) Fukue J., 1982, PASJ, 34, 163
- Kato, Abramowicz & Chen (1996) Kato S., Abramowicz M. A., Chen X., 1996, PASJ, 48, 67
- King et al. (2001) King A. R., Davies M. B., Ward M. J., Fabbiano G., Elvis M., 2001, ApJ, 552, L109
- Kley (1989) Kley W., 1989, A&A, 208, 98
- Kotani (1998) Kotani T., 1989, PhD. The Institute of Space and Astronautical Sciences. Japan
- Kotani et al. (2006) Kotani T., Trushkin S. A., Valiullin R., Kinugasa K., Safi-Harb S., Kawai N., Namiki M., 2006, ApJ, 637, 486
- Levermore & Pomraning (1981) Levermore C. D., Pomraning G. C., 1981, ApJ, 248, 321
- Lynden-Bell (1978) Lynden-Bell D., 1978, Phys.Scr., 17, 185
- Lipunova (1999) Lipunova G. V., 1999, Astron. Lett., 25, 508
- Manmoto et al. (1996) Manmoto T., Takeuchi M., Mineshige S., Matsumoto R., Negoro H.,, 1996, ApJ., 464, L135
- Margon (1984) Margon B., 1984, ARA&A, 22, 507
- Marshall, Canizares & Schulz (2002) Marshall H. L., Canizares C. R., Schulz N. S., 2002, ApJ, 564, 941
- Mushotzky (2004) Mushotzky R., 2004, Prog. Theor. Phys. Suppl., No.155, 27
- Ohsuga (2007) Ohsuga K., 2007, PASJ, 59, 1033
- Ohsuga & Mineshige (2007) Ohsuga K., Mineshige S., 2007, ApJ, 670, 1283
- Ohsuga et al. (2005) Ohsuga K., Mori M., Nakamoto T., Mineshige S., 2005, ApJ, 628,268
- Okuda (2002) Okuda T., 2002, PASJ, 54, 253
- Okuda, Fujita & Sakashita (1997) Okuda T., Fujita M., Sakashita S., 1997, PASJ, 49, 679
- Okuda et al. (2005) Okuda T., Teresi V., Toscano E., Molteni D., 2005, MNRAS, 357, 295
- Paczyński & Bisnovatyi-Kogan (1981) Paczyński B., Bisnovatyi-Kogan G., 1981, Acta & Astronomica, 31, 283.
- Paczyński & Wiita (1980) Paczyński B., Wiita P. J., 1980, A&A, 88, 23.
- Poutanen et al. (2007) Poutanen J., Lipunova G., Fabrika S., Butkevich A. G., Abolmasov P., 2007, MNRAS 377, 1187
- Pringle & Rees (1972) Pringle J. E., Rees M. J., 1972, A&A, 21, 1
- Shakura & Sunyaev (1973) Shakura N. I., Sunyaev R. A., 1973, A&A, 24, 337
- van den Heuvel (1981) van den Hueuvel E. P. J., 1981, Vistas Astron., 25, 95