Bayesian History Reconstruction of Complex Human Gene Clusters on a Phylogeny
2 Center for Comparative Genomics and Bioinformatics, 506B Wartik Lab, Penn State University, University Park, PA 16802, USA
3 Dept. of Biological Statistics and Comp. Biology, Cornell University, Ithaca, NY 14853, USA
)
Abstract
Clusters of genes that have evolved by repeated segmental duplication present difficult challenges throughout genomic analysis, from sequence assembly to functional analysis. Improved understanding of these clusters is of utmost importance, since they have been shown to be the source of evolutionary innovation, and have been linked to multiple diseases, including HIV and a variety of cancers. Previously, Zhang et al. (2008) developed an algorithm for reconstructing parsimonious evolutionary histories of such gene clusters, using only human genomic sequence data. In this paper, we propose a probabilistic model for the evolution of gene clusters on a phylogeny, and an MCMC algorithm for reconstruction of duplication histories from genomic sequences in multiple species. Several projects are underway to obtain high quality BAC-based assemblies of duplicated clusters in multiple species, and we anticipate that our method will be useful in analyzing these valuable new data sets.
1 Introduction
Segmental duplications cover about 5% of the human genome (Lander et al.,, 2001). When multiple segmental duplications occur at a particular genomic locus they give rise to complex gene clusters. Many important gene families linked to various diseases, including cancers, Alzheimer’s disease, and HIV, reside in such clusters. Gene duplication is often followed by functional diversification (Ohno,, 1970), and, indeed, genes overlapping segmental duplications have been shown to be enriched for positive selection (The Rhesus Macaque Genome Sequencing and Analysis Consortium,, 2007).
In this paper, we describe a probabilistic model of evolution of such gene clusters on a phylogeny, and devise a Markov-chain Monte Carlo sampling algorithm for inference of highly probable duplication histories and ancestral sequences. To demonstrate the usefulness of our approach, we apply our algorithm to simulated sequences on human-chimp-macaque phylogeny, as well as to real clusters assembled from available BAC sequencing data.
Previously, Elemento et al., (2002); Lajoie et al., (2007) studied the reconstruction of gene family histories by considering tandem duplications and inversions as the only possible events. They also assume that genes are always copied as a whole unit. Zhang et al., (2008) demonstrated that more complex models are needed to address evolution of gene clusters in the human genome.
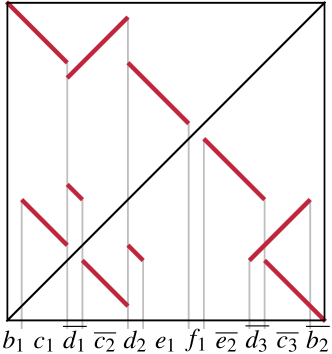
In more recent work, genes have been replaced by generic atomic segments (Zhang et al.,, 2008; Ma et al.,, 2008) as the substrates of reconstruction algorithms. Briefly, a self-alignment is constructed by a local alignment program (e.g., blastz (Schwartz et al.,, 2003)), and only alignments above certain threshold (e.g., 93% for human-macaque split) are kept. The boundaries of alignments mark breakpoints, and the sequences between neighboring breakpoints are considered atomic segments (Fig.1). Due to the transitivity of sequence similarity between atomic segments, the set of atomic segments can be decomposed into equivalence classes, or atom types. Thus, the nucleotide sequence is transformed into a simpler sequence of atoms.
The task of duplication history reconstruction is to find a sequence of evolutionary events (e.g., duplications, deletions, and speciations) that starts with an ancestral sequence of atoms, in which no atom type occurs twice, and ends with atomic sequences of extant species. Such a history also directly implies “gene trees” of individual atomic types, which we call segment trees. These trees are implicitly rooted and reconciled with the species tree, and this information can be easily used to reconstruct ancestral sequences at speciation points segment by segment (see e.g. (Blanchette et al.,, 2004)). A common way of looking at these histories is from the most recent events back in time. In this context, we can start from extant sequences, and unwind events one-by-one, until the ancestral sequence is reached.
Zhang et al., (2008) sought solutions of this problems with small number of events, given the sequence from a single species. In particular, they proved a necessary condition to identify candidates for the latest duplication operation, assuming no reuse of breakpoints. After unwinding the latest duplication, the same step is repeated to identify the second latest duplication, etc. Zhang et al. showed that following any sequence of candidate duplications leads to a history with the same number of duplication events under no-breakpoint-reuse assumption. As a result, there may be an exponential number of most parsimonious solutions to the problem, and it may be impossible to reconstruct a unique history.
A similar parsimony problem has also been recently explored by Ma et al., (2008) in the context of much larger sequences (whole genomes) and a broader set of operations (including inversions, translocations, etc.). In their algorithm, Ma et al. reconstruct phylogenetic trees for every atomic segment, and reconcile these segment trees with the species tree to infer deletions and rooting. The authors give a polynomial-time algorithm for the history reconstruction, assuming no-breakpoint-reuse and correct atomic segment trees. Both methods make use of fairly extensive heuristics to overcome violations of their assumptions and allow their algorithms to be applied to real data.
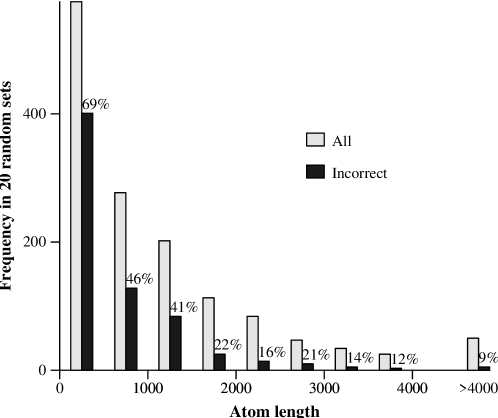
The no-breakpoint-reuse assumption is often justified by the argument that in long sequences, it is unlikely that the same breakpoint is used twice (Nadeau and Taylor,, 1984). However, there is evidence that breakpoints do not occur uniformly throughout the sequence, and that breakpoint reuse is frequent (Peng et al.,, 2006; Becker and Lenhard,, 2007). Moreover, breakpoints located close to each other may lead to short atoms that can’t be reliably identified by sequence similarity algorithms and categorized into atom types. For example, in our simulated data (Section 4), approximately 2% of atoms are shorter than 20bp and may appear as additional breakpoint reuses instead. Thus, no-breakpoint-reuse can be a useful guide, but cannot be entirely relied on in application to real data sets. We have also examined the assumption of correctness of segment trees inferred from sequences of individual segments (Fig.2). For segments shorter than 500bp (39% of all segments in our simulations) 69% of the trees were incorrectly reconstructed, and even for segments 500-1,000bp long, a substantial fraction is incorrect (46%).
In this paper, we present a simple probabilistic model for sequence evolution by duplication, and we design a sampling algorithm that explicitly accounts for uncertainty in the estimation of segment trees and allows for breakpoint reuse. The results of Zhang et al., (2008) suggest that, in spite of an improved model, there may still be many solutions of similar likelihood. The stochastic sampling approach allows us to examine such multiple solutions in the same framework and extract expectations for quantities of particular interest (e.g., the expected number of events on individual branches of the phylogeny, or local properties of the ancestral sequences). In addition, by using data from multiple species, our approach obtains additional information about ancestral configurations.
Our problem is closely related to the problem of reconstruction of gene trees and their reconciliation with species trees. Recent algorithms for gene tree reconstruction (e.g., Wapinski et al., (2007)) also consider genomic context of individual genes. However, our algorithms for reconstruction of duplication histories not only use such context as an additional piece of information, but the derived evolutionary histories also explain how similarities in the genomic context of individual genes evolved.
Our current approach uses a simple HKY nucleotide substitution model (Hasegawa et al.,, 1985), with variance in rates allowed between individual atomic segments. However, in future work it will be possible to employ more complex models of sequence evolution, such as variable rate site models and models of codon evolution, within the same framework. Such extensions will allow us to identify sites and branches under selection in gene clusters in a principled way, and contribute towards better functional characterization of these important genomic regions.
2 Probabilistic model of evolution with segmental duplication
In this section, we give a probabilistic model through segmental duplication on a given species tree . Such a model can be used to generate simulated data, as well as for inference.
We start with an ancestral sequence of length . In our model, this sequence evolves by duplications, deletions and substitutions. A duplication copies a source region and inserts the new copy at a target position in the sequence, either on the forward strand (with probability ) or on the reverse strand (with probability ). A duplication can be characterized by four coordinates: a centroid (the midpoint of the region between the leftmost and rightmost end of the duplication), the length of the source region, the distance between the source and the target, and a direction (from left to right or from right to left). The centroid is chosen uniformly, and the length and distance are chosen from given distributions (see below). Note that some centroid, distance, and length combinations are invalid; those combinations are rejected. Similarly, a deletion removes a portion of the sequence, and can be characterized by a centroid and a length. Again, some combinations will be invalid and are rejected. Each event is a deletion with probability , and a duplication with probability . This process straightforwardly defines the probability of any duplication or deletion event . Here, is the length of the sequence just before the event . The number of events on each branch is governed by a Poisson process with rate , and thus the probability of observing events on a branch of length is
A duplication history generated in this way implies a set of atomic segments of several types, as defined in the previous section. For each type , the history also implies a segment tree . The substitutions in the nucleotide sequences of atom are governed by the HKY substitution model along the corresponding segment tree .
We can compute the joint probability of a given set of extant sequences and a history (up to a normalization constant) as follows. Let be a species tree with branches Then:
| (1) |
where is the probability of events of history that occur on branch of the species tree, represents nucleotide sequences of atoms of type , and is the probability of these sequences given tree . For a sequence of events on branch , the probability is simply:
| (2) |
where is the length of the sequence before event .
To reduce the number of model parameters, we use geometric distributions to model lengths and distances of duplication events. To estimate these distributions, we have used the lengths and distances estimated by Zhang et al., (2008) from human genome gene clusters (mean length 14,307, mean distance 306,718). The geometric distributions seem to approximate the observed length distributions reasonably well. Similarly, we estimated the probability of inversion from the same data, we set the probability of deletion as , and the length distribution of deletions matches the distribution of duplication lengths.
Note that for our application, the normalization constant for does not need to be computed. We assume a uniform prior on length distribution of ancestral lengths. This has only a small effect for fixed extant sequences, since the ancestral length is determined mostly by the length of individual atomic segment types, since the ancestral sequence should contain one occurrence of each segment type. Some combinations of centroids, distances, and lengths will be rejected, but we assume that in long enough sequences, the effect of this rejection step will be negligible and we ignore it altogether.
In the MCMC algorithm below, we compute likelihood and branch lengths for each segment tree separately. This independence assumption simplifies computation and allows variation of rates and branch lengths between atoms. This is desirable, since sequences of different functions may evolve at different substitution rates, and selection pressures may change the proportions of individual branch lengths. On the other hand, branch lengths tend to be correlated among segment trees when individual atoms are duplicated together, and this information is lost by separating the likelihood computations. We are working on a more systematic solution to the problem of rate and branch length variation.
3 Metropolis–Hastings sampling
We use the Metropolis–Hastings Markov chain Monte Carlo algorithm (Hastings,, 1970) to sample from the posterior probability distribution defined in the previous section, conditional on the extant sequences and their atomization. The result of the algorithm is a series of samples that can be used to estimate expectations of quantities of interest (e.g., numbers of events on individual branches, posteriors of individual segment trees, and particular ancestral sequences), or to examine high likelihood histories.
Briefly, the Metropolis–Hastings algorithm defines a Markov chain whose stationary distribution is the target distribution, but the moves of the Markov chain are defined through a different proposal distribution. We start by initializing sample history . In each iteration, we use a randomized proposal algorithm described below to propose a candidate history according to a distribution conditional on sample . Sample is either accepted () with probability , or rejected () otherwise. The acceptance probability is used to ensure that the stationary distribution of the Markov chain is indeed the target distribution (Hastings,, 1970):
| (3) |
where is the probability of proposing history if the previous history was .
In the rest of this section, we describe the proposal algorithm. Even though this algorithm employs a number of heuristics to improve overall performance of the sampler, it only affects the mixing rate and convergence properties of the sampling, not the asymptotic correctness of the MCMC algorithm.
The algorithm starts by sampling an unrooted guide tree for every atom type . The segment trees implied by the proposed history will be rooted and refined versions of these guide trees. Each individual guide tree is sampled from the posterior distribution of the trees conditional on a fixed multiple alignment of all instances of atom type . By sampling the guide trees, instead of fixing a particular segment trees (as is done by Ma et al., (2008)), we account for uncertainty in the tree topologies. Since the branches with a small number of expected substitutions cannot be usually estimated reliably, we collapse those with fewer than 5 expected substitutions over the length of the atom sequence. Thus, the guide trees for shorter atoms, where uncertainty is high, will be close to uninformative star trees, while the trees for longer atoms will remain more resolved.
The proposal algorithm then samples a history consistent with the given set of guide trees. It does so by starting at the leaves of the trees and progressively sampling groups of atom pairs to merge, until the roots of the trees are reached and only a single copy of each atom remains. Merging of two groups of atoms corresponds to unwinding one duplication. To obtain a valid history consistent with the guide trees, the two groups must satisfy several conditions. First, each of the two groups has to be a contiguous subsequence of the current atomic sequence. Also, the corresponding atoms of the two groups must be of the same type. Finally, the corresponding atoms must be cherries in their guide trees. (The leaves and are cherries in if they have the same parent.)
For example, if the most recent duplication copied atoms to atoms then and must be cherries in the tree , and and must be cherries in the tree . Unwinding of this duplication will correspond to removal of and from the trees and and from the atomic sequence. Now, the same conditions can be applied to the second latest duplication. In this way, a particular set of guide trees can significantly restrict the set of possible histories.
The sampling distribution over candidate groups of atoms is determined by a series of heuristic penalties described below. The multiple alignment for each segment type is created by MUSCLE (Edgar,, 2004). Even though it is possible to sample multiple alignments to prevent potential alignment errors from propagating throughout the whole analysis (Holmes and Bruno,, 2001), such sampling is by itself computationally intensive. Given that in this paper we consider sequences of greater than 90% similarity, we do not expect multiple alignments to be a major source of error in our reconstructions. Trees, branch lengths, and HKY nucleotide substitution model parameters are sampled by MrBayes (Ronquist and Huelsenbeck,, 2003) with uniform prior over tree topologies, and default priors for the other parameters. For each segment type , all the tree samples are precomputed in a run of 10,000 iterations with a burn-in of 2,500 samples, keeping every 10th sampled tree. In every iteration of the history proposal algorithm, we keep the previous tree with 95% probability, otherwise we choose a new tree randomly from the pre-computed samples.
Proposal distribution. As described above, the proposal distribution for histories is defined by a sequential sampling procedure that selects groups of atom pairs to merge in each step. The goal is to define this distribution so that the overall proposal distribution is as close as possible to the actual conditional distribution , making the acceptance probability as close as possible to one. Directly characterizing appears to be difficult, so we settle for a heuristic weighting function in the proposal distribution for merges that is designed to produce reasonably good proposed histories. The Metropolis-Hastings algorithm will ensure that the retained samples will accurately reflect the posterior distribution, once the Markov chain reaches stationarity.
In each step, we consider all possible duplications consistent with the current set of guide trees, as well as selected deletion and speciation events. Deletions do not leave observable sequence traces in extant species, and thus it is not possible precisely date them; instead, in the proposal algorithm we associate deletions with the speciation or duplication events that occurred before them. We allow a single deletion following a duplication. We consider only deletions completely inside the source or target sequence of the duplication. A speciation event is represented as a copy of all atomic segments from one species to a previously empty sequence of another species, possibly followed by several deletions in both species. We only allow speciations in the partial order imposed by the species tree. Additionally, we propose only speciations that maximize the total sequence length of matched atomic segments between the two species. As in the case of duplications, only segments that are currently cherries in the corresponding guide trees can be matched. For example, if we have sequences in two species and , and and are not cherries in the segment tree, we have to propose speciation from an ancestral sequence or , followed by one deletion in species and one deletion in species . Proposals that obey these constraints can be easily generated by a simple dynamic programming algorithm, and in the case of many possible speciation proposals, we only keep 20 highest weight candidates. Note that it is always possible to propose at least one event until we reach an ancestral sequence of unique atoms.
We characterize each proposed event by a feature vector and the probability of choosing the event will be proportional to for some fixed set of weights . In the rest of this section we briefly describe these features and their weights.
Target length. The basis of the weight is the length of duplication or speciation, i.e. how much sequence is removed by unwinding the event. We set and .
Previously seen event. To keep the newly proposed history similar to the previous sample , we add bonus to events seen in . This is achieved by a binary indicator feature and weight . Some events may not be possible in the new history due to changes in the guide trees.
Branch length mean and variance. For a given duplication consistent with the guide tree set, we can compute the mean distance of corresponding cherries in the guide tree (weighted by the lengths of atoms in nucleotides), and also variance on such distance . The lower indicates likely more recent events, while large variance would indicate that we are merging two or more events that happened at different times. We set , , , .
Partial duplication penalty. If the proposed duplication is a subset of a larger duplication, we set indicator and use .
Breakpoint reuse penalty. Although, we allow breakpoint reuse, we favor duplications with fewer breakpoint reuses which seems to be particularly useful for determining correct direction of duplications. We have implemented the three conditions stipulated by Zhang et al., (2008) based on collapsibility of atom pairs on boundaries of the duplicated segments. We set to the number of violated conditions and ;
Pair reduction bonus. Consider the number of distinct pairs of adjacent atom types that occur in the current set of sequences. For input with atom types, when we reach the ancestral sequence, and each duplication reduces by at most 2. This gives us a lower bound on the number of events necessary to reach the ancestral sequence. We set to be the reduction of achieved by the event ( can be negative if increases) and .
Deletion penalties. Deletion associated with a duplication is penalized by setting and . In addition, we penalize longer deletions by setting and where is the length of the target sequence in the duplication, and is the length of the deletion. Each deletion associated with a speciation is penalized by setting and .
Heat constants. Finally, in some rounds of the MCMC sampler, we want to explore radically new histories, while in other rounds we want to concentrate on smaller local improvements. Thus, we exponentiate the final event weights to a heat constant, which changes from round to round. In our experiments, we have used cyclic sequence of heats .
4 Experiments
We have implemented the MCMC sampler described above and verified its functionality on simulated data. For the simulations, we have estimated branch lengths and HKY model parameters (equilibrium frequencies and transition/transversion ratio) from the UCSC syntenic alignments (Karolchik et al.,, 2008) of human, chimp, and macaque on human chromosome 22. The (geometric) distributions for source lengths and source/target distances, and the proportion of duplications with inversion were estimated from the analysis of human gene clusters by Zhang et al., (2008). Finally, we set the deletion rate to 5% of the duplication rate, and the length distribution of deletions to match that of duplications.
rate 200 (slow) rate 300 (fast) PRAME AMY UGT1A min max mean min max mean Seq. len (kb) 91 295 172 120 387 219 1000, 200 221, 170 210, 210, 250 No. atom types 15 53 36 39 57 48 39 44 55 No. duplications 5 24 15 18 29 23 No. deletions 0 3 0.8 0 3 1.1 Species H,C,R H,C,R H,R H,R H,C,O
We used the simulation to create 20 simulated gene clusters in each of the following two categories: slow evolving and fast evolving (duplication rate at 200 and 300 times substitutions per site, respectively). We have applied the algorithm to atomic segments derived from the simulation. However, to emulate the increase in breakpoint reuse due to imperfect identification of alignment boundaries in real data sets, we have removed short atomic segments (bp). A summary of the resulting data sets can be found in Table 1.
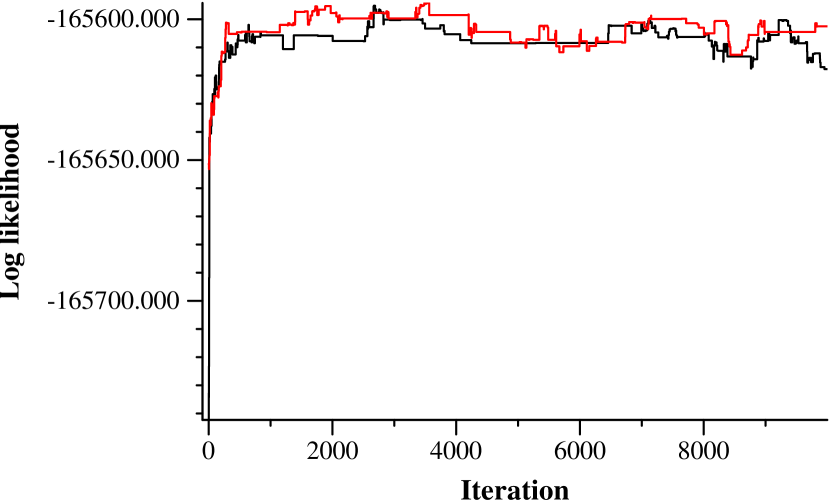
For each cluster, we ran two chains of the MCMC sampler from a random starting points for up to 10,000 iterations each, discarding the first 2,500 samples as burn-in. The sampler seems to converge reasonably quickly, as illustrated by Fig.3.
| rate 200 (slow) | rate 300 (fast) | |||||||||
| Method | ||||||||||
| MCMC | 1 | 15 | 1 | 3 | 0 | 1 | 16 | 1 | 2 | 0 |
| ML | 1 | 15 | 1 | 2 | 1 | 1 | 16 | 0 | 3 | 0 |
| Z2008 | 3 | 14 | 2 | 1 | 0 | 1 | 6 | 4 | 3 | 6 |
A summary of the results on the simulated data is shown in Tables 2,3. In the majority of cases we predict the correct number of events along the human lineage (16 out of 20 for slowly evolving, 16 out of 20 for fast evolving clusters). Note that in some cases the predicted number of events is lower than the actual number of events: this is likely due to events that become invisible in present day sequence due to subsequent deletions. Compared to Zhang et al., (2008), the performance has improved, especially in the case of fast evolving clusters (Table 2). However, the results of the two programs are not directly comparable, since our program was run on correct atoms with short atoms filtered out, and the program by (Zhang et al.,, 2008) used its own atomization procedure which may make errors.
Table 3 shows the distribution of predicted events along the individual branches of the phylogeny. In some cases, events are predicted to occur on the wrong branch of the phylogeny, but the differences between the predicted and actual numbers of events are small.
| rate 200 (slow) | rate 300 (fast) | |||||||||
| Branch | ||||||||||
| Duplications: | ||||||||||
| human | 0 | 20 | 0 | 0 | 0 | 0 | 20 | 0 | 0 | 0 |
| hominid | 1 | 19 | 0 | 0 | 0 | 5 | 15 | 0 | 0 | 0 |
| chimp | 0 | 20 | 0 | 0 | 0 | 0 | 20 | 0 | 0 | 0 |
| macaque | 6 | 13 | 1 | 0 | 0 | 2 | 18 | 0 | 0 | 0 |
| root | 0 | 15 | 5 | 0 | 0 | 0 | 17 | 2 | 1 | 0 |
| total | 3 | 16 | 0 | 1 | 0 | 4 | 16 | 0 | 0 | 0 |
| Deletions: | ||||||||||
| human | 0 | 20 | 0 | 0 | 0 | 0 | 20 | 0 | 0 | 0 |
| hominid | 1 | 16 | 3 | 0 | 0 | 0 | 15 | 5 | 0 | 0 |
| chimp | 0 | 20 | 0 | 0 | 0 | 0 | 20 | 0 | 0 | 0 |
| macaque | 0 | 18 | 2 | 0 | 0 | 1 | 18 | 0 | 1 | 0 |
| root | 0 | 19 | 1 | 0 | 0 | 0 | 20 | 0 | 0 | 0 |
| total | 0 | 17 | 1 | 2 | 0 | 1 | 12 | 6 | 1 | 0 |
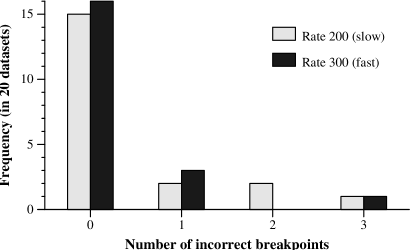
We have also compared predicted and actual ancestral atomic sequences (Fig.4). In the vast majority of cases (31 out of 40), the expected number of incorrect breakpoints is smaller than .
Beyond the simulated data, we have applied our algorithm to the following gene cluster sequences: PRAME (human-macaque phylogeny), AMY (human-macaque phylogeny), and UGT1A (human-chimp-orang phylogeny). The PRAME (preferentially expressed antigen in melanoma) cluster is one of the most active gene clusters in human genome, and shows strong evidence of positive selection (Birtle et al.,, 2005; The Rhesus Macaque Genome Sequencing and Analysis Consortium,, 2007). The AMY cluster contains five amylase genes that are responsible for digestion of starch. It appears to have expanded much faster in humans than in other primates, according to aCGH experiments (Dumas et al.,, 2007). The UGT1A cluster consists of multiple isoforms of a single gene that is instrumental in transforming small molecules into water-soluble and excretable metabolites. This gene has at least thirteen unique alternate first exons that result from duplications at various stages of mammalian evolution. UGT1A therefore provides an unusual opportunity for studying promoter evolution.
UGT1A:

PRAME:

AMY:

Recently duplicated clusters tend to be grossly missassembled in shotgun-based genomes (Green,, 2001; Zhang et al.,, 2008), so we have to rely on BAC sequencing. We have screened BACs from chimp, orangutan, and macaque sequenced at Washington University St. Louis and Baylor Medical College for similarity with the corresponding human sequences. We have assembled overlapping BACs into longer contigs and selected subregions whose ends showed clear homology with upstream and downstream portions of the human cluster. Then, we have applied a simple method to identify atomic segments. Briefly, we divide the sequences into equally sized 500bp windows, and for each window we find approximate copies in all available sequences at 90% identity cutoff. The atoms are assigned in a greedy way (starting from the windows with the largest number of copies), and windows overlapping already assigned atoms are discarded. Finally, atoms that always occur in pairs are merged into longer atoms. Table 1 shows an overview of the resulting sequences and atoms.
For each cluster, we ran five chains from different starting points for 5,000–10,000 samples, discarding the first 2,500 samples. We have estimated the number of duplications and deletions overall (Table 1), and on individual branches of the phylogeny (Fig.5). The estimated numbers of duplications for PRAME and AMY are comparable to those of Zhang et al. (Zhang et al.,, 2008). With UGT1A, we obtain higher estimates possibly due to differences in our atomization procedure, and/or effects of the additional species in the analysis.
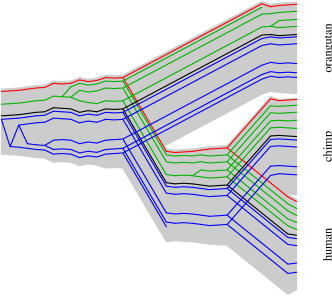
A tube tree shows the duplication history of several atomic segments in the context of the species tree, and their locations in the extant and ancestral sequences. Figure 6 shows the tube tree for the highest likelihood reconstruction of the history of the UGT1A cluster. This cluster consists of several isoforms of the same five-exon gene. Atoms corresponding to the protein coding exons are highlighted in color. Exons 2-5 are shared among all the isoforms, while exon 1 is alternatively spliced. Our analysis shows clear division of the first exons into three distinct groups (green, black, and blue) and their ortholog/paralog relationships in human, chimp, and orangutan.
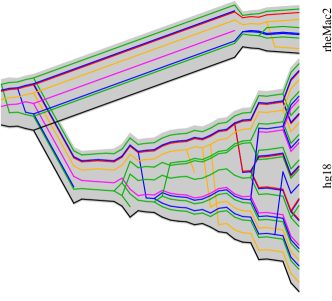
While the duplication history of the UGT1A cluster consists of mostly ancient events, the PRAME cluster (Fig.7) shows very recent large-scale duplications, especially in the human lineage. In the tube tree in Fig.7, such events are shown by several co-linear bifurcations at the same level of the tube tree. The reconstruction of the evolutionary history of this cluster by traditional methods (gene tree/species tree reconciliation) is complicated by the presence of recent duplications (99% similarity), and presence of the chimeric genes (The Rhesus Macaque Genome Sequencing and Analysis Consortium,, 2007). We address these issues by considering multiple guide segment trees for each atom as well as spacial configuration of atoms in multiple species. However, this predicted history is by no means perfect. Rhesus sequence exhibits a large regions which apparently arose by a single duplication with reversal; however due to differences in the atomic sequence this event was split into several shorter duplications. We expect that improved procedure for segmenting sequence into atoms will help to address this problem.
Fig.8 shows a cartoon of the ancestral atomic PRAME sequence of the highest posterior probability, as well as other pairs of adjacent atoms with posterior probability . This reconstruction of ancestral atomic sequence shows more uncertainty than similar reconstructions in the simulated data, though there are large blocks resolved uniquely.

5 Discussion
In this paper, we have introduced a new model of evolution of duplicated gene clusters and designed an MCMC-based algorithm that allows reconstruction of high probability evolutionary histories of such gene clusters. We have tested our method on both simulated and real data.
Methods in comparative genomics traditionally concentrate on sequences where 1:1 orthology can be established. In case of gene clusters, this is rarely the case, due to their complex evolutionary histories. Our efforts in reconstruction of gene cluster evolutionary histories will yield accurate segment trees that will support further development of comparative genomic tools that can be applied to analyze these complex regions.
However, gene clusters should not be seen only as a confounding factor. The number of orthologous sequences studied, as well as their divergence and phylogenetic relationships greatly impact the accuracy of comparative genomic studies. For example, Kosiol et al., (2008) has shown that the sensitivity of scans for positive selection is greatly helped by presence of complex phylogeny. While studies based on orthologous regions between species can provide us with a phylogeny of up to 10 orthologous copies of a particular mammalian gene at present, some clusters can provide much more copies with significantly more complex phylogeny even within a single species (for example, the PRAME cluster in the human genome contains more than 30 copies). Thus, the gene clusters provide an opportunity for refined look at evolution of genes and genomes. Multiple sources of evidence suggest that many of the interesting developments in genomes happen within the boundaries of gene clusters, which further increases our interest in their study.
Multiple efforts are currently under way to recover accurate sequences of selected gene clusters in multiple species and in multiple populations (Zhang et al.,, 2008; Zody et al.,, 2008) by BAC sequencing. Accurate methods and models for reconstruction of duplication histories of these clusters are essential to our understanding of evolution, function, and biomedical implications of these regions.
The general framework of our method allows future developments. One limitation of our sampler is its low sample acceptance ratio, indicating low level of mixing in the Markov chain. We plan to devise a systematic way for tuning the parameters in the proposal distribution towards better acceptance ratios. We also plan to improve underlying probabilistic model. Currently the branch lengths in segment trees are chosen independently of the duplication history. Instead, we plan to consistently date duplication events on each branch, and use a scaling parameter for each atom type so that we can accurately model correlation between branch lengths of individual atom types and at the same type allow rate variation in different parts of the sequence. An interesting alternative approach might be to use combinatorial optimization instead of sampling to find maximum likelihood history in the above model.
Acknowledgements.
We would like to thank Devin Locke and LaDeana Hillier at Washington University, St. Louis for providing us with the BAC sequences from chimp, orangutan, and macaque. We would also like to thank Webb Miller and Yu Zhang for helpful discussions on this problem.
References
- Becker and Lenhard, (2007) Becker, T. S. and Lenhard, B. (2007). The random versus fragile breakage models of chromosome evolution: a matter of resolution. Mol Genet Genomics, 278(5):487–491.
- Birtle et al., (2005) Birtle, Z., Goodstadt, L., and Ponting, C. (2005). Duplication and positive selection among hominin-specific PRAME genes. BMC Genomics, 6:120.
- Blanchette et al., (2004) Blanchette, M., Green, E. D., Miller, W., and Haussler, D. (2004). Reconstructing large regions of an ancestral mammalian genome in silico. Genome Res, 14(12):2412–2413.
- Dumas et al., (2007) Dumas, L., Kim, Y. H., Karimpour-Fard, A., Cox, M., Hopkins, J., Pollack, J. R., and Sikela, J. M. (2007). Gene copy number variation spanning 60 million years of human and primate evolution. Genome Res, 17(9):1266–1267.
- Edgar, (2004) Edgar, R. C. (2004). MUSCLE: a multiple sequence alignment method with reduced time and space complexity. BMC Bioinformatics, 5:113.
- Elemento et al., (2002) Elemento, O., Gascuel, O., and Lefranc, M. P. (2002). Reconstructing the duplication history of tandemly repeated genes. Mol Biol Evol, 19(3):278–278.
- Green, (2001) Green, E. D. (2001). Strategies for the systematic sequencing of complex genomes. Nat Rev Genet, 2(8):573–573.
- Hasegawa et al., (1985) Hasegawa, M., Kishino, H., and Yano, T. (1985). Dating of the human-ape splitting by a molecular clock of mitochondrial DNA. J Mol Evol, 22(2):160–164.
- Hastings, (1970) Hastings, W. K. (1970). Monte Carlo sampling methods using Markov chains and their applications. Biometrika, 57:97–109.
- Holmes and Bruno, (2001) Holmes, I. and Bruno, W. J. (2001). Evolutionary HMMs: a Bayesian approach to multiple alignment. Bioinformatics, 17(9):803–810.
- Karolchik et al., (2008) Karolchik, D., Kuhn, R. M., Baertsch, R., Barber, G. P., Clawson, H., Diekhans, M., Giardine, B., Harte, R. A., Hinrichs, A. S., Hsu, F., Kober, K. M., Miller, W., Pedersen, J. S., Pohl, A., Raney, B. J., Rhead, B., Rosenbloom, K. R., Smith, K. E., Stanke, M., Thakkapallayil, A., Trumbower, H., Wang, T., Zweig, A. S., Haussler, D., and Kent, W. J. (2008). The UCSC Genome Browser Database: 2008 update. Nucleic Acids Res, 36(Database issue):D773–779.
- Kosiol et al., (2008) Kosiol, C., Vinar, T., da Fonseca, R. R., Hubisz, M. J., Bustamante, C. D., Nielsen, R., and Siepel, A. (2008). Patterns of positive selection in six Mammalian genomes. PLoS Genet, 4(8):e1000144.
- Lajoie et al., (2007) Lajoie, M., Bertrand, D., El-Mabrouk, N., and Gascuel, O. (2007). Duplication and inversion history of a tandemly repeated genes family. J Comput Biol, 14(4):462–468.
- Lander et al., (2001) Lander, E. S. et al. (2001). Initial sequencing and analysis of the human genome. Nature, 409(6822):860–921.
- Ma et al., (2008) Ma, J., Ratan, A., Raney, B. J., Suh, B. B., Miller, W., and Haussler, D. (2008). The infinite sites model of genome evolution. Proc Natl Acad Sci U S A, 105(38):14254–61.
- Nadeau and Taylor, (1984) Nadeau, J. H. and Taylor, B. A. (1984). Lengths of chromosomal segments conserved since divergence of man and mouse. Proc Natl Acad Sci U S A, 81(3):814–818.
- Ohno, (1970) Ohno, S. (1970). Evolution by Gene Dupplication. Springer, Berlin.
- Peng et al., (2006) Peng, Q., Pevzner, P. A., and Tesler, G. (2006). The fragile breakage versus random breakage models of chromosome evolution. PLoS Comput Biol, 2(2):e14.
- Ronquist and Huelsenbeck, (2003) Ronquist, F. and Huelsenbeck, J. P. (2003). MrBayes 3: Bayesian phylogenetic inference under mixed models. Bioinformatics, 19(12):1572–1574.
- Schwartz et al., (2003) Schwartz, S., Kent, W. J., Smit, A., Zhang, Z., Baertsch, R., Hardison, R. C., Haussler, D., and Miller, W. (2003). Human-mouse alignments with BLASTZ. Genome Res, 13(1):103–107.
- The Rhesus Macaque Genome Sequencing and Analysis Consortium, (2007) The Rhesus Macaque Genome Sequencing and Analysis Consortium (2007). Evolutionary and biomedical insights from the rhesus macaque genome. Science, 316(5822):222–224.
- Wapinski et al., (2007) Wapinski, I., Pfeffer, A., Friedman, N., and Regev, A. (2007). Automatic genome-wide reconstruction of phylogenetic gene trees. Bioinformatics, 23(13):i549–558.
- Zhang et al., (2008) Zhang, Y., Song, G., Vinar, T., Green, E. D., Siepel, A., and Miller, W. (2008). Reconstructing the Evolutionary History of Complex Human Gene Clusters. In Research in Computational Molecular Biology: 12th Annual International Conference (RECOMB), volume 4955 of Lecture Notes in Bioinformatics, pages 29–49. Springer.
- Zody et al., (2008) Zody, M. C., Jiang, Z., Fung, H. C., Antonacci, F., Hillier, L. W., Cardone, M. F., Graves, T. A., Kidd, J. M., Cheng, Z., Abouelleil, A., Chen, L., Wallis, J., Glasscock, J., Wilson, R. K., Reily, A. D., Duckworth, J., Ventura, M., Hardy, J., Warren, W. C., and Eichler, E. E. (2008). Evolutionary toggling of the MAPT 17q21.31 inversion region. Nat Genet, 40:1076–1083.