Explosive events associated with a surge
Abstract
The solar atmosphere contains a wide variety of small-scale transient features. Here, we explore the inter-relation between some of them such as surges, explosive events and blinkers via simultaneous spectral and imaging data taken with the TRACE imager, the SUMER, and CDS spectrometers on board SoHO, and SVST La Palma. The features were observed in spectral lines with formation temperatures from 10,000 K to 1 MK and with the TRACE Fe ix/x 171 Å filter. The H filtergrams were taken in the wings of the H 6365 Å line at 700 mÅ and 350 mÅ. The alignment of all data both in time and solar XY shows that SUMER line profiles, which are attributed to explosive events, are due to a surge phenomenon. The surge’s up- and down-flows which often appear simultaneously correspond to the blue- and red-shifted emission of the transition region N v 1238.82 Å and O v 629.77 Å lines as well as radiance increases of the C i, S i and S ii and Si ii chromospheric lines. Some parts of the surge are also visible in the TRACE 171 Å images which could suggest heating to coronal temperatures. The surge is triggered, most probably, by one or more Elerman bombs which are best visible in H 350 Å but were also registered by TRACE Fe ix/x 171 Å and correspond to a strong radiance increase in the CDS Mg ix 368.07 Å line. With the present study we demonstrate that the division of small-scale transient events into a number of different subgroups, for instance explosive events, blinkers, spicules, surges or just brightenings, is ambiguous, implying that the definition of a feature based only on either spectroscopic or imaging characteristics as well as insufficient spectral and spatial resolution can be incomplete.
1 Introduction
Over the last decades, the increased use of space observatories such as the Solar and Heliospheric Observatory (SoHO), the Transition Region Coronal Explorer (TRACE) and presently Hinode, coupled with ground-based observations, have brought many new features on the Sun to light. What is, however, more important is that the combination of different types of observations, i.e. spectroscopic and imaging, covering a wide wavelength range and having a similar cadence and spatial resolution, provide crucial information on the nature and the physical characteristics of these phenomena.
We now know that the solar atmosphere contains different kinds of small-scale transient events. A particular transient phenomenon, however, is often associated with a specific instrument or a type of instrument, either a spectrometer or an imager. Explosive events (EEs; registered by the Solar Ultraviolet Measurement of Emitted Radiation (SUMER) spectrometer and the High Resolution Telescope and Spectrometer (HRTS)), for instance, were found to be restricted to transition region temperatures from 2 104 K to 5 105 K. They were first discovered by Brueckner & Bartoe (1983) in C iv 1548.21 Å data taken with HRTS. They are characterized as short-lived (60 – 350 s) small-scale (3′′ – 5′′ along a spectrometer slit) events identified by Doppler shifts of up to 200 km s-1. It has been suggested that they result from the production of high-velocity bi-directional plasma jets during magnetic reconnection (Dere, 1994). They often occur in areas with weak fluxes of mixed polarity or on the border of regions with large concentration of magnetic flux (Chae et al., 1998) and are often observed in bursts lasting up to 30 min in regions undergoing magnetic cancellation (Dere 1994, Chae et al. 1998, Perez et al. 1999, Doyle et al. 2006). Another term often associated with them is bi-directional jets (Innes et al., 1997).
Surges, mainly observed in H (104 K) and Ca ii K & H (6 103 K) as well as Extreme-ultraviolet (EUV) and X-ray jets are also assumed to result from the same physical mechanism. Solar surges are associated with active regions and represent an ejection of dense chromospheric material (Ne 1011 cm-3) in the shape of straight or arch-shaped collimated streamers seen dark or bright in the H line (Roy, 1973). The up-flows often return to the solar surface along the same trajectory. Their occurrence is associated with Ellerman bombs (Ellerman, 1917) in their foot-points.
The term blinker was first used by Harrison (1997) to describe a small-scale (on average 8′′ 8′′) brightening in EUV lines observed with the Coronal Diagnostics Spectrometer (CDS) onboard SoHO. They last on average 17 min and are preferentially located in the network boundaries (Bewsher et al., 2002). It has been suggested that they represent an observational signature of increased filling factor rather than electron density. Several physical mechanisms have been put forward by Priest et al. (2002), Doyle et al. (2004) and Marik & Erdélyi (2002).
There have been attempts to unify some of these terminologies, e.g. blinkers have been suggested as a generic term for EUV network and cell brightenings (Harrison et al., 2003). Chae et al. (2000) stated that blinkers and EEs were the same phenomenon, while Madjarska & Doyle (2003) found them to be two separate unrelated events, as did a statistical study by Brković & Peter (2004). Madjarska & Doyle (2003) also speculated that blinkers may simply be the on-disk signature of spicules. Their work later lead to the suggested notion that some blinkers and macro-spicules are the same phenomenon (O’Shea et al., 2006; Madjarska et al., 2006).
The uniqueness of the present study lies in the exploration of small-scale transient phenomena using simultaneous EUV high-cadence and the highest existing spatial and spectral resolution data currently available together with ground-based H observations. We analyzed numerous small-scale transient features seen along a SUMER slit in chromospheric (C i, Si i, ii and S ii), transition region (N v and O v) and coronal (Mg x) spectral lines, and their counterparts in SVST H filtergrams and TRACE 171 Å images. Our main objective is to derive the spectral characteristics of these events and compare them with their image appearance at coronal and chromospheric temperatures which should provide their correct identification and evaluation of their plasma quantities and dynamics, and could suggest a possible physical mechanism of their generation.
2 SUMER, CDS, TRACE and SVST La Palma observational material
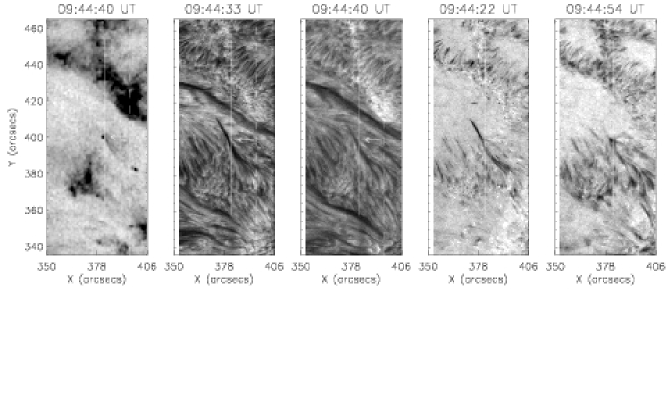
All data were obtained on 1 June 1999 in active region NOAA 8559 with the SUMER slit placed over the plage area. The standard data reduction procedures were applied to all observational material. The SUMER dataset (Wilhelm et al., 1995) was taken from 09:03:23 UT to 11:01:42 UT with the solar rotation compensation mode turned on. Slit 0.3′′ 120′′ was used, exposing for 25 s the bottom part of detector B. A list of the analyzed spectral lines is given in Table 1. The CDS data were taken with a 25 s exposure time resulting in a 34 s cadence in a sit-and-stare mode with a 2′′ 181′′ slit. The observed spectral lines are also reported in Table 1. The TRACE 171 Å dataset (Handy et al., 1999) was obtained from 09:15:44 UT to 10:39:56 UT, exposing for 5.8 s resulting in 10 s to 40 s cadence. The images were derotated to a reference time of 08:17 UT. The H 6563 Å filtergrams were made with the Swedish Vacuum Solar Telescope (SVST) in La Palma. The H data were registered at 350 mÅ and 700 mÅ and have a pixel size of 0.083 arcsec/px. The cadence of the H–350 mÅ and –700 mÅ data is 1m14s1s and of the H+350 mÅ and +700 mÅ data 1m11s2s. In Fig. 1 we show an overview of the region observed by TRACE and SVST with the locations of the SUMER and CDS slits. The alignment of SUMER, CDS to the TRACE data with a precision of 1′′ was done as described in Doyle et al. (2005), using TRACE 171 Å images and a CDS Mg ix 368 Å raster. The coalignment of the H data to TRACE was done according to the recipe in de Pontieu et al. (1999).
3 Results & Discussion
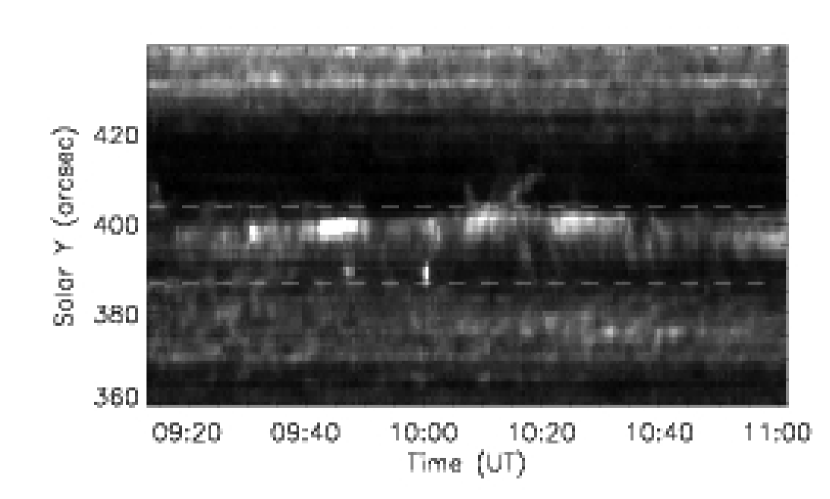
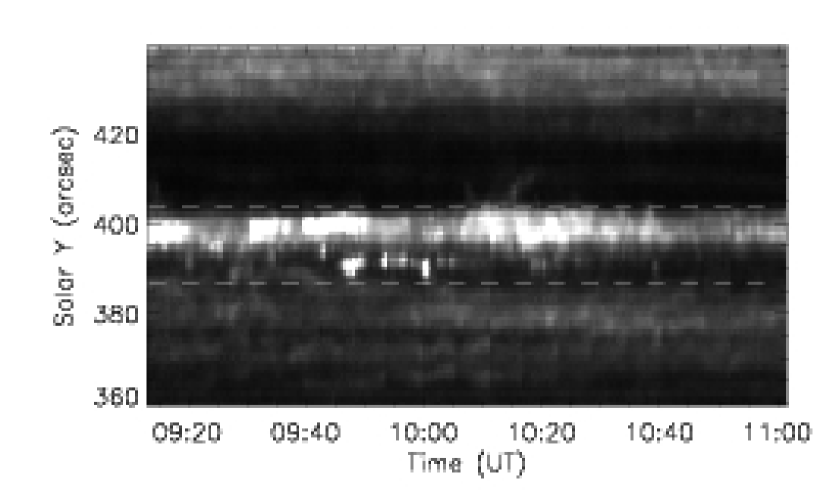
First, we inspected the SUMER spectral line profiles looking for radiance increases and/or line broadenings. Fig. 2 shows the radiance variations of the transition region O v 629 Å and N v 1238 Å lines. Brightenings are clearly seen in the area indicated with the horizontal dashed lines. The line profiles reveal a different response of the two transition region lines O v and N v which will be discussed later in the paper. The images were produced from the peak radiance of the spectral lines obtained from a single Gauss fit with the continuum emission removed. That helps to separate the intensity variation in the spectral line from the continuum emission changes. Increases of the continuum emission during explosive events is a well know fact (Madjarska & Doyle, 2002).
The next step of our analysis was to produce animated time sequences from some of the available data (see the on-line material). The movie consists of TRACE 171 Å images, the SUMER spectral windows of O v 629 Å, Mg x 625 Å together with several chromospheric lines, plus N v 1238 Å, and SVST H 6365 Å filtergrams taken at –350 mÅ. Additional movies can be seen at URL http://www.arm.ac.uk/$∼$madj/outgoing/Surge.
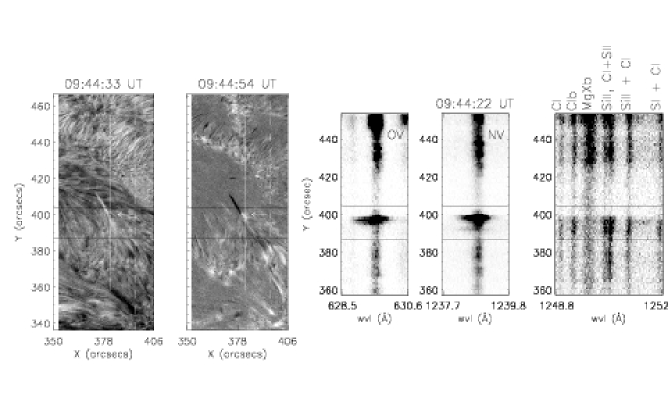
The SUMER spectral line profiles during the brightening events show all the hallmarks of explosive events, i.e. non-Gaussian profiles and only blue- or red-shifted emission or both. An example of these profiles is shown in Fig 3. When coupled with the TRACE 171 Å images, we see that some of the non-Gaussian profiles correspond to flows along elongated structures (see Fig. 1). However, not all SUMER line brightenings or wing emission increases correspond to an observed feature in the TRACE 171 Å images. The simple explanation is that not all structures reach temperatures corresponding to the temperature response of the 171 Å filter. The simultaneously obtained H images reveal that the H counterpart of the TRACE and SUMER events are numerous up- and down-flows, often happening simultaneous, seen in images taken at 350 and 700 mÅ. Additionally, we constructed Doppler images using the relation (Suematsu et al., 1995) where and are the contrast images obtained as . The corresponds to the average intensity over the whole dataset. The subscripts b and r correspond to the wavelengths at H 6563 Å –350 mÅ (or –700 mÅ) and +350 mÅ (or +700 mÅ), respectively (see Fig 3). The dark emission from the surge corresponds to the H +350 mÅ and +700 mÅ while the bright to H -350 and -700. With the available information from the H line it is not possible to derive (for instance via cloud model, see Alissandrakis et al. (1990) and Tsiropoula & Schmieder (1997)) the full meaning of the bright and dark features.
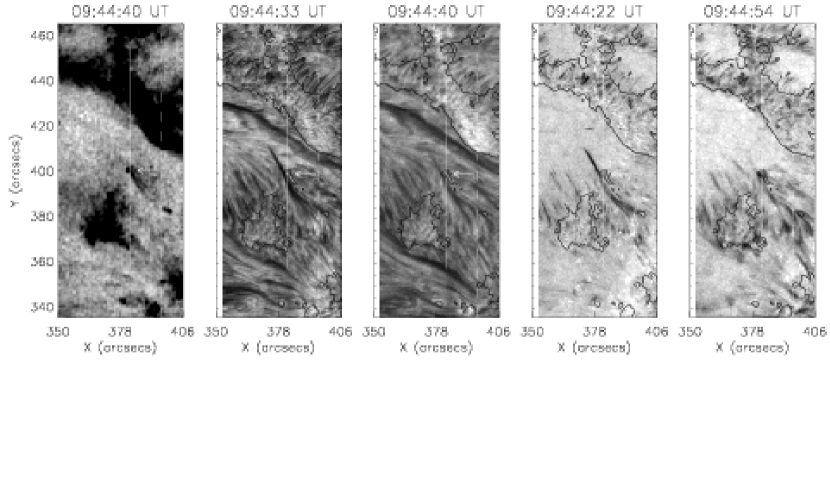
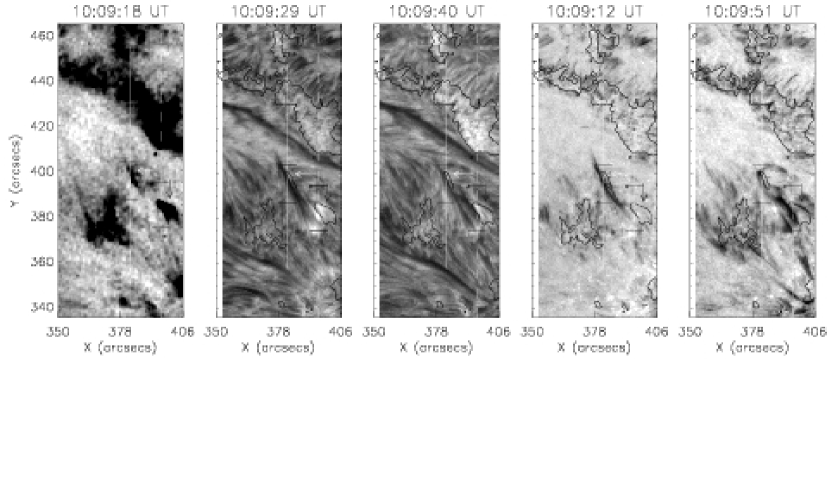
These up- and down-flows were identified as a typical surge event. The foot-points of the surge are anchored in one or more Ellerman bombs which re-occur several times triggering the surge re-appearance, as shown in Fig. 4, where we present a set of all images (TRACE plus all four H images) taken at two different times. The TRACE contours over-plotted on the H images help to cross-correlate the feature as seen in TRACE with the dark and bright H features from the surge and its foot-points. Jiang et al. (2007) presented in great detail the relation between H surges, EUV and X-ray jets which resemble very much the event analysed here (Fig. 4). They concluded that each surge consisted of a cool H component and hot, EUV or soft X-ray component which showed different evolution in space and time. The cadence of our H data does not permit such an analysis. However, the SUMER data do not show evidence for a different spatial behavior of the chromospheric and transition region emission. We should note that this could be due to the difference in the spatial resolution between the SVST and SUMER data as well as the fact that slit spectrometer data have their limitation for space analysis. Not all features seen in the transition region lines, however, have their counterpart in the chromospheric lines which suggests plasmas heated to higher temperatures. Unfortunately, the lack of magnetic field data makes it impossible to discuss the photospheric magnetic field configuration.
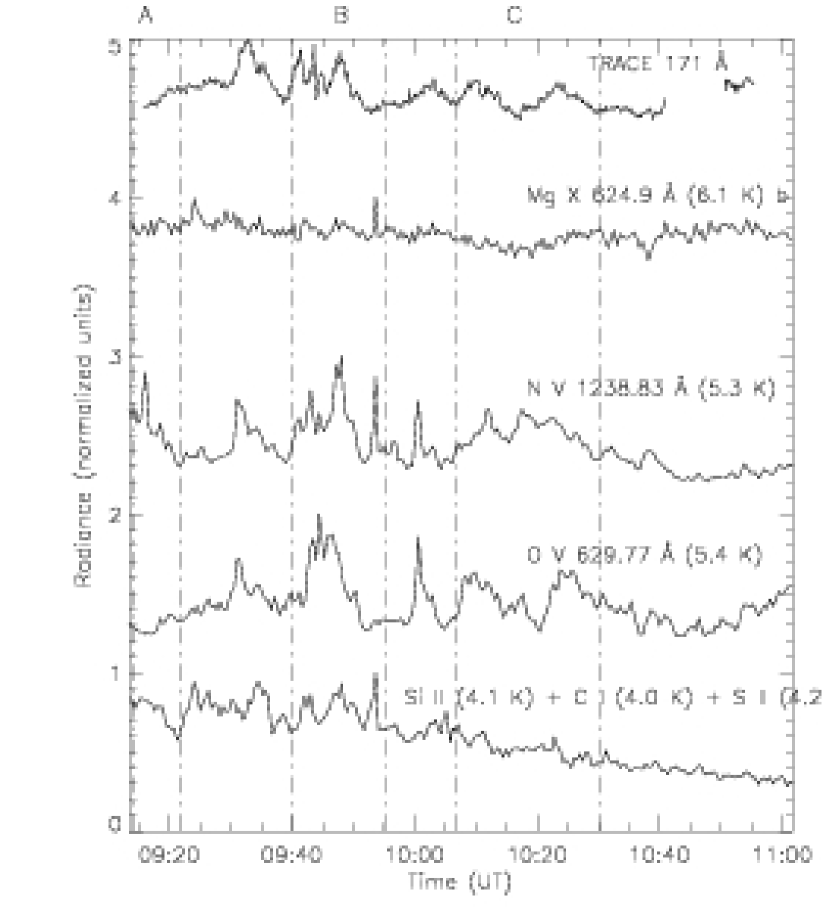
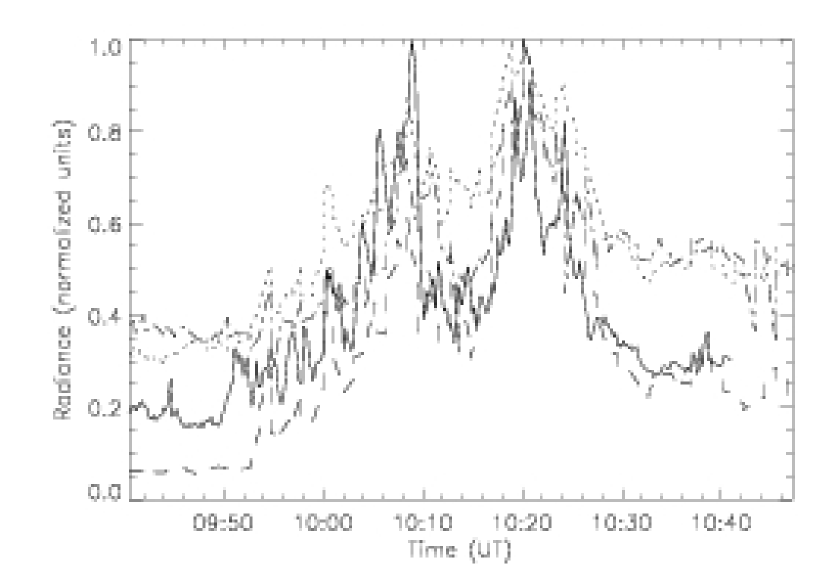
We performed a further spectroscopic analysis in order to gather more information on the relation between explosive events and surges. In order to analyze the temperature response of the surge plasma, we produced normalized light curves (Fig. 5) from spectral lines covering a large range of formation temperatures (see Table 1). The light curves were obtained by binning the partition along the SUMER slit outlined by two horizontal lines in Fig. 2 corresponding to 18 pixels (18 arcsec). The TRACE light curve was obtained by binning over an array of 4′′4′′ at Solar X = 382′′ and Solar Y = 400′′ where the SUMER slit crosses the event(s) as indicated in Fig. 1. All light curves were normalized to the maximum value of the radiance during the studied time interval. The TRACE 171 Å pass-band, although dominated by the Fe ix and Fe x lines, has some transition region lines in the range of 171.5–174 Å, e.g. O v and O vi, though, as shown by Doyle et al. (2003), their effect is small unless there is a substantial departure from a Maxwellian velocity distribution. Among the observed spectral lines is the coronal Mg x 625 Å (1 MK) line. Its light curve in Fig. 5 shows no clear evidence for enhanced emission except around 09:25 UT and 09:55 UT. Comparing with the chromospheric light curve in Fig. 5, we found that these increases in the Mg x emission are due to the blend from several cooler lines (see Table 1) rather than Mg x itself (Teriaca et al., 2002). Another possible explanation is that Mg x has very slow ionization and recombination time scales, as described by Golub et al. (1989). We cannot speculate on the decrease in the light curve of the chromospheric lines for the time period 10:30 – 11:00 UT.
Chae et al. (1998), using SUMER data in Si iv 1402 Å and Big Bear Solar Observatory (BBSO) H spectrograph observations, found that chromospheric upflow events arising in intranetwork areas are related to transition region explosive events. Madjarska & Doyle (2002) studying high-cadence (10 s) data during explosive events in the chromospheric Ly 6 960.75 Å line (20 000 K) and the transition region S vi 933.38 Å (200 000 K) line found a time delay in the response of the S vi line with respect to the Ly 6 line, with Ly 6 responding 20-40 s earlier. That made the authors suggest heating from chromospheric to transition region temperatures, i.e. a chromospheric origin of explosive events. The complexity of the event(s) analyzed in the present work makes it impossible to temporally resolve the connection of cold and hot plasmas. It is also possible that the time resolution of the present data is not sufficient for such analysis.
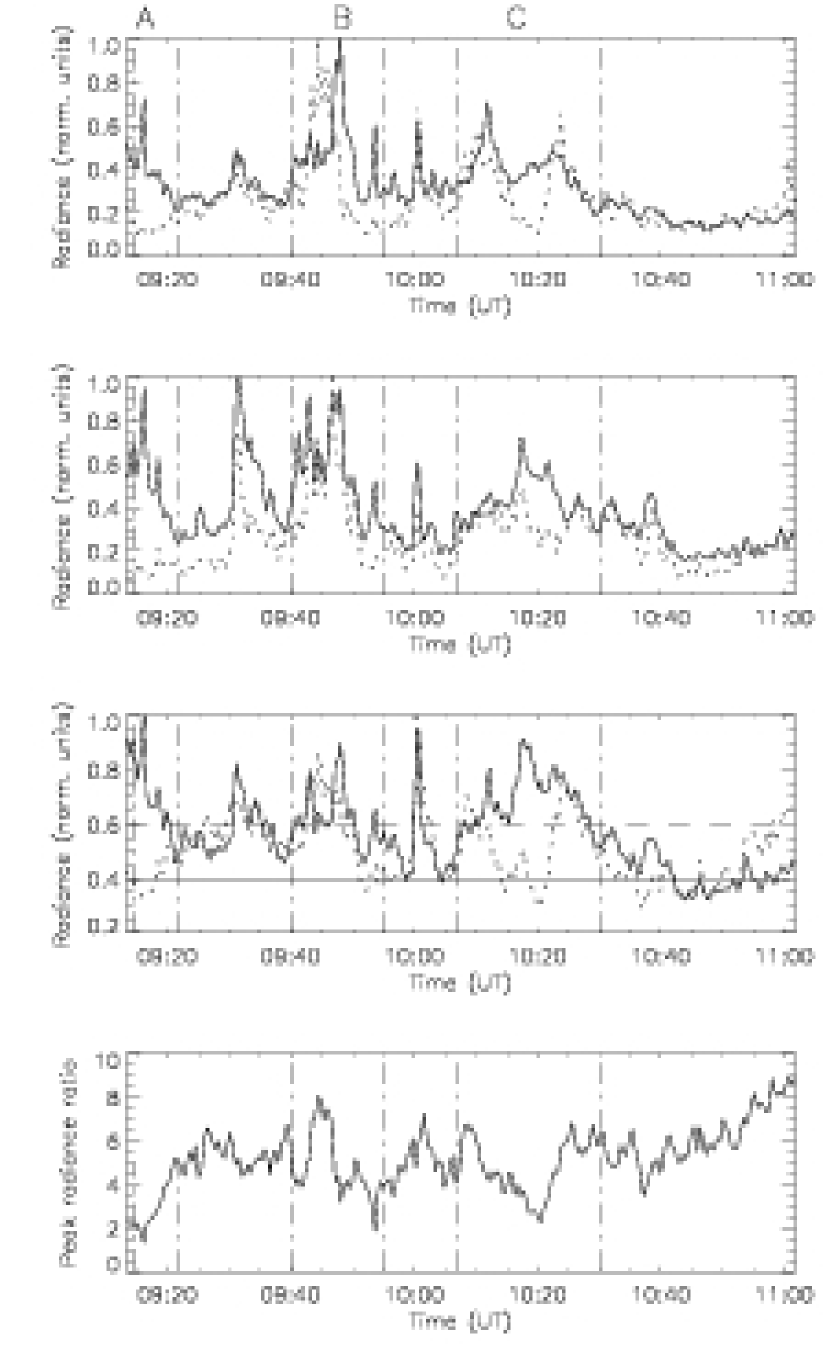
We examined in more detail a few selected time intervals, namely A, B and C from the light curves, in the different spectral lines (Fig. 5) as well as in the blue and red wings and the cores of the N v 1238 Å and O v 629 Å lines (Fig. 6). During the time interval A, we noticed only a signature of line radiance increases/broadenings in the chromospheric and the N v lines (see their corresponding light curves in Figs. 5 and 6). No response was registered in O v or TRACE 171 Å. In the time interval from 09:40 UT – 09:55 UT (B) – the ejection is first seen in N v and the chromospheric lines and 5 min later in O v. The H images around 09:44 UT show a narrow dark jet (Fig. 4, upper images). The peak of the O v emission corresponds to a decrease/plateau in the N v and the chromospheric lines with these lines increasing again after O v starts to decrease. A sudden rise in N v and the chromospheric lines just before 09:55 UT has no counterpart in the O v line. A strong brightening in the foot-point of the jet precedes its occurrence. This brightening was identified as an Ellerman bomb(s) and it is best seen first in H –350 mÅ and later also in H +350 mÅ. It is important to mention that a strong brightening is seen in the TRACE image at the same position (Fig. 4). This brightening lasted and evolved for around 30 min triggering a series of jets. The jets crossing the SUMER slit produced explosive events. To find out whether there is really a coronal response during the Ellerman bomb we studied the light curves of the CDS lines. The Mg ix 368 Å line (the blend by Mg vii was removed using a double Gauss fit) shows a significant radiance increase together with CDS O v 629 Å and He i 584 Å (Fig. 7). The changes correlated very well with the radiance variations of the TRACE emission from the same area. Section C (10:08 UT – 10:30 UT) displays first a strong blue shifted emission in N v trailed by O v. Then follows a strong red shifted emission in the N v and a more modest one in O v. That is followed by another strong rise in the blue wing and the core radiance of N v and O v. We found that the Ellerman bomb(s) occurs at around 10:00 UT as a sudden radiance increase in all CDS spectral lines and the TRACE (Fig. 7). At around 10:10 UT the SUMER spectral lines (Figs. 5 and 6) show a strong dynamics as described above corresponding to a plasma ejection triggered by the Ellerman bomb(s). This complex behavior of the spectral lines during A, B and C reflects a well know event - a surge (Newton, 1942).
A surge analyzed by Tziotziou et al.(2005), employing data from the Dutch Open Telescope (DOT) and TRACE 1600 Å, suggested that the temperature of the surge was in the region of to K, however, without access to additional data from higher temperatures, this was only an approximation. Here, we have data from O v 629 Å and N v 1238 Å, and TRACE 171 Å which suggests heating to coronal temperatures.
We performed an identification to see how many of the brightenings seen in the N v and O v lines (Fig. 2) can be categorized as blinkers. The radiance plots in Fig. 6 show several radiance increases over the threshold value (1.5 times the background emission) which can be categorized as blinkers. The blinkers, however, also have EEs characteristics as described above.
How can we explain the different behavior of N v and O v? Looking at Skylab data (Vernazza & Reeves, 1978), it can be seen that N v increases by a factor of 8 for an active region and 11.5 for a very active region, while the O v only increases by factors of 3.2 and 4.2 respectively. As noted by Doyle et al. (2005) these lines are density sensitive due to density dependent ionization/recombination. For example, considering density dependent ionization/recombination from metastable levels we get for electron densities above cm-3 that the N v line can be enhanced by almost a factor of two over that obtained using stage-to-stage ionization. Similar, the O v is reduced by almost a factor of two, therefore giving a factor of 3 difference in the response of N v and O v lines in high density plasmas. This, however, only applies to a plasma in ionization equilibrium. For a plasma which is undergoing rapid heating, these ratios are very different. For example, for a high-density plasma of to cm-3 at a temperature of logTe = 5.1 N v is at 70% of its peak while O v is only at 25% (see Fig. 4 in Doyle et al. 2005), hence the O v/N v ratio of the contribution functions is reduced by 3, very close to what is observed during the surge (see Fig. 6). More work is clearly needed in this area, for example, to address whether a plasma can be maintained for say several minutes at temperatures close to log Te = 5.1 in order to have these low O v 629 Å to N v 1238 Å line ratios. We present in Fig. 6 (bottom panel) the radiance ratio of O v versus N v during the surge.
An alternative explanation is absorption due to the Lyman continuum (Kanno et al., 1984), although others (Raymond & Doyle, 1981) suggest that the effect is minimal. In this case, an optical thickness is required to reduce the O v 629 Å line by a factor of two. There are, however, intervals where the O v 629 Å line is not reduced in intensity, which would imply a highly variable absorption, but without access to additional spectral lines we are unable to rule out Lyman absorption.
4 Conclusions
The present study demonstrates an inter-relation between a surge observed in H 6563 Å and SUMER explosive events registered at transition region temperatures. Although some parts of the surge are seen in the TRACE 171 Å images where the SUMER slit is positioned, the SUMER Mg x 625 Å does not show any response. The surge is triggered by Ellerman bombs occurring in the region where the surge originates from. We found that the Ellerman bombs reached temperatures of 1 MK from TRACE 171 Å and CDS Mg ix. They are believed to be the result of magnetic reconnection happening in the low chromosphere triggering a surge occurrence. With the present study we demonstrate that the division of small-scale transient events into a number of different subgroups, for instance explosive events, blinkers, spicules, surges or just brightenings, is ambiguous, implying that the definition of a feature based only on either spectroscopic or imaging characteristics as well as insufficient spectral and spatial resolution can be incomplete.
In the light of present findings, we believe that it is of great importance to examine in detail the inter-relation between different transient phenomena in the solar atmosphere using simultaneous Hinode and ground-based data. Hinode’s Extreme-ultraviolet Imaging Spectrometer (EIS) has presently the best capabilities to provide coronal spectral diagnostics. Equally, we believe that further exploration of these events by using Hinode and the forthcoming Solar Dynamic Observatory data is crucial for evaluating the contribution of these events to the coronal heating and slow solar wind generation.
References
- Alissandrakis et al. (1990) Alissandrakis, C. E., Tsiropoula, G. and Mein, P., 1990, A&A, 230, 200
- Bewsher et al. (2002) Bewsher, D., Parnell, C. E. and Harrison, R. A. 2002, Sol. Phys., 206, 21
- Brković & Peter (2004) Brković, A. and Peter, H. 2005, A&A, 422, 709
- Brueckner & Bartoe (la) Brueckner, G. E. and Bartoe, J.-D. F. 1983, ApJ, 272, 329
- Chae et al. (1998) Chae, J., Wang, H., Lee, C.-Y., Goode, P. R. and Schühle, U. 1998, ApJ, 497, L109
- Chae et al. (2000) Chae, J., Wang, H., Goode, P. R., Fludra, A. and Schühle, U. 2000, ApJ, 528, L119
- de Pontieu et al. (1999) de Pontieu, B., Berger, T. E., Schrijver, C. J. and Title, A. M. 1999, Sol. Phys., 190, 419
- Dere (1994) Dere, K. P. 1994, Advances in Space Research, 14, 13
- Doyle et al. (2003) Doyle, J. G., Dzifćáková, E. and Madjarska, M. S. 2003, Sol. Phys., 218, 79
- Doyle et al. (2004) Doyle, J. G., Roussev, I. I. and Madjarska, M. S. 2004, A&A, 418, L9
- Doyle et al. (2005) Doyle, J. G., Ishak, B., Ugarte-Urra, I., Bryans, P. and Summers, H. P. 2005, A&A, 439, 1183
- Doyle et al. (2006) Doyle, J. G., Popescu, M. D.., Taroyan, Y., 2006, A&A, 446, 327
- Ellerman (1917) Ellerman, F. 1917, ApJ, 46, 298
- Golub et al. (1989) Golub, L., Hartquist, T. W. and Quillen, A. C. 1989, Sol. Phys., 122, 245
- Handy et al. (1999) Handy, B. N., Acton, L. W., Kankelborg, C. C., et al. 1999, Sol. Phys., 187, 229
- Harrison (1997) Harrison, R. A. 1997, Sol. Phys., 175, 467
- Harrison et al. (2003) Harrison, R. A., Harra, L. K., Brković, A. and Parnell, C. E. 2003, A&A, 409, 755
- Innes et al. (1997) Innes, D. E., Inhester, B., Axford, W. I. and Willhelm, K. 1997, Nature, 386, 811
- Jiang et al. (2007) Jiang, Y. C., Chen, H. D., Li, K. J., Shen, Y. D. and Yang, L. H. 2007, A&A, 469, 331
- Kanno et al. (1984) Kanno, M., Suematsu, Y. and Nishikawa, T. 1984, Sol. Phys., 91, 71
- Madjarska & Doyle (2002) Madjarska, M. S. and Doyle, J. G. 2002, A&A, 382, 319
- Madjarska & Doyle (2003) Madjarska, M. S. and Doyle, J. G. 2003, A&A, 403, 731
- Madjarska et al. (2006) Madjarska, M. S., Doyle, J. G., Hochedez, J.-F. and Theissen, A. 2006, A&A, 452, L11
- Marik & Erdélyi (2002) Marik, D. and Erdélyi, R. 2002, A&A, 393, L73
- Newton (1942) Newton, H. W. 1942, MNRAS, 102, 2
- O’Shea et al. (2006) O’Shea, E., Banerjee, D. and Doyle, J. G. 2006, A&A, 452, 1059
- Pérez et al. (1999) Pérez, M. E., Doyle, J. G., Erdélyi, R. and Sarro, L. M. 1999, A&A, 342, 279
- Priest et al. (2002) Priest, E. R., Hood, A. W. and Bewsher, D. 2002, Sol. Phys., 205, 249
- Raymond & Doyle (1981) Raymond, J. C. and Doyle, J. G. 1981, ApJ, 247, 686
- Roy (1973) Roy, J.-R. 1973, Sol. Phys., 32, 139
- Suematsu et al. (1995) Suematsu, Y. , Wang, H. and Zirin, H.1995, ApJ, 450, 411
- Teriaca et al. (2002) Teriaca, L., Madjarska, M. S. and Doyle, J. G. 2002, A&A, 392, 309
- Tsiropoula & Scmieder (1997) Tsiropoula G. and Schmieder B., 1997, A&A, 324, 1183
- Tziotziou et al. (2005) Tziotziou, K., Tsiropoula, G. and Sütterlin, P. 2005, A&A, 444, 265
- Vernazza & Reeves (1978) Vernazza, J. E. and Reeves, E. M. 1978, ApJS, 37, 485
- Wilhelm et al. (1995) Wilhelm, K., Curdt, W., Marsch, E., et al. 1995, Sol. Phys., 162, 189
| Ion | Å | log(T)/K | Comment |
|---|---|---|---|
| N v | 1238.82 | 5.3 | |
| C i | 1249.00 | 4.0 | |
| O iv/2 | 1249.24 | 5.2 | blend |
| Si x/2 | 1249.40 | 6.1 | blend |
| C i | 1249.41 | 4.0 | |
| Mg x/2 | 1249.90 | 6.1 | blend |
| O iv/2 | 1250.25 | 5.2 | blend |
| P ii | 1249.81 | 4.2 | blend |
| Mg ii | 1249.93 | 4.1 | blend |
| Si ii | 1250.09 | 4.1 | blend |
| Si ii | 1250.41 | 4.1 | |
| C i | 1250.42 | 4.0 | blend |
| S ii | 1250.58 | 4.2 | |
| Si ii | 1251.16 | 4.1 | |
| C i | 1251.17 | 4.0 | blend |
| O iv/2 | 1251.70 | 5.2 | |
| C i | 1252.21 | 4.0 | |
| S ii | 1259.53 | 4.2 | blend |
| O v/2 | 1259.54 | 5.4 | |
| O va | 629.77 | 5.4 | |
| Mg viia | 368.057 | 5.8 | blend |
| Mg ixa | 368.070 | 6.1 | |
| He ia | 584.33 | 4.7 |