X-ray evidence for a mildly relativistic and variable outflow in the luminous Seyfert 1 galaxy Mrk 509
Abstract
Context. There is growing evidence for the presence of blueshifted Fe K absorption lines in a number of radio-quiet AGNs and QSOs. These may be fundamental to probe flow dynamics near supermassive black holes.
Aims. Here we aim at verifying and better characterising the existence of such Fe K absorption at 8-10 keV in the luminous Seyfert 1 galaxy Mrk 509, one of the most promising target for these studies.
Methods. We present a comprehensive spectral analysis of the six XMM-Newton observations of the source (for a total of 200 ks), focusing on the detailed and systematic search for absorption features in the high-energy data.
Results. We detect several absorption features at rest-frame energies 8-8.5 keV and 9.7 keV. The lines are consistent with being produced by H-like iron K and K shell absorptions associated with an outflow with mildly relativistic velocity of 0.14–0.2 c. The lines are found to be variable in energy and, marginally in intensity, implying that variations in either the column density, geometry and/or ionization structure of the outflow are common in this source.
Key Words.:
Galaxies: active – X-rays: galaxies – Galaxies: individual: Mrk~5091 Introduction
There is compelling evidence for the presence of blueshifted Fe absorption lines at rest-frame energies of 7-10 keV in the X-ray spectra of several radio-quiet (RQ) AGNs and QSOs. These are commonly interpreted as due to resonant absorption from FeXXV and/or FeXXVI ions associated to a zone of circumnuclear gas with log 2-4 erg s-1 cm and column density 1022-24 cm-2 (see Cappi 2006 and references therein), i.e. significantly higher than the absorption layers commonly associated to warm absorbers (Crenshaw et al. 2003, Blustin et al. 2005).
The velocities of these absorbers being often quite large, reaching sometimes mildly relativistic speeds (up to 0.2-0.4 c), suggest we might be probing the extreme component of a wind/outflow that may well carry large amount of mass into the interstellar medium (ISM) and/or intergalactic medium (IGM) at a rate comparable to, or even larger than the Eddington accretion rate (King and Pounds 2003, Reeves et al. 2003, Chartas et al. 2003, Pounds & Page 2006).
Most interestingly, variability of the absorption on timescales down to a few ks has been found among some sources (Risaliti et al. 2005, Dasgupta et al. 2005, Braito et al. 2007, Turner et al. 2007, Reeves et al. 2008, Saez et al. 2009, Giustini et al., in prep.). Variability studies could, in principle, allow us to estimate the location and geometry of the absorber (Nicastro et al. 1999, Krongold et al. 2007, Risaliti et al. 2005, Reeves et al. 2008), thereby placing more stringent limits to the remaining large (order of magnitude) uncertainties in the total mass, energy and momentum that is driven by these outflows (Elvis 2006).
Overall, these studies are fundamental to probe and characterise the most extreme (in terms of velocity, ionization state, mass outflow rate) phases of outflows, so helping in quantifying the potential feedback impact of AGNs onto their host galaxies and the IGM.
Mrk 509 (z=0.034) is one of the X-ray brightest (2–10 keV flux of 2–5 erg cm-2 s-1) and most luminous (L2-10keV erg/s) Seyfert 1 galaxy known. It is an interesting science case for these studies because a previous study by Dadina et al. (2005), based on BeppoSAX multiple observations and on two early XMM-Newton observations, found a transient and blueshifted absorption line at a rest-frame energy of 8.2 keV. In addition, a transient, redshifted, absorption line at a rest-frame energy of 5.4 keV was found. Motivated by these results, additional monitoring of the source with XMM-Newton was then proposed and eventually performed. Here we present the results on the systematic search and characterization of Fe absorption lines at high energies obtained from a comprehensive analysis on the full set of six XMM-Newton observations111Results on the Fe emission line properties, for the same dataset, were presented in Ponti et al. 2009..
2 Data Analysis and Results
Mrk 509 was observed by the XMM-Newton EPIC instruments on six separate occasions, for a total good exposure time of 280 ks (see Table 1). The observations were performed once in October 2000, once in April 2001, three times in October 2005, and once in April 2006. The only contiguous observations were those performed in 2005. The data were reduced using the standard software SAS v. 8 (de la Calle & Loiseau N., 2008) and the analysis was carried out using the HEASoft v. 6.5 package222http://heasarc.gsfc.nasa.gov/docs/software/lheasoft/. After filtering for times of high background rate, the useful exposure times, corrected for the live time fraction (up to 0.7 for the pn in small window mode), were between 2.7 and 60 ks per observation (see Table 1). The EPIC pn and MOS camera were all operated in the “Small Window” mode with the thin filter applied for all observations. We checked that pile-up was not significant in the pn data at this level of source flux, even when considering both single and double events. The pile-up fraction for the MOS data was 15% for all observations. Also in this case, this will not affect the results on the narrow absorption lines presented in this work. Source counts were extracted from a circular region of radius 40 arcsec, while the background counts were extracted from a nearby source-free area of the detector of the same size. Given the significantly lower effective area of the MOS detector between 6-10 keV, and for sake of clarity and simplicity, we only report here the results obtained from the pn data and show the MOS data for consistency checks only. We decide also not to report here on the observation n. 3 because its very short exposure (2.7 ks; see Table 1) hampered any significant and interesting result.
| N∘ | Obs. ID | Date | Expo | Counts |
|---|---|---|---|---|
| (2-10 keV) | ||||
| (ks) | () | |||
| 1 | 0130720101 | 2000 Oct 25–25 | 20.7 | 7 |
| 2 | 0130720201 | 2001 Apr 20–20 | 23.1 | 10 |
| 3 | 0306090101 | 2005 Oct 16–16 | 2.7 | 1.1 |
| 4 | 0306090201 | 2005 Oct 18–19 | 59.8 | 25 |
| 5 | 0306090301 | 2005 Oct 20–20 | 32.4 | 14 |
| 6 | 0306090401 | 2006 Apr 25–26 | 48.6 | 23 |
Number, Observation ID, Observation date, net EPIC pn exposure time, and total 2–10 keV counts for the six XMM-Newton observations of Mrk~509.
2.1 Light-curves
Analysis of the soft and hard X-ray light curves from the six observations indicates only moderate (20-30%) flux and spectral variability on both short ( few tens ks) and long (years) time-scales (see lightcurve in Figure 1 of Ponti et al. 2009). A more detailed time-resolved spectral analysis focused on the low-energy warm absorber as measured by the RGS is deferred to a specific paper (Detmers et al., in preparation).
2.2 X-ray Continuum and Fe Emission Lines
Given the weakly varying continuum, we extracted the mean pn spectra for each of the six observations, grouping the data to a minimum of 25 counts per channel to apply the minimization statistics. Only the data in the 3.5–10.5 keV interval were considered, and the signal-to-noise ratios, even at 10 keV, were always greater than 12 (pn) and 6 (MOS). The spectra were first fitted with a single power-law model plus a column density with value fixed at the Galactic one ( cm-2, Dickey & Lockman 1990). We checked that the addition of a further neutral absorption component intrinsic to the source was not required by the data. We obtained good fits of the continuum with a typical power-law photon index of , but residuals of the data (Fig. 1, top panel) clearly showed the presence of a neutral Fe K emission line at the rest frame energy of 6.4 keV. We therefore added a Gaussian emission line to the model. The line was slightly resolved (see also Ponti et al. 2009), and we fixed the width to its best-fit value of 100 eV. Best-fit values with this simple model are reported in Table 2, with errors quoted at the 90% confidence level. The fit improvement was of and the equivalent width of the emission line of the order of 60–80 eV for all the observations.
| N∘ | Energy1 | EW2 | Flux3 | |||
|---|---|---|---|---|---|---|
| (keV) | (eV) | |||||
| 1 | 3.0 | 61 | ||||
| 2 | 3.8 | 42 | ||||
| 4 | 3.5 | 130 | ||||
| 5 | 3.6 | 67 | ||||
| 6 | 4.2 | 101 |
(1) Emission line rest-frame energy centroid, in units of keV; (2) Emission line rest-frame equivalent width, in units of eV.
The width of the line was fixed to =0.1 keV (see text for details); (3) 2–10 keV flux in units of
10-11 erg s-1 cm-2
In a few observations (namely observations 4, 5 and 6) we found additional weak, but significant,
residuals blueward of the 6.4 keV due to presumably Fe K emission plus higher ionization iron
emission components. Indeed, using this same dataset, together with a 100 ks Suzaku observation that
was partially (for 25 ks) overlapping the observation n. 6, Ponti et al. (2009) have shown in a companion paper
that this emission could be well reproduced by a broad line from an accretion disc, while it cannot be
easily described by scattering or emission from photo-ionized gas at rest.
We did not investigate nor consider further these emission structures here, since the primary aim of the present
work is to perform a detailed search for absorption lines at energies above 7 keV.
We checked nevertheless that different parameterizations and/or modelling of the complex
Fe emision line structure, including the above weak ionized components, do not affect
the results and conclusions presented here.
2.3 Fe Absorption Lines
Dadina et al. (2005) reported the detection of both red- and blue-shifted absorption lines due to highly ionized Fe in the BeppoSAX and XMM-Newton (non-simultaneous) spectra of Mrk 509. These lines were found at rest-frame energies of 5.5 keV and 8.2 keV, respectively. The first was seen in two BeppoSAX observations, the latter was seen by both satellites. Motivated by these results, we performed a systematic and blind search of absorption structures in the 4–10 keV band for the whole XMM-Newton dataset available to date.
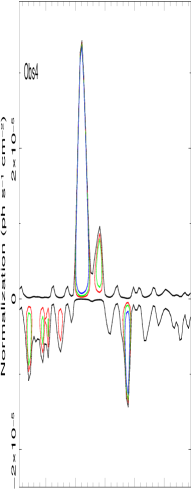
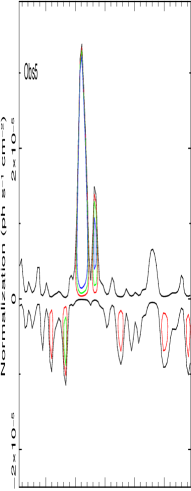
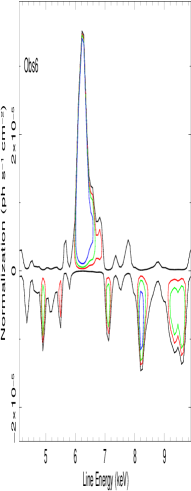
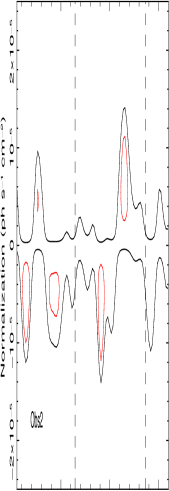
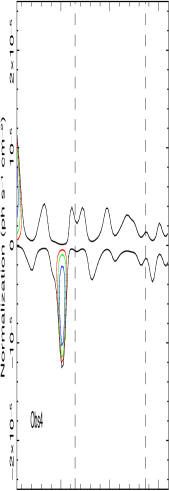
We first fitted the 3.5–10.5 keV data with a simple power-law model and searched for deviations in the , as shown in the first and second panels of Figure 1 for observation 1. We then implemented a more systematic method to search for features in the spectrum, similar to the one introduced by Miniutti & Fabian (2006) and Miniutti et al. (2007). We fitted the 3.5–10.5 keV data with the baseline power-law only (panel 3) or with the power-law plus Gaussian emission line model (panel 4) obtained in §2.2, stored the resulting value, and then freezed the baseline model parameters to their best-fit values. We then added a narrow (unresolved, keV) Gaussian line to the model, and then searched for the presence of both emission and absorption features by making a series of fits stepping the new Gaussian line energy in either the 4–10 keV or 7–10 keV intervals and its normalization between and ph s-1 cm-2, each time storing the new value. We then derived a grid of values and made a plot of the contours with same level with respect to the baseline model fit. Negative values calculated in this way indicate that a better fit is reached with the inclusion of the line and – like in the standard steppar type of contours in XSPEC,– the values can be translated in a statistical confidence level for the addition of 2 more parameters, as these do not depend on the sign but only on the absolute value of . We then plot the standard values of =-2.3, -4.61 and -9.21 relative to confidence levels of 68%, 90% and 99%, respectively. The major difference between these contours and the standard ones obtained with the steppar command in XSPEC, is that the contours are here “inverted” in the sense that inner contours include higher significance than outer ones. These contours are shown in panel 3 and 4 of Figure 1, for observation 1, as well as in Figures 2 and 3, for all the observations.

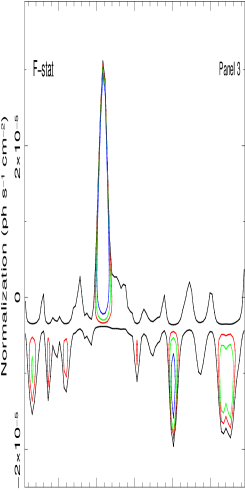
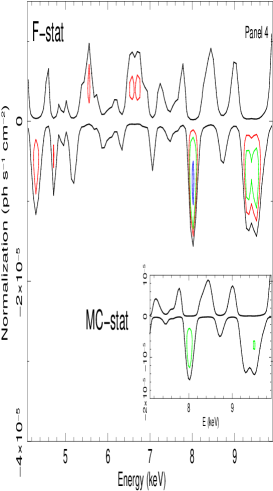
The probability levels shown in Figure 1 are derived from F-test only statistics, and do not take into account the number of trials used by our line blind search technique approach (e.g. Protassov et al. 2002). This might result in an overestimation of the statistical significance associated with each line feature. For this reason, contours derived with a method based on Monte Carlo simulations are shown for observation 1, in the inset of panel 4 of Figure 1. We address issues and results from this method further in §2.4 below.
As for the redshifted absorption structures, we noted the presence in the data of weak deviations between 4 and 6 keV (see the residuals redward of the FeK emission line in Figure 2). After inclusion of the neutral FeK emission line in the fit, we found that none of these absorption features is, however, statistically significant with upper-limits for an absorption line in that energy range of EW-15 eV (90% confidence). We did not confirm therefore the two positive BeppoSAX detections of the redshifted absorption line but are still consistent with a scenario where the absorber is transient and/or patchy in nature, as proposed in Dadina et al. (2005).
| N | Ea | EWa | F-test | MCb | Id | v/c | |
|---|---|---|---|---|---|---|---|
| obs. | (keV) | (eV) | (FeXXVI) | ||||
| 1 | 9.6 | 99% | 95% | K | 0.1720.005 | ||
| 8 | 98.5% | 87.5% | K | 0.1620.009 | |||
| 2 | 8.29c | ||||||
| 9.74c | |||||||
| 4 | 16.5 | 99.9% | 99.8% | K | 0.1410.003 | ||
| 9.74c | … | … | … | ||||
| 5 | 8.29c | ||||||
| 9.74c | |||||||
| 6 | 10.2 | 99.5% | 95.5% | K | 0.1960.005 | ||
| 7 | 98% | 78% | K |
(a) Rest-frame energy. Errors are quoted at the 90% and 68% confidence for the first and second lines,
respectively.
(b) Significance calculated through Monte Carlo simulations. (c) Values frozen at the best-fit values obtained during obs. 1.
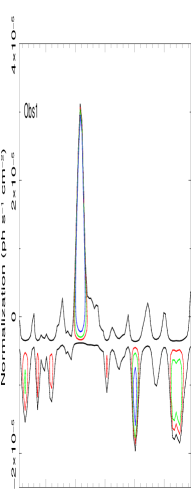
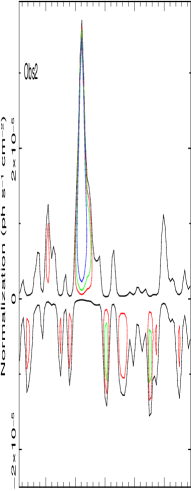
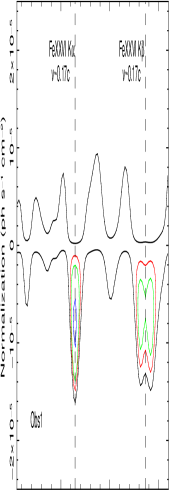
As for the blueshifted absorption structures, we find instead several in the data. Not only the previous XMM-Newton detection during observation 1 by Dadina et al. (2005) is confirmed, but the line is detected at a high significance level (see Table 3, and Figures 2 and 3) also during observations 4 and 6 (at E8.2, 8.0 and 8.4 keV, respectively). In addition, there is evidence during both observations 1 and 6 that an additional absorption line, possibly broader or maybe due to a blend of lines is present at even higher energies, at E9.4 keV (observed frame), i.e. 9.7 keV (rest-frame). Confidence contours for these absorption lines are shown in Figures 2 and 3. We report in Table 3 the best-fit parameters for these lines, as well as the significance of their detections, calculated with the F-statistics (column 5) and the Monte Carlo simulations (column 6).
Remarkably, the two sets of two lines are consistent with the theoretical energy peaks of FeXXVI K (6.966 keV) and K (8.268 keV), if blueshifted with respect to the systemic velocity by v0.17c (obs. 1) and v0.2c (obs. 6), respectively. The line at 8 keV during obs. 4 is consistent with Fe XXVI K at v0.14c. If the lines were associated, instead, with FeXXV K (6.697 keV) and K (7.880 keV), the requested velocity shifts would be consequently larger (i.e. v=0.21, 0.18 and 0.23 c for obs. 1, 4 and 6, respectively).
We also checked the MOS results for consistency with the pn instrument. Remarkably, despite the considerably lower statistics for the MOS (due to the much lower effective area at E7 keV), we found evidence, albeit with lower significance, of absorption features in all three observations 1, 4 and 6 and with energies and intensities consistent with the pn. In particular, we found statistical improvements by =13, 5 and 3, for the addition of a line at E8.2, 8.0 and 8.4 keV, with EW-6730 eV, -2423 eV, and -1716 eV (at 90% confidence for one additional d.o.f.), respectively. These results suggest these lines are not statistical fakes (but see also §2.4).
The pn background spectrum is known to have two instrumental emission features, one at observed energy of 7.5 keV due to a Ni K emission line and one at 8 keV due to a Cu K emission line (Katayama et al. 2004, Freyberg et al. 2004). These may have a strong impact on the source high-energy spectrum. We checked however that this is not the case for Mrk 509. The source is so bright (F(2-10 keV)210-11erg cm-2s-1) that the background level was always negligibly small, even in the FeK bandpass and for both pn and MOS (see Figure 4), thereby excluding a possible artifact due to the instrumental background.
During observations 2, 4 (for the 9.7 keV line) and 5 where the features were not detected, we obtained upper-limits on the absorption lines at energies of E8.3 and 9.7 keV, with EW-15 and -30 eV, respectively (see Table 3).

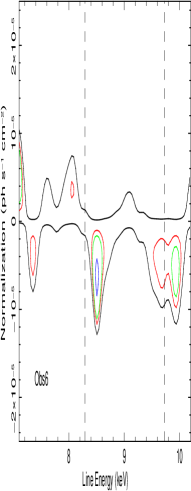


Finally, there are indications that the lines do vary among the observations (see Figure 3, where contours are plotted at rest-frame energies), clearly in blueshift/energy (being 0.17c, 0.14c and 0.20c during obs. 1, 4 and 6 respectively) and possibly in intensity, since they were not detected during observations 2 and 5. In particular, albeit marginal, the intensity variations are found on a time-scale as short as 100 ks, i.e. the time encompassed between obs. 4 and 5, but one should recall the intrinsic difficulty to place here stringent upper-limits on the EW of lines for which the velocity is unknown a-priori. The line velocity variations are instead unambiguous (see Figure 3), on a time-scale of 6 months, i.e. the time encopassed between obs. 4 and obs. 6. Given the mass of the black hole in Mrk 509 of Mbh 1.4 0.1 108 M⊙ (Peterson et al. 2004), such variability time-scales suggest the presence of important radial or transverse motions quite close to the central supermassive black hole as discussed below.
2.4 On the statistical significance of the absorption lines
The F-test detection probabilities derived here (see Table 3) from our line blind search can be overestimates of their real values (e.g. Protassov et al., 2002). We therefore applied a more rigorous method that uses extensive Monte Carlo simulations (see e.g. Porquet et al. 2004; Miniutti & Fabian 2006; Markowitz et al. 2006) in order to assess the detection probabilities from our line blind search. For all three cases in which one or two lines have been detected (i.e. observations 1, 4 and 6) we considered the absorbed power law plus narrow Gaussian emission line as the null-hypothesis model.
We simulated a null-hypothesis model spectrum with the same exposure as
the real data and subtracted the appropriate background.
This spectrum was fitted again with the null-hypothesis model in
the 3.5–10.5 keV band and the new parameters were recorded. Then,
we generated a new simulated spectrum with this refined null-hypothesis
model in order to account for the uncertainties in the model itself.
Therefore, we made a fit of the null-hypothesis model to this new
simulated spectrum, considering only the 3.5–10.5 keV band and recorded
the value. We then added a narrow Gaussian line ( keV)
to the model, with its normalization free to be positive or negative
and stepped the centroid energy between 7 and 10 keV at intervals of 100 eV.
Each time we made a new fit and recorded the maximum of these
simulated .
Then, we repeated the above procedure times in order to
generate a distribution of simulated values. If
simulated values were greater or equal to the real one, then the
detection confidence level corresponds to .
The new values of line detection confidence levels based on the above Monte Carlo simulations are reported in Table 3, in comparison to the F-test probabilities. We also estimated the combined Poissonian probability of detecting by chance the 3 absorption lines (at E8-8.5 keV) in 5 observations, and this turned out to be 0.001 (i.e. a probability 99.9% that these lines are not fake). Considering also the two lines at E9.7-9.8 keV, and that they turn out to be at the expected energies for K transitions (i.e. the F-statistics alone should properly work for these), would lower the combined probability even further. For example, a fit with the two lines (FeXXVI K and K) with their energies freezed at their theoretically expected values, and same blueshifted velocity, yielded a improvement of 19 and 13, for 3 interesting parameters, corresponding to a probability of 99.9% and 99.5% during observations 1 and 6, respectively.

3 Discussion and Conclusions
The main results of our spectral analysis are the following:
-
•
We detected several absorption features in the energy range 8-10 keV in three (out of six) XMM-Newton observations of the bright and luminous Seyfert 1 galaxy Mrk 509. The equivalent widths of the lines are in the range between -20 and -60 eV.
-
•
The most likely identification for these features being FeXXVI K and K, they imply (mildly) relativistic blueshifts in the range 0.14-0.2c, and low K/K ratios, of the order of unity.
-
•
There is evidence for line velocity variations, as well as for appearance and disappearance of the lines, on time-scales as short as 100 ks.
The above results are reminiscent of the Seyfert 1.5 NGC1365 (Risaliti et al. 2005), in particular for i) the identification of the absorption lines with FeXXVI K and K lines, ii) the small K/K ratios, and iii) the velocity variations detected on similarly short time-scales for a comparable black hole mass. Differences are that here we only detect one ionization state for iron (instead of two, FeXXV and FeXXVI, for NGC1365), and the line velocities are here about ten times larger than in NGC1365. As shown below, this could be due to an intrinsically more extreme outflow in Mrk 509 with respect to NGC1365, in terms of either velocity or ionization state, or both. Alternatively, the structure and velocity field of radiatively-driven winds being a function of the polar angle (e.g. Proga & Kallman 2004), a different viewing angle as expected for their type 1 (for Mrk509) and type 2 (NGC1365) classification would naturally imply different average velocities along the line of sight.
Outflowing material is expected to imprint a characteristic P-Cygni profile in the data, where the detailed absorption and re-emission line profile depends strongly on the flow/wind geometry and density. Theoretical predictions based on Monte Carlo calculations have been presented in, e.g., Schurch & Done (2007) and Sim et al. (2008), with some recent attempts to fit the best available observational data (Sim et al. 2008, Pounds & Reeves 2008). Rather than attempting here such a full treament and modelling of the absorber with data of admittedly too low statistics for such a purpose, we discuss the above results in the light of simpler and more qualitative arguments.
Following Risaliti et al. (2005) and from the curves of growth presented in Bianchi et al. (2005), an equivalent width of the K lines EW20-30 eV can be obtained with N5 1023 cm-2 and log4 erg cm s-1, with turbulent velocity set to zero. With larger values of turbulence, i.e. velocities between 100 and 1000 km/s, the column density needs not to be as large, with values of N5-101022 cm-2. These values would also be consistent with the low K/K ratios, which indicate that saturation effects are significant (see Figure 4 in Risaliti et al. 2005). Given the low statistics available, velocity widths as large as a few thousands km/s, i.e. consistent with the above estimates, can not be excluded here. Such high values of turbulence would also be reasonable for bulk motions in an outflow with such large velocities.
These rough estimates were then confirmed through a more detailed, but still approximate, fitting of the FeK absorption lines with two different phenomenological models: zxipcf, a partial covering of photo-ionised absorbing material that is incorporated into the XSPEC package (Reeves et al 2008), and XSTAR tables calculated using an input SED with a power-law photon index of =2 and a turbulent velocity of 1000 km/s. We obtained good and consistent fits to the data. For all three observations (obs. 1, 4 and 6), the best-fit parameter values were log50.4 erg cm s-1, N2-41023 cm-2 and a blueshift of v0.14-0.2c. Best-fit models obtained with the XSTAR photoionization model are shown in figure 5. In these models, the lines are produced by only FeXXVI (K and K) and, despite the large columns, no other signature is expected at lower energies because of the extremely large ionization.
Another possible solution, albeit slightly statistically worse, could also fit the EPIC data with less extreme values of N1022-23 cm-2 and log3 erg s-1 cm. In this case, the absorption lines are identified with mainly FeXXV. This solution does, however, require even larger velocities up to 0.18-0.23c. Moreover this solution appears to be slightly fine-tuned because a slightly lower value of would imply a significant low-energy curvature and a higher value of would give rise to lines from also FeXXVI. We also checked but did not find any evidence in the RGS data of OVIII absorption lines at the above mentioned velocities, the data yielding quite stringent limits of EW0.2-0.4 eV. Altogether, this solution appears to be less likely than the one based on FeXXVI “only” and was thus not considered any further here.
The high ionization parameter, together with the variations seen in the absorption lines can be used to infer limits on the distance and size of the absorber. Assuming that the ionization state is due to illumination from the central X-ray and UV source, rather than heated/illuminated locally, we can use =/(nr2), where n is the number density, the source continuum luminosity (integrated between 1 and 1000 Rydberg) to estimate the maximum distance of the absorber from the illuminating source. The observed line-of-sight absorbing column is a function of the density n of the material at a ionisation parameter and the shell thickness : . Making the reasonable assumption (given the r dependencies of winds/outflows) that the thickness is less than its distance from the source , and combining the expression for the ionisation parameter, we obtain the limit . Using =21044 erg/s, =1023 cm-2 and log5 erg cm s-1, we obtain r 21016 cm. Assuming the black hole mass of Mbh = 1.4 108 M⊙ (Peterson et al. 2004) for Mrk 509, this corresponds to a location for the absorber within a distance 500 Schwarzschild radii (rs) from the black hole.
Interestingly, we note that the variability of the absorption lines is indicative of a compact absorber and rules out a local origin, from either the Galaxy or the Local Group, for the absorber (McKernan et al. 2004, 2005). In fact the absorber appears to be even more compact than the broad line region which has an estimated size of the order of 80 light-days (Kaspi et al. 2005). Analogous short term variability of iron absorption lines velocity and intensity was recently found for the BAL QSO APM 08279+5255 (Saez et al. 2009), suggesting that rapid changes in the geometry of the outflow and/or of physical parameters of the absorber are a fundamental characteristic of the X-ray component of AGN winds.
A rough estimate of the escape velocity along the distance of a Keplerian disk is given by the equation , which can be written as . The observed blueshift velocity of the absorber v0.14-0.2c is therefore much larger than the escape velocity at 500 rs, of the order of 0.05c, as well as the escape velocity at 100 rs, that is 0.1c. Assuming a constant velocity for the outflow and the conservation of the total mass, we can thus estimate the mass loss rate associated to this outflow as , where is the outflow velocity, n is the ion number density of the absorber, is the proton mass and is the covering fraction of the outflow. Following Blustin et al. 2005, this translates to 1.23 , i.e. for Mrk509, to 2.4 (/4) M⊙ yr-1, with the flow velocity in units of 0.1 c. This corresponds then to a kinetic power of 6.7 1044 (/4) 3 erg s-1 that could be injected into the ISM.
Following McKernan et al. (2007), we can derive a simple relation for the ratio between the mass outflow rate and the rate of the accretion flow, i.e. / 6000 (/4)(/), where is the absorber covering fraction, is the ionization parameter in units of 100 erg cm s-1 and =0.1 is the accretion efficiency of the black hole. For Mrk 509, this relation yields / 10 (/4), implying either a low covering fraction and/or an intermittent outflow to permit the growth of the black hole. Viceversa, even a moderately large covering factor for the ouflow would imply significant and energetically relevant mass losses into the ISM.
The high velocity, high ionization and variability properties of this absorber suggest that it may be associated with an outflow launched by an accretion disk at relatively small radii of less than a few hundred Scwarzshild radii. This adds to the long and well known evidence from the soft X-rays of a multi-phase warm absorber in Mrk 509 with log0.9-3.26 and 0.8-5.81021 cm-2 (Smith et al. 2007,), and to the “intermediate” (log5.4, 5.81022 cm-2 and v0.05c) absorption component found by Ponti et al. (2009) based on continuum variability arguments. Overall, Mrk 509 shows compelling evidence for a stratified absorber, as those predicted by hydrodynamical simulations of radiatively and/or magnetically driven outflows (Proga 2003, Proga & Kallman 2004, King & Pounds 2003, Murray et al. 1995), but with ionizations and velocities up to extreme and challenging values. The extreme ionization parameter raises the question as to how much more fully ionised matter is included, but undetected yet, in the outflow, with its implications for the outflow mass-loss rates and energetics.
Finally, the frequency in AGNs of such extreme outflows is to date unclear. Proper statistical studies on larger, complete, samples are being performed (Tombesi et al., in preparation). They are needed to secure the statistical significance of these features, and to assess their frequency and typical characterisation in terms of density, velocities, ionization states and covering factor. Unfortunately current available data do suffer an “observational bias” against the detection of the highest-velocity blueshifted features in that orbiting X-ray telescopes are of limited spectral and sensitivity capabilities at E7 keV. Future missions such as will likely allow an exciting step forward in studying mildly relativistic outflows in AGNs, as demonstrated by the first attempted simulations (Cappi et al. 2008, Tombesi et al. 2008).
Acknowledgements.
This paper is based on observations obtained with the XMM-Newton satellite, an ESA funded mission with contributions by ESA Member States and USA. We would like to thank the referee K. Pounds for his constructive suggestions. We thank A. De Rosa for usefull discussions. MC, MD and GP acknowledge financial support from ASI under contracts ASI/INAF I/023/05/0 and I/088/06/0. GP aknowledges ANR for support under grant number ANR-06-JCJC-0047.References
- Bianchi et al. (2005) Bianchi, S., Matt, G., Nicastro, F., Porquet, D., & Dubau, J. 2005, MNRAS, 357, 599
- Blustin et al. (2005) Blustin, A. J., Page, M. J., Fuerst, S. V., Branduardi-Raymont, G., & Ashton, C. E. 2005, A&A, 431, 111
- Braito et al. (2007) Braito, V., et al. 2007, ApJ, 670, 978
- Cappi (2006) Cappi, M. 2006, Astronomische Nachrichten, 327, 1012
- Cappi et al. (2008) Cappi, M., Tombesi, F., & Giustini, M. 2008, Memorie della Societa Astronomica Italiana, 79, 123
- Chartas et al. (2003) Chartas, G., Brandt, W. N., & Gallagher, S. C. 2003, ApJ, 595, 85
- Crenshaw et al. (2003) Crenshaw, D. M., Kraemer, S. B., & George, I. M. 2003, ARA&A, 41, 117
- Dadina et al. (2005) Dadina, M., Cappi, M., Malaguti, G., Ponti, G., & de Rosa, A. 2005, A&A, 442, 461
- Dasgupta et al. (2005) Dasgupta, S., Rao, A. R., Dewangan, G. C., & Agrawal, V. K. 2005, ApJ, 618, L87
- (10) de la Calle & Loiseau N., 2009, ”User Guide to the XMM-Newton Science Analysis System, Issue 5.0”, (http://xmm.esac.esa.int/external/xmm_user_support/documentation/sas_usg/USG/).
- Dickey & Lockman (1990) Dickey, J. M., & Lockman, F. J. 1990, ARA&A, 28, 215
- Elvis (2006) Elvis, M. 2006, Memorie della Societa Astronomica Italiana, 77, 573
- Freyberg et al. (2004) Freyberg, M. J., et al. 2004, Proc. SPIE, 5165, 112
- Kaspi et al. (2005) Kaspi, S., Maoz, D., Netzer, H., Peterson, B. M., Vestergaard, M., & Jannuzi, B. T. 2005, ApJ, 629, 61
- Katayama et al. (2004) Katayama, H., Takahashi, I., Ikebe, Y., Matsushita, K., & Freyberg, M. J. 2004, A&A, 414, 767
- King & Pounds (2003) King, A. R., & Pounds, K. A. 2003, MNRAS, 345, 657
- Krongold et al. (2007) Krongold, Y., Nicastro, F., Elvis, M., Brickhouse, N., Binette, L., Mathur, S., & Jiménez-Bailón, E. 2007, ApJ, 659, 1022
- Markowitz et al. (2006) Markowitz, A., Reeves, J. N., & Braito, V. 2006, ApJ, 646, 783
- McKernan et al. (2004) McKernan, B., Yaqoob, T., & Reynolds, C. S. 2004, ApJ, 617, 232
- McKernan et al. (2005) McKernan, B., Yaqoob, T., & Reynolds, C. S. 2005, MNRAS, 361, 1337
- McKernan et al. (2007) McKernan, B., Yaqoob, T., & Reynolds, C. S. 2007, MNRAS, 379, 1359
- Miniutti & Fabian (2006) Miniutti, G., & Fabian, A. C. 2006, MNRAS, 366, 115
- Miniutti et al. (2007) Miniutti, G., Ponti, G., Dadina, M., Cappi, M., & Malaguti, G. 2007, MNRAS, 375, 227
- Murray et al. (1995) Murray, N., Chiang, J., Grossman, S. A., & Voit, G. M. 1995, ApJ, 451, 498
- Nicastro et al. (1999) Nicastro, F., Fiore, F., Perola, G. C., & Elvis, M. 1999, ApJ, 512, 184
- Peterson et al. (2004) Peterson, B. M., et al. 2004, ApJ, 613, 682
- Ponti et al. (2009) Ponti, G., et al. 2009, MNRAS, 236
- Porquet et al. (2004) Porquet, D., Reeves, J. N., Uttley, P., & Turner, T. J. 2004, A&A, 427, 101
- Pounds & Page (2006) Pounds, K. A., & Page, K. L. 2006, MNRAS, 372, 1275
- Pounds & Reeves (2008) Pounds, K. A., & Reeves, J. N. 2008, arXiv:0811.3108
- Proga (2003) Proga, D. 2003, ApJ, 592, L9
- Proga & Kallman (2004) Proga, D., & Kallman, T. R. 2004, ApJ, 616, 688
- Protassov et al. (2002) Protassov, R., van Dyk, D. A., Connors, A., Kashyap, V. L., & Siemiginowska, A. 2002, ApJ, 571, 545
- Reeves et al. (2003) Reeves, J. N., O’Brien, P. T., & Ward, M. J. 2003, ApJ, 593, L65
- Reeves et al. (2008) Reeves, J., Done, C., Pounds, K., Terashima, Y., Hayashida, K., Anabuki, N., Uchino, M., & Turner, M. 2008, MNRAS, 385, L108
- Risaliti et al. (2005) Risaliti, G., Bianchi, S., Matt, G., Baldi, A., Elvis, M., Fabbiano, G., & Zezas, A. 2005, ApJ, 630, L129
- Saez et al. (2009) Saez, C., Chartas, G., & Brandt, W. N. 2009, arXiv:0903.2878
- Schurch & Done (2007) Schurch, N. J., & Done, C. 2007, MNRAS, 381, 1413
- Sim et al. (2008) Sim, S. A., Long, K. S., Miller, L., & Turner, T. J. 2008, MNRAS, 388, 611
- Smith et al. (2007) Smith, R. A. N., Page, M. J., & Branduardi-Raymont, G. 2007, A&A, 461, 135
- Tombesi et al. (2008) Tombesi, F., Cappi, M., Ponti, G., Malaguti, G., & Palumbo, G. G. C. 2008, Memorie della Societa Astronomica Italiana, 79, 281
- Turner et al. (2007) Turner, T. J., Miller, L., Reeves, J. N., & Kraemer, S. B. 2007, A&A, 475, 121