High-Resolution Panchromatic Spectral Models of Galaxies including Photoionisation and Dust
Abstract
An updated version of the dust radiation transfer code sunrise, including models for star-forming regions and a self-consistent calculation of the spatially dependent dust and PAH emission, is presented. Given a hydrodynamic simulation of a galaxy, this model can calculate a realistic 2-dimensional ultraviolet–submillimeter spectral energy distribution of the galaxy, including emission lines from H ii regions, from any viewpoint. To model the emission from star-forming regions, the mappingsiii photoionization code is used. The high wavelength resolution ( wavelengths) is made possible by the polychromatic Monte-Carlo algorithm employed by sunrise. From the 2-D spectral energy distributions, images in any filter bands or integrated galaxy SEDs can be created. Using a suite of hydrodynamic simulations of disc galaxies, the output broad-band images and spectral energy distributions are compared with observed galaxies from the multiwavelength SINGS and SLUGS galaxy surveys. Overall, the output spectral energy distributions show a good match with observed galaxies in colours ranging from GALEX far-UV to SCUBA submillimeter wavelengths. The only possible exception is the colour, which the simulations underestimate by a factor compared to the SINGS sample. However, the simulations here agree with the SLUGS galaxies, which consistently have significantly larger amounts of cold dust than the SINGS galaxies. The sunrise model can be used to generate simulated observations of arbitrary hydrodynamic galaxy simulations. In this way, predictions of galaxy formation theories can be directly tested against observations of galaxies.
keywords:
radiative transfer – methods: numerical – dust, extinction – galaxies: spiral, ultraviolet: galaxies – infrared: galaxies.1 Introduction
The full spectral energy distribution of a galaxy contains information on all the constituents of the galaxy; stars (both old and currently forming), the hot and cold gas heated by stellar light or collisions, the thermally emitting dust associated with the gas, and possibly even emission from an active galactic nucleus. A model that wants to describe and disentangle the panchromatic spectral energy distribution (SED) of galaxies must necessarily include all these sources of emission.
The necessity of such multi-component models has become more pressing with the recent increase of multi-wavelength, large-area galaxy surveys, including those with truly panchromatic wavelength coverage such as the AEGIS survey (Davis et al., 2007). These surveys are complemented by the growing number of 2D spatially resolved spectra of galaxies from integral field spectrographs. These data can give crucial clues into the dynamic state and resolved star-formation history of galaxies, but interpreting these high-dimensional data sets is not straightforward.
Existing models for calculating galaxy SEDs have mostly been focused on two approaches: Either calculating the broad continuum shapes of galaxy SEDs based on an assumed global dust distribution (e.g. Silva et al., 1998; Ferrara et al., 1999; Charlot & Fall, 2000; Bianchi et al., 2000; Tuffs et al., 2004; Pierini et al., 2004; da Cunha et al., 2008; Bianchi, 2008), or focusing on more detailed modelling of dusty star-forming regions assuming that the SED of a galaxy is dominated by its star-forming regions (e.g. Witt & Gordon, 1996, 2000; Gordon et al., 2001; Misselt et al., 2001; Groves et al., 2008).
Neither of these approaches will suffice if the goal is to model the detailed, spatially- and spectrally-resolved appearance of simulated galaxies as they evolve in time. This is especially true if the observational indicators that are used to determine star-formation rate and star-formation history, such as emission and absorption lines, are included. A model with such a goal must take into account the differential obscuration of various stellar populations, the effect of extra attenuation of light originating inside molecular cloud complexes, and the global distribution of stars and dust. It must also connect these effects with the global dynamical state of the galaxy.
Complementary to, and enhancing, the galaxy surveys, hydrodynamic simulations of galaxies have furthered our understanding of the dynamical and spatial state of galaxies. These simulations have advanced to the point that realistic spiral galaxies are formed self-consistently in cosmological contexts both using smooth particle hydrodynamics (Governato et al., 2008) and adaptive-mesh refinement codes (Ceverino & Klypin, 2009). Adaptive-mesh code galaxy simulations have recently attained resolutions of a few parsec, beginning to explicitly resolve the multiphase structure of the ISM (Ceverino & Klypin, 2009; Kim et al., 2009). However, even with realistic simulated galaxies, a principal obstacle to testing theory against observations is that simulations trace mass, while observations trace light. To draw full benefit from these new multi-wavelength surveys, theoretical models that predict the spectral energy distributions of simulated galaxies are necessary.
Galaxy-scale radiative transfer calculations, using the geometry of stars and dust from the simulations, provide a way to link both observations and simulations and create SEDs that include the effects of geometry, differential extinction, and galaxy dynamics. It is only in recent times that the full SED of simulated galaxies have been studied, using Monte Carlo Models to calculate the spectrum (Jonsson, 2004; Jonsson et al., 2006; Jonsson, 2006; Chakrabarti & Whitney, 2009; Li et al., 2007; Chakrabarti et al., 2008), yet to date they have not taken into account the structures on the scales of star-forming regions nor included emission lines. The model presented here remedies these deficiencies by combining galaxy-scale radiation-transfer calculations done with the sunrise code (Jonsson, 2006) with the treatment of star-forming regions using the dust- and photoionization code mappingsiii (Groves et al., 2008). As a result, the model can approximate radiation-transfer effects that occur on scales below the resolution in the simulated galaxies while still taking into account the star-formation history and large-scale geometry of the galaxy.
The outline of this paper is as follows. First the model is described, including a brief summary of the simulations to which the model is applied for validation and observational comparison. We then validate the model and follow by a demonstration of the images and spectra produced by the model, with a comparison to those of observed galaxies. We conclude with a discussion of the strengths and weaknesses of the present model, along with planned future extensions and improvements.
2 Model
In principle, the construction of a model to calculate the emerging SED of a galaxy is straightforward: simply solve the physics of scattering and absorption of starlight by the dust grains (and by gas) in the galaxy. In practice, such an approach is not feasible for several reasons: First, current galaxy simulations have a finite spatial resolution, at most of order , or in the majority of cases , and a finite mass resolution of, at best, . Such resolution is insufficient to resolve the detailed structures of gas and stars in star-forming regions. Second, even if the galaxy simulations had sufficient resolution, accurate radiation-transfer calculations generally require significant amounts of computer time and would likely be prohibitively expensive except for single cases (i.e. single snapshot of one galaxy). Third, on the scales of star-forming regions radiation affects the dynamics of the gas so simulations would need to treat the radiation transfer in conjunction with the gas dynamics, making such simulations even more prohibitively expensive.
The solution adopted in this work is to include the relevant processes on scales below the resolution by using a sub-resolution approximation. This is similar to how star formation and supernova feedback are treated within the hydrodynamic simulations, and is an effective way of lowering the computational expense of the simulations (provided of course that such approximations are reasonable.)
In our model, the transfer of radiation on galaxy scales is handled by the Monte Carlo radiation transfer code sunrise (described in Jonsson, 2006, from now on J06). Emission from H ii regions and their surrounding remnant birth clouds, on scales below that resolved by sunrise, are calculated using the mappingsiii photoionization code (Dopita et al., 2005; Groves et al., 2008).
The remaining multi-phase structure of the ISM, not including the star-forming regions, is also approximated by a sub-resolution model using the multiphase model of Springel & Hernquist (2003) to determine the fraction of dust that resides in high-density clumps (“molecular clouds”). These clumps generally have a low volume-filling fractions and contribute little to the overall opacity in typical galaxies and are excluded in the current version of the code (see Section 2.3 for details).
2.1 sunrise
The Monte Carlo method for solving radiation transfer problems has gained in popularity in recent years due to the rapidly increasing capabilities of computers. There are many Monte Carlo radiation transfer codes in use (Gordon et al., 2001; Jonsson, 2006; Chakrabarti & Whitney, 2009; Li et al., 2007; Bianchi, 2008, to name a few that are applied to galaxies) but the basic idea is the same: to solve the radiation transfer problem the way nature does, by simply emitting enough photons that the space of possible photon histories is well sampled. The simplest implementation of the Monte-Carlo radiative-transfer algorithm follows a single photon through the medium. This photon is emitted in a random direction and can then scatter and/or be absorbed. Eventually the photon leaves the medium in some direction and can be captured by an external observer. This method is in general very inefficient, and in practice the calculation differs from this description in many ways. sunrise uses many of the standard techniques for increasing the efficiency of the Monte-Carlo method, and most of these were described in detail in J06. Here we review the essential parts of the algorithm and in the following subsections outline the improvements made to the model since, including the IR emission by dust. sunrise is a free, publicly available software that can be applied to any hydrodynamic galaxy simulations111The sunrise web site is http://sunrise.familjenjonsson.org.. The results presented here detail version 3.01.
The basic algorithm of sunrise is as follows: as input, a number of snapshots at different time-steps of a hydrodynamic galaxy simulation (e.g. merging galaxies) are saved and are used to generate the geometry of the problem, and for each of these the 2D spectrum at given camera angles is calculated by sunrise. First, a stellar population synthesis model is used to calculate the SEDs of the emitting sources. Second, the adaptive grid needed for the radiative transfer calculations is generated. Third, the Monte-Carlo radiative transfer calculations are done, generating the optical-UV images. Finally, the thermal heating of the dust and resulting IR emission is calculated.
The sources of radiation within the galaxy simulations are the “stellar particles”. These stellar particles represent a coeval population of stars (see Section 2.5 for details). Based on the coeval-age, mass, and metallicity of these particles, an appropriate SED is selected from a library of single stellar population SEDs computed with the population synthesis model Starburst99 (Leitherer et al., 1999; Vázquez & Leitherer, 2005). If the particle is younger than , it is presumed to have been attenuated and modified by the surrounding gas and dust of its “birth cloud”, and the emission is taken from the mappingsiii models of star-forming regions. The interface between these subresolution models and the galaxy-scale simulation is described in Section 2.3. The photons emitted from the particle originate from a random location within a radius from the particle centre. This is done to avoid point-source effects and to model that the particles represent a collection of stars. Within this work the radius was set to , the gravitational softening length of the galaxy simulations.
As described in J06, the ray-tracing of the sunrise code is performed on a grid, requiring the translation of the density information of the hydrodynamic simulation. To do this, the density of dust is estimated from the galaxy simulations assuming that a constant fraction of the metals in the gas is in the form of dust grains. This fraction is set to 0.4 based on Dwek (1998), but the results are not particularly sensitive to moderate changes in this parameter.
The dust models used for the diffuse ISM are based on the work of Weingartner & Draine (2001), including the updates in Draine & Li (2007, hereafter DL07). This model includes graphite and silicate grains with a distribution of sizes. Carbonaceous grains with sizes () are assumed to have characteristics of Polycyclic Aromatic Hydrocarbons (PAHs). Grain cross-sections are taken from Li & Draine (2001) for the graphite and silicate, and Draine & Li (2007) for the PAHs (though see Section 2.4 for differences concerning dust and PAH emission). For the simulations described here (Section 2.5) we assume Milky-Way type dust and a PAH mass fraction of (MW3.1_60 in Draine & Li 2007) to match the approximately solar metallicity of the models.
An adaptive-mesh refinement grid is used to describe the dust geometry, making it possible to resolve small-scale structure over galaxy scales. The criteria used to determine the structure of the grid are similar to those described in J06, with relative density variations of (the reader is referred to J06 for a detailed description of the grid refinement algorithm).
An additional requirement that the V-band optical depth across a grid cell be less than a given tolerance value, , was also used. The purpose of this criterion is to ensure that cells are not optically thick and that the dust temperature does not change significantly between neighbouring cells (see Section 2.4). Typically, was set to 1.0, but see Section 3 for convergence tests. Regardless of the optical depth, however, no cells smaller than were used because the limited resolution of the hydrodynamic simulations assures there is no structure on smaller scales. As the stellar particles have a radial extent over which their photons are emitted, it is also unlikely that the dust temperature would vary on smaller scales than this. We have also verified that decreasing the minimum cell size did not substantially affect the results.
The emission and tracing of the rays in the radiation transfer of sunrise are similar to other Monte Carlo codes and was described in detail in J06. One of the unique features and strengths of sunrise is the use of polychromatic rays. Unlike in most other Monte Carlo codes, where a ray only contributes to a single wavelength, the sunrise rays contribute to all wavelengths simultaneously. Since the absorption and scattering probabilities are wavelength dependent, this is accomplished by an appropriate weighting of the different wavelengths that is dependent on the ray path. This bias factor represents the probability of photons of that wavelength interacting at that depth relative to the reference wavelength. The correct bias factors for various situations were derived in J06. With polychromatic rays, only one random walk has to be done for all wavelengths, a significant increase in efficiency compared to monochromatic calculations, especially for high wavelength resolution. An example of the bias factor applied to rays after propagating certain distances is shown in Figure 1.

One drawback of using the polychromatic formalism as described in J06 is that the bias factors can potentially be large and thus boost the contributions from single rays such that the outputs become noisy. In the current version of sunrise, this effect is minimised by splitting rays whose intensity (at any wavelength) has been boosted to some multiple of the initial value. The resulting rays, each carrying a fraction of the intensity of the original ray, then propagate independently from then on. An appropriate choice of the reference wavelength also minimises the range of bias factors encountered. For the simulations described here, the threshold intensity for splitting rays was 10 times the starting intensity, while the reference wavelength was , though it was verified that the results are unchanged with reference wavelengths ranging from to .
Perhaps the most important recent addition to sunrise is the ability to self-consistently calculate the infrared emission from the dust in the grid cells. This is a crucial part of the model and is described in separate in Section 2.4.
2.2 Emission from Star-Forming Regions
Observations of star-forming galaxies indicate that the extinction associated with emission lines tends to be greater than that inferred from the UV light. This suggests that the youngest, most massive stars associated with the line emission are surrounded by more dust than slightly older UV-emitting stars (Calzetti, 1997; Tuffs et al., 2004). This differential extinction arises naturally from the fact that star formation preferentially occurs in regions of high gas density (Kennicutt, 1998). This density dependence is included in the hydrodynamic models, and hence this differential extinction is already partly accounted for in sunrise. However, clumping on scales below the resolution of the galaxy simulations is naturally not present. The molecular complexes out of which stars form, and thus dust directly associated with the newly formed stars — the dust within the left-over “birth” clouds of the young stars — are not resolved.
To deal with the subresolution radiative transfer in these birth clouds, we use the 1-D photoionization and radiative transfer code mappingsiii (Groves, 2004). This code is able to calculate the complex transfer of stellar light, including the ionizing radiation, through the surrounding gas and dust of the H ii and photodissociation regions (PDR) associated with young, massive stars, and calculate the resulting nebular and dust emission, including the stochastic heating of dust. For the sunrise models here we specifically use the mappingsiii starburst region models from Dopita et al. (2005) & Groves et al. (2008). These models calculate the radiative transfer of the radiation from a newly formed massive stellar cluster, using Starburst99 spectra for the intrinsic stellar emission. The radiation propagates through a surrounding (spherically symmetric) H ii region and a photodissociation region, whose covering fraction decreases over time as it is cleared away by the strong winds from the massive cluster. What distinguishes these models from other starburst models is that they include the evolution of the stellar wind bubble blown by the stellar winds over time, constraining the geometry of the H ii region, and reducing the number of physical parameters needed to describe the emission (Dopita et al., 2005).
The final result is a spectrum made up of stellar, H ii and PDR emission, from far-UV to mm wavelengths, including about 1800 emission lines (though most are outside the wavelength range covered by the present models). The shape of the SED is controlled by five parameters: the metallicity of the stars and gas (the same set as Starburst99, and given by the hydrodynamic simulations); the pressure of the surrounding ISM (given by the hydrodynamic simulations); the compactness of the stellar clusters (); the clearing timescale of the PDR (); and the age of the stellar cluster (for a full description of the parameters and their physical meaning, see Groves et al., 2008).
These mappingsiii models substitute the Starburst99 stellar clusters as sources in the sunrise calculation for cluster ages less than . By this age, most of the ionizing radiation has been emitted (Dopita et al., 2006). The typical clearing timescale for the “birth” clouds surrounding the young stars is also expected to be less than this, meaning that by years all the gas and dust directly associated with the stars has been essentially cleared away. What is left is an exposed stellar cluster (the Starburst99 model) surrounded by the diffuse gas and dust treated by sunrise.
The dust properties assumed within the birth cloud models (as described in Dopita et al., 2005) are similar to those used in sunrise, thus are consistent across the birth cloud-diffuse boundary. Grain cross-sections are taken from Li & Draine (2001) for the graphite and silicate grains, with a similar power-law distribution. The depletion of elements onto grains is based on the local interstellar cloud (Kimura et al., 2003), and is approximately the same as the Dwek (1998) depletion fraction of 0.4. The main difference occurs with the PAH molecules, where mappingsiii uses the Weingartner & Draine (2001) coronene-sized grains to determine the opacity, but uses an empirical template for the emission, and includes the effects of photoelectric heating/losses, as described in Groves et al. (2008).
As discussed in section 2.5, the formation of stellar particles in the hydrodynamic simulations is a discretized realisation of the mass of stars formed and does not truly indicate that a mass of stars equal to the particle mass was formed at the instant the particle is spawned. Except in massive starbursts, stars generally form in smaller clusters than the masses of the stellar particles, which for the large galaxies is . The average cluster size within the mappingsiii models is a free parameter connected with the compactness of the star-forming region. To integrate the models within sunrise we set this size to a constant value of , so conceptually a young stellar particle of mass in the simulations should be thought of as made up of separate star clusters occupying a nearby region of space.
Due to this multiple cluster interpretation of the young stellar particles (and because realistically individual stellar clusters do not form instantaneously) we have chosen (as discussed in Groves et al., 2008) to average over the years, for the burst, essentially approximating the clusters as continuously forming stars over this timescale. Due to this assumption, we alter slightly the definition of the PDR clearing timescale () to the PDR covering fraction, the time-averaged fraction of the stellar cluster solid angle that is “covered” by the PDR ().
With the averaging over age, four free parameters for the mappingsiii models remain. Two of these (metallicity, ISM pressure) are given by the hydrodynamic models. The other parameters (PDR covering fraction and compactness of the stellar clusters) are not directly constrained by the hydrodynamic models. Therefore, we need to set these to reasonable values based on empirical evidence. The compactness parameter is calculated from our assumed mass of the star clusters, and the ISM pressure given by the hydrodynamic model using Equation (13) in Groves et al. (2008). This means that is directly dependent upon the ISM pressure. For the covering fraction, we assume a fiducial value of , and explore this parameter later in the paper.
2.3 Interfacing sunrise with the Subresolution Models
An important part of the model is ensuring that the “boundary conditions” between the subresolution mappingsiii models and the description of the general ISM are appropriately matched. Because the mappingsiii models are associated with young stellar particles but also contain gas and dust, this mass must be borrowed from the environment for the lifetime of the mappingsiii particles. This raises the concern about a potential “double-counting” of gas; when a mappingsiii particle of mass is created, the emission from the young stars will for a short time be attenuated by an additional mass of gas associated with the surrounding H ii region and PDR. If care is not taken, the photons may then encounter this mass again after entering the diffuse ISM, in which case there will be an overestimation of the attenuation. More severely, if the mass of gas associated with the mappingsiii particle is larger than the total amount of gas available in the vicinity of the newly formed particle, there is in principle not enough gas surrounding the star particle to make up the gaseous component of the mappingsiii particle.
It should be pointed out that this is a problem in principle with any implementation of star formation that wholesale converts particles of gas into stars. Converting a gas particle into a stellar particle implies a 100% efficiency of star formation, which is unrealistic. In reality, there will always be gas left over from the formed stars. This issue is further exaggerated by the instantaneous feedback approximation, used in many simulations, that returns the metal–enriched gas associated with the stars (i.e. stellar winds) back to the gas at the moment of the stellar particle creation. What all this emphasizes is that, on a single particle basis, the simulations can not be interpreted literally, and this fact is independent of any radiation-transfer calculations. If the galaxy simulations lead to situations where the local supply of gas is completely turned into stars the model will fail in several ways, not only in the apparent star-formation efficiency but also in calculating metal enrichment. In such a situation it is not reasonable to expect the radiative-transfer calculations to be accurate. That said, the simulations presented here are far from such a regime.
To estimate the potential double counting of mass, we must estimate the mass associated with the PDR surrounding the H ii region (the mass of ionized gas is negligible). The PDR in the mappingsiii models used here is defined to have a hydrogen column density of (roughly at Solar metallicity) of material swept up by the stellar wind. The radius of the PDR is determined by the solution to the differential equation (13) in Dopita et al. (2005). As we are using the time-averaged formulation of the mappingsiii models, the luminosity-weighted time average of is the relevant quantity. For the full set of mappingsiii models this varies from for low-mass clusters in high-pressure regions up to for high-mass clusters in low-pressure regions, typical ranges for massive star-forming regions (Orion Nebula to multiple 30 Doradus).
The mass of the gas in the PDR can be computed as
| (1) | |||||
| (2) |
For a typical PDR radius around the clusters of and a PDR fraction of , this gives a typical of . This implies star formation efficiencies of 10 %, not unreasonable.
Based on the gas density in the location of the particle, the radius around the particle that contains the mass is calculated (). It is expected that be larger than , since the former was calculated based on the average density in the region while the PDR should be made up of higher density gas near the star-forming region. This is merely a manifestation of the fact that dense star-forming regions are unresolved in the simulations.
For determining the potential double-attenuation of light, the interesting comparison is between and , the radius of the emitting mappingsiii particle itself. As was mentioned in Section 2.1, the stellar particles have a radial extent over which their emission originates. This is necessary to avoid point-source effects and to emphasize that the particles represent a collection of stars. This is further true for the H ii regions and PDRs which will have a larger extent than the stellar clusters. The photons emerging from the mappingsiii particle will thus enter the ISM a distance away from the particle centre.
There are now three possible scenarios: If , then there is indeed a double-counting issue. The photons will then pass the same material twice, first in the PDR and then in the general ISM, potentially leading to an overestimate of the attenuation. (The question is really more complicated, as the optical depth of a certain mass of material goes up as it is concentrated to smaller radii. It is thus not certain that there will be a significant overestimate of the attenuation, even if the same matter is passed twice. The more dispersed material will have a much smaller impact on the attenuation.)
Conversely, if , the particle is too big and photons emerging will “skip” some attenuating matter. In this case, the attenuation of the emission will be underestimated.
The desired situation is thus that , in which case the radius of emission is well matched to the amount of material surrounding the particle and the ray encounters the amount of material that’s expected.
In the simulations used here, the particle size is fixed to . The for the mappingsiii particles varies, but is generally . There is thus potential for double-counting, but the excess optical depths were estimated to be only . Furthermore, a special run where the radii of the mappingsiii particles were set to showed differences in the UV attenuation of at GALEX wavelengths, so we conclude that this double-counting of mass does not significantly influence our results.
However, this does point to one of the other issues with the simple replacement of the stellar particles by mappingsiii particles: as mentioned before, H ii regions are generally much larger in extent than the stellar clusters ionizing them. This means that the line emission will generally be much more diffuse than the stellar particles can represent, even ignoring the small fraction of diffuse ionizing UV. Hence in sunrise images, the H will tend to be more point-like than in real galaxies.
Another issue is that, due to their 1-D nature, the mappingsiii models cannot include the multiphase structure of the ISM, consisting of dense molecular clouds in a diffuse medium. This clumping of gas (and dust) into optically thick clumps (not containing young star clusters) will decrease the effective optical depth of these regions while also making the extinction law more grey (Witt & Gordon, 1996). In principle, the adaptive-mesh grid in sunrise could be used to resolve these structures (as done in Bianchi, 2008), but doing so in these simulations would require a prohibitively large number of grid cells. Instead, a simpler, subresolution, approach is used.
A model for this multiphase medium is used as the prescription for supernova feedback in many GADGET hydro simulations (Springel & Hernquist, 2003). This model gives an analytic prescription for the mass fraction of the dense and diffuse phases of the ISM as a function of the average gas density. In the simulations presented here (in Section 2.5), it is assumed that only the diffuse phase contributes to the attenuation of radiation, equivalent to assuming that the dense phase has a negligibly small volume filling fraction and that the probability of radiation entering a dense cloud is negligible. This is admittedly a crude assumption, and an improvement which treats these dense clumps using a “megagrains” formalism (Hobson & Padman, 1993; Városi & Dwek, 1999) is underway. In the simulations of quiescently star-forming disk galaxies presented here, however, the gas densities are regulated by supernova feedback and never reach significantly higher than the threshold density above which the multiphase medium develops. Consequently, the mass in the dense phase is small and the multiphase assumption has a negligible effect on the results.
2.4 Calculation of Infrared Emission
At UV–optical wavelengths, the emission from stars and nebulae dominates the SED of galaxies, and dust emission can be ignored. At wavelengths longer than about this is no longer the case and the infrared emission from dust grains and PAH molecules has to be considered. To model this emission, the local radiation field intensity needs to be determined and the resulting local thermal emission from the grains calculated, with both varying as a function of location in the galaxies.
The infrared emission from the H ii- and photodissociation regions in the mappingsiii models includes the effect of thermal fluctuations undergone by very small grains (Groves, 2004). The emission from polycyclic aromatic hydrocarbons (PAHs) that dominates the mid-infrared emission in galaxies is treated as a special case. A certain fraction of the carbon dust is assumed to be in the form of PAH molecules. Their absorption is calculated based on the cross-sections in Li & Draine (2001), and the fraction of this energy not lost to photoelectric effects is then emitted as a fixed template made up of Lorentzian profiles designed to fit Spitzer IRS observations of PAH emission (Dopita et al., 2005; Groves et al., 2008), assuming energy conservation.
Unlike the version described in J06, the current version of sunrise has the capability to calculate the dust temperatures of the various dust species and sizes in the grid cells. With this addition, the infrared emission from the dust grains will self-consistently reflect the distribution of radiation intensities heating the grains at various locations in the galaxy. Unlike in the mappingsiii models, the calculation of the emission SED of the grains is done assuming thermal equilibrium for all grain sizes, neglecting the effect of thermal fluctuations. Emission from PAHs use the same template method as the mappingsiii models, but only for a fraction of the grains smaller than (). The emission is calculated using the same template spectrum used by the mappingsiii code (Groves et al., 2008) assuming energy conservation. This approach is considerably less computationally intensive than a full calculation involving thermal fluctuations while yielding reasonably realistic results. , the fraction of small grains emitting through the template was treated as a free parameter, with a value of found to be the most reasonable and taken as our fiducial value for the simulations discussed here (see Section 4.4 for a discussion on this parameter).
Neglecting the thermal fluctuations of small grains can potentially affect the accuracy of the calculated SED. For this purpose, an alternative way of calculating the dust emission spectrum using the precomputed SED templates of DL07 can also be used. These emission spectra are based on the full temperature distribution of the different size dust grains in the model, parametrized by the intensity of the radiation heating the dust. For each grid cell, the template most closely matching the radiation intensity in that cell is used as the emission from that cell. While this method of calculating the emission SED has the advantage that it is a computationally inexpensive way to include thermally fluctuating grains, it has the drawback that it does not take into account the wavelength dependence of the radiation field. The templates are calculated assuming that the radiation field is a scaled version of the local interstellar radiation field of Mathis et al. (1983) and do not take into account the shape of the radiation spectrum. The wavelength dependence of the heating radiation is potentially significant both because of the differing cross-sections of grains of different sizes, and the fact that, for a given energy density in the radiation field, high-energy photons will excite larger thermal fluctuations than low-energy photons. To estimate the magnitude of this effect, a full calculation of the temperature distribution of the grains would be necessary, something that is currently not possible.
While it is straightforward to calculate the dust heating due to starlight, correctly estimating the heating due to self-absorption of the emission from the dust grains themselves requires coupling the emission and absorption in the grid cells and an iterative solution becomes necessary. In the simplest method, the dust temperatures are recalculated at every step and the new estimate of the dust emission propagated through the volume leading to a new estimate of the dust temperatures (Misselt et al., 2001; Bianchi, 2008; Chakrabarti & Whitney, 2009). The convergence of this method is ultimately limited by the intrinsic Monte Carlo noise in each estimate of the radiation field. A more efficient method is to use the radiation field from the previous estimation as a reference solution and only solve for the change due to the last iteration (Juvela, 2005). This method, which is used by sunrise, is guaranteed to converge as the updates to the radiation field must decrease for each iteration. Convergence in very optically thick regions can be slow, but this is not a concern in the simulations studied here.
The iterative scheme employed by sunrise can be thought of as a hybrid of the methods that recompute the dust temperatures at each iteration and the temperature correction scheme used by Bjorkman & Wood (2001). In the temperature correction method, each photon-packet absorption is immediately followed by an update of the dust temperature in the cell where the absorption takes place and the subsequent re-emission of the photon packet. In this re-emission, the energy of the photon packet is conserved, but the wavelength of the photon packet is drawn from the difference of the emission SED of the dust in the cell before and after the absorption event. The re-emitted photon packet thus corrects the distribution of the photon packets emitted previously so it is correct for the current dust temperature in the cell. As many photons are traced through the volume, the temperature of the dust in the grid cells will converge to the equilibrium temperature without explicit iteration.
A big virtue of the temperature correction scheme is that it is explicitly energy conserving. However, as outlined in Chakrabarti & Whitney (2009), its efficiency is limited by the fact that only explicit absorption events contribute to the dust temperature calculation. A more efficient way of estimating the dust temperature is to use the estimate of the radiation intensity from the total path length of photons traversing the cell, also known as “continuous absorption” (Lucy, 1999), but this method is incompatible with the immediate re-emission method. Instead, a number of rays are traced through the volume, giving an estimate of the radiation intensity in all cells. Based on this estimate, the temperature of the dust in all grid cells are updated and the difference between the current emission SED of the dust in the grid cell and that of the previous iteration is used as the source SED. From energy conservation, it can be seen that this source SED, summed over all grid cells, can never be larger than that of the previous iteration, so the scheme must converge.
Since the transfer of these source SEDs is done using the polychromatic radiation transfer used in sunrise, it also avoids a major criticism of the Bjorkman & Wood (2001) method: that it can fail in certain cases because the probability distribution from which photon re-emission wavelengths are drawn can become negative for certain wavelengths (Baes et al., 2005). With the polychromatic algorithm, the emission wavelength is not drawn from this distribution. Instead, the entire spectrum is propagated at once, and there is nothing requiring the energy be positive at all wavelengths. Indeed, when the DL07 SED templates are used for the dust emission, part of the source SED during the iteration to convergence becomes negative but the method still converges to an equilibrium.
Formally, the algorithm can be described as follows. Define as the radiative intensity at wavelength in cell due to stellar emission. This quantity is fixed. Similarly, is the intensity from dust emission after iteration . The emission from dust is described by a function that converts radiation intensity into an emission spectrum, such that
| (3) |
The radiative coupling between cells can be expressed as a matrix describing the contribution to the radiation intensity in cell due to dust emission from cell , such that the intensity in cell is
| (4) |
Because the cross-sections of the dust grains are independent of temperature, is constant (for a given wavelength). (In this picture, the Monte Carlo method is just a way of evaluating the elements of this matrix. In principle, one could evaluate the elements of this matrix once and then invert it to solve for the equilibrium state. In practice, this is not possible as the number of elements is the square of the number of grid cells, in the simulations used here.)
In the simplest calculation, this equation would be iterated to convergence, i.e.
| (5) |
which, as mentioned earlier, has the undesirable property that the entire intensity estimate is recalculated for each iteration. Because the Monte Carlo estimate of in each iteration is subject to independent random error, the iteration will not converge.
By subtracting two successive iterations from each other, we get
| (6) |
This shows that the update to the intensity estimate in each cell comes from transferring an emission distribution consisting of the difference in luminosity between the two previous iterations. Unlike the iteration in Equation 5, each progressive iteration here retains a memory of the previous evaluations of , effectively averaging the Monte Carlo variance over the iterations such that the iteration must converge.
In very optically thick situations, a significant fraction of the emission in a cell will be absorbed inside the cell itself. Effectively, this will result in a with very large diagonal elements leading to slow convergence. There are methods to accelerate the convergence (Juvela, 2005), but these are not needed in the situations presented here.
The iteration is terminated when all cells pass the convergence criterion requiring that
| (7) | |||||
| (8) |
for all grid cells. Essentially, the first criterion tests whether the contribution from dust emission is negligible compared to heating from starlight and the second criterion, important in regions that receive little starlight, tests whether the dust emission from iteration of cell is negligible compared to the total dust emission. In the simulations used here, convergence is obtained with only two iterations.
2.5 Galaxy simulations
The galaxy simulations used in this work have been described in detail in earlier papers (Cox, 2004; Jonsson, 2004; Cox et al., 2006; Jonsson et al., 2006; Cox et al., 2008; Rocha et al., 2008; Lotz et al., 2008), but a brief overview will be given here for context.
The simulations are of 7 different galaxy models run with the GADGET SPH code, including star formation and feedback (Springel et al., 2001; Springel, 2005). The simulations also include mergers of galaxies, where two of the models are placed on approaching orbits, but in this paper only isolated galaxies are considered. In the simulations, gas is represented by Lagrangian particles. As stars form, gas is transformed into collisionless matter. This is implemented in a stochastic sense (Springel & Hernquist, 2003); each gas particle will spawn a number of stellar particles, with a probability based on the star-formation rate of the particle. These “new star” particles have masses – , depending on the mass of the simulated galaxy, and can be thought of as a cluster of coeval stars. However, it is important to not take this analogy too far. The star particles describe a discretized conversion of gas into stars, but the presence of a young star particle in a region should not be literally interpreted as if of young stars just formed at that location.
At low star-formation rates, where only a few of these particles are present at any given time, this discretization becomes particularly severe and it is possible to see large fluctuations in the stellar light. This will be discussed in detail in Section 4.
For the simulations to be stable, a model for supernova feedback is a necessary ingredient, and many different approaches to modelling it exists. The supernova feedback model in the simulations (extensively analyzed in Cox et al., 2006) works by artificially pressurizing star-forming regions, in effect setting their equation of state.
A simple scheme for metal enrichment, where the metals produced by supernovae are instantaneously recycled into the gas of the particle, is used. In effect, each particle is a “closed box model” that does not exchange metals with its neighbours. While simple, this method has several drawbacks. For one, if the entire gas particle is consumed by star formation, all metals (and hence all dust) is removed from the gas phase. Also, late gas recycling by e.g. AGB stars, which deposit gas far away from the cloud in which they were born, is not included. Codes with better treatment of metal production and gas recycling from stars exist (e.g. Scannapieco et al., 2005; Stinson et al., 2006), and using such simulations would improve the accuracy of the radiation-transfer calculation.
The 7 galaxy models are isolated galaxies, where the galaxies are evolved in isolation for and snapshots saved every to study how the galaxies evolve. The galaxies have been modelled after observed properties of local spiral galaxies and span roughly two orders of magnitude in stellar mass. They contain a disk of gas and stars, a stellar bulge, and a dark matter halo. The properties of the models are summarised in Table 1. There are two series of models, the “Sbc”-type models are modelled after local late-type spirals, while the “G”-series cover a wider range in mass and are modelled on median properties from the SDSS. The metallicity and age distribution of stars and gas in the galaxy models was chosen to agree with observations (Rocha et al., 2008).
| Model | a | b | c | d | e | f | g | h | i | j | Agem | ||
|---|---|---|---|---|---|---|---|---|---|---|---|---|---|
| () | () | (kpc) | (kpc) | () | (Z⊙) | (dex/kpc) | (Gyr) | (Gyr) | |||||
| Sbc+ | 7.0 | 0.125 | 3.0 | 0.52 | 0.10 | 0.60 | 0.023 | 13.9 | 110 | ||||
| Sbc | 5.5 | 0.125 | 3.0 | 0.52 | 0.10 | 0.45 | 0.030 | 13.9 | -106 | ||||
| G3 | 2.8 | 0.125 | 3.0 | 0.20 | 0.14 | 0.37 | 0.058 | 14.0 | 10 | ||||
| Sbc- | 4.0 | 0.125 | 3.0 | 0.52 | 0.10 | 0.40 | 0.041 | 13.7 | 124 | ||||
| G2 | 1.9 | 0.2 | 3.0 | 0.23 | 0.08 | 0.26 | 0.04 | 14.0 | 8.2 | ||||
| G1 | 1.5 | 0.2 | 3.0 | 0.29 | 0.04 | 0.20 | 0.05 | 11.5 | 3.7 | ||||
| G0 | 1.1 | 0.2 | 3.0 | 0.38 | 0.01 | 0.15 | 0.06 | 8.7 | 1.4 |
aVirial mass. bBaryonic mass. cStellar disk scalelength. dRatio of stellar-disk scaleheight and scalelength. eRatio of scalelengths of gas and stellar disks. fGas fraction (of baryonic mass). gBulge fraction (of baryonic mass). hBulge scale radius. iCircular velocity. jMetallicity at 1.3 scalelengths from the centre (gas and stars). kMetallicity gradient. lAge of oldest stars (formation time of bulge and oldest disk stars). mExponential time constant of the star formation rate for the disk stars.
3 Model Validation
In this section, we demonstrate that the radiation-transfer code is correct and that the simulations performed are converged, establishing trust in the model results. A number of tests of sunrise were performed in J06 and will in general not be repeated here. The exception is the benchmark problem of Pascucci et al. (2004), which was only partially done in J06.
3.1 The Pascucci et al. (2004) 2D Radiative Transfer Benchmark
To first verify that sunrise, including the improvements described above, give correct results, the comparison with the benchmark problem of Pascucci et al. (2004) that was done in Section 5.5 of J06 is repeated. Since infrared emission is now included in sunrise, the comparison is done over the entire wavelength range unlike in J06 where only wavelengths dominated by stellar radiation were included. For brevity, we also omit the lower-optical depth cases and only present the results from the most stringent case. For this test polychromatic rays were used. The difference between the sunrise output SEDs and the RADICAL output of Pascucci et al. (2004) is shown in Figure 2.

In general, the agreement is good, within about 4 percent except at wavelengths around where the difference reaches a maximum of 11 percent in the edge-on case. This agreement is well within the internal differences between the various codes used in the P04 benchmark and mimics the behaviour of several of these codes. The sensitivity of the feature around is likely due to the importance of resolving the inner edge of the disk where the hottest dust will be located. It is also worth noting that the short-wavelength wiggles in the difference must be due to stochastic variations in the RADICAL results, as they are substantially larger than the uncertainty in the sunrise results. The sunrise calculation was done with polychromatic rays, so there is no inherent stochastic wavelength-to-wavelength variation in the results unlike for the codes that perform an independent calculation for each wavelength. (The results in J06 differed substantially more from those in P04. The majority of this difference was due to the incorrect truncation of the disk at a height of only instead of .)
3.2 Convergence Concerning Number of Rays Traced
Having shown that the radiation-transfer calculation reproduces the results of a non-trivial test case, we now turn to the galaxy simulations. At a most basic level, the convergence of the output spectral energy distributions with regards to number of rays and grid resolution is the first test. Figure 3 shows the Monte Carlo variance in the SEDs for the Sbc galaxy viewed from the two extreme inclinations of face-on and edge-on. The variance is less than 1 percent at all wavelengths, and for most wavelengths substantially less, indicating that the number of rays is sufficient for a well-constrained integrated SED. The requirements are more stringent when the spatial dependence of the SED is investigated, a matter we return to in Section 4.3.

3.3 Convergence Concerning Grid Resolution
It is difficult to conclusively show convergence with regard to grid resolution, because increasing the resolution of the grid much above what is used for the simulations is impossible due to the exponentially increasing memory requirements. The edge-on SED is quite sensitive to accurately resolving the exponentially decreasing density of dust in the vertical direction. This is also a geometry which the adaptive-mesh refinement grid, being made up of cubic cells, is unable to capture efficiently, leading to large numbers of grid cells.
To support our current resolution and to demonstrate convergence in the grid, a number of tests were run on the Sbc galaxy model, where the resolution was increased through the alteration of the various parameters governing the structure of the grid. The fiducial resolution grid for the Sbc galaxy contains 590k grid cells, and tests were done with up to 14M cells. The results for the (most sensitive) edge-on case are shown in Figure 4. The maximum deviation is only and occurs in the edge-on case for wavelengths shorter than at the highest resolution cases. At larger wavelengths and for inclinations more than away from edge-on, the variations are less than . This variation is likely due to the exponential decline of dust in the vertical direction, as well as possible “lines of sight” opening up due to the finer resolution.
As the dust emission SED proved to be converged at resolutions much lower than the runs shown here, these tests were run without dust emission to minimize the amount of computer memory needed. Thus, only wavelengths dominated by stellar emission are shown.

The tests shown in Figure 4 demonstrate that the output SED is converged to within a few percent for our current resolution given by our standard grid refinement parameters of: ; a minimum cell size of ; relative variation in the dust density ; and finally that used to set a lower limit on the opacity that is likely to affect the results be set to (see J06 for a detailed description of the grid refinement parameters).
3.4 Convergence of the Dust Temperature Iterative Solution
Another check that must be performed is to verify that the iterative solution to the dust temperature distribution is converged. When increasing the accuracy of the iterative solution by an order of magnitude by setting the tolerances, and , to one-tenth their values in Equations 7 & 8, the number of iterations to convergence were not affected. This indicates that the results are not affected by the accuracy of the iterative temperature solution, at least for the fairly low optical depths encountered in these simulations.
3.5 Verifying Energy Conservation
As the dust and stellar emission processes being distinct (though connected) parts of sunrise, and with the dust emission being based on the Monte Carlo estimate of the radiation field, it is important to verify that global energy conservation is in fact maintained to within a reasonable level in the simulations. Using too few rays, for example, will result in a poorly sampled radiation field and thus a noisy estimate of the dust heating, which could in principle result in a significant energy non-conservation. Insufficient accuracy of the iterative solution to the dust temperature distribution would also result in apparent energy non-conservation.
Checking energy conservation, however, is somewhat non-trivial, because the emerging flux from the galaxies are only estimated at a finite number of cameras. Since the emerging radiation field is not isotropic, a test of energy conservation will only be meaningful if the radiation field is sampled at a sufficiently large number of directions. For this purpose, a special run was made with 88 cameras (instead of the 13 typically used for the simulations presented here) arranged isotropically around the galaxy. When averaged over these points, the emerging luminosity from the galaxy did indeed match the intrinsic stellar luminosity to within .
3.6 Convergence of Hydrodynamic Simulations
Once it has been verified that the radiative-transfer calculations are converged, the question turns to the galaxy simulations themselves: Are they converged with respect to particle number? It was verified in Cox et al. (2006) that the global star-formation rate in the simulations is converged with respect to particle number. However, Lotz et al. (2008) noted that the Gini coefficient calculated from the images of the simulated galaxies indeed was sensitive to particle number. This effect was due to the fact that young star particles, which are very luminous and, for moderate star-formation rates, few in number, carry enough individual light to affect the Gini coefficient. When the particle number in the simulation was increased by an order of magnitude, the luminosity of the young stars were distributed over more particles, and the surface brightness distribution of the galaxies became more uniform.


With this in mind, it is not obvious whether the SED of the galaxies can be expected to be converged with respect to particle number. The SEDs of the Sbc galaxy compared to that of a version with 10 times larger number of particles is shown in Figure 5. As these are different simulations, with slightly different dynamical evolutions of the galaxy, the comparison is done in relation to the variance of the SED for the galaxies over their evolution. The difference between the standard and 10x higher resolution in the face-on direction is consistent within about , though the higher-resolution galaxy is systematically brighter in the UV and fainter in the infrared. This indicates that the higher-resolution Sbc simulation has slightly less dust attenuation compared to the standard-resolution galaxy. Conversely, in the edge-on direction, the higher-resolution galaxy is systematically fainter than its standard-resolution counterpart. This difference is significant in the near-IR where it amounts to , 2 – 3 times larger than their internal variation. This difference must be due to a difference in the dust attenuation, as the differences of the intrinsic source SEDs of the two simulations are much smaller.
Quite likely, the differences in the SEDs originate in the better ability of the higher-resolution simulation to resolve the vertical structure of the galaxy disks. A more puffed-up vertical structure in the lower-resolution simulation would be expected to result in a higher face-on and lower edge-on attenuation, as seen. Given the sensitivity of the dust attenuation to resolving the vertical structure of the galaxy disks, higher-resolution simulations would be desirable. New hydrodynamic codes such as the unstructured-mesh code AREPO (Springel, 2009) should also be more efficient at resolving highly flattened structures, and it would be interesting to see the impact of such simulations on the radiation-transfer calculations.
4 Results
To determine the validity of the models and to demonstrate its output we have run sunrise on our 7 simulated galaxies at 21 points in time during their evolution (every ) for 13 different viewing angles ranging from face-on to edge-on to face-on in the opposite direction. Each run results in a two-dimensional, far-UV to mm wavelength SED for the galaxy from that viewing angle, that can be used to create specific band pass images or integrated galaxy SEDs.
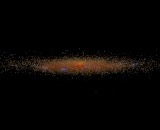
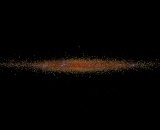
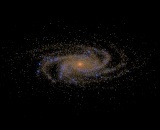
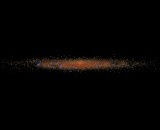
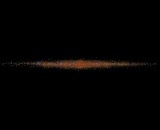
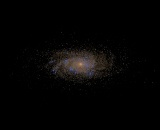
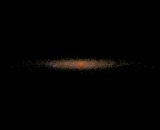
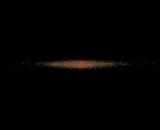
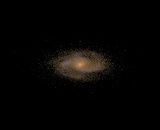
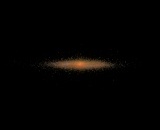
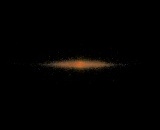
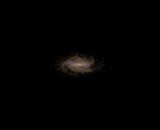
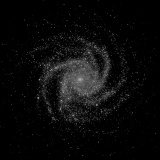
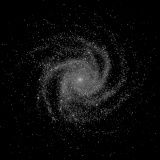
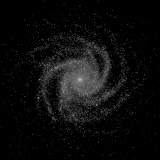
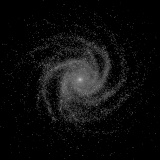
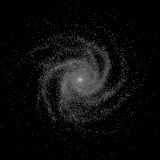
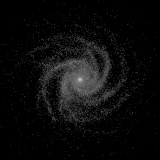
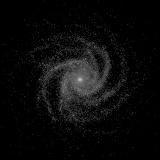
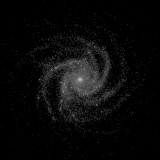
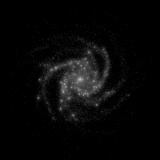
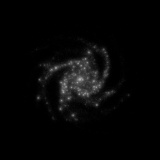
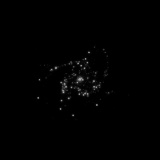
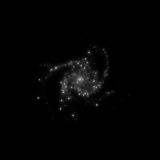
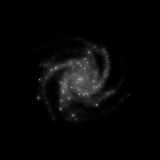
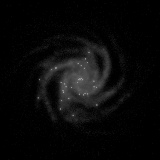
To familiarize the reader with the model outputs, we first present a comprehensive gallery of images and spectra of the 7 simulated galaxies. Figure 6 shows colour-composite images of the galaxies at 4 different inclinations, while Figure 7 shows images of the Sbc galaxy at 16 different passbands from GALEX FUV to SCUBA . Figure 8 shows the integrated SED of each galaxy as a function of inclination.
All galaxies in Figure 6 have been evolved for , and the physical extent of the images is , which clearly demonstrates the decrease in scale from the Sbc to G0 galaxies. The images simulate closely the SDSS “postage stamps”, as they use the SDSS -bands to make the colour composite images using the algorithm of Lupton et al. (2004). In fact, their appearance is strikingly similar to real galaxies: Star-forming regions outline the spiral arms, a yellowish bulge is present in the centre, and, when viewed edge-on, the large galaxies show a prominent, reddened dust lane. The smaller G1 and G0 galaxies have noticeably lower surface brightnesses than the larger ones, and show no obvious signs of dust attenuation. (Incidentally, this is largely consistent with findings of Dalcanton et al. (2004) that dust lanes are prevalent in spiral galaxies only when rotational velocities are greater than .)
In Figure 7 we concentrate on the Sbc galaxy (also at with a image size), demonstrating the strong morphological differences between different wavelength observations. Note that the resolution in the images is due to the model itself, with the “typical” resolution of instruments that observe at each wavelength not considered. In the FUV, the images are dominated by regions of recent star formation. These trace the spiral arms with almost no indication of the general shape of the galaxy. This appearance resembles many of the real galaxies imaged with GALEX, except that the limited number of young stellar particles in the simulations give the model galaxies a more “speckled” appearance.
In the optical bands, the star-forming regions decline in importance and the older stellar population dominates the shape of the galaxy. This continues into the NIR up to wavelengths longer than , beyond which PAH emission begins to outline the star-forming regions again. In the and bands, PAH emission excited by UV emission from young stars trace the spiral arms and star-forming regions. In the MIPS band, emission from hot dust in the star-forming regions dominates the appearance, while in the far-IR, cooler, more diffuse dust makes the galaxy look progressively smoother.
Figure 8 supports the previous figures, showing the full UV to sub-mm SEDs at the same 4 inclinations of Figure 6. In all 7 galaxies, the effects of inclination are clearly visible in the optical-UV, with extinction increasing with inclination due to the dust in the disks. Conversely, for all galaxies the IR is little affected by inclination due to its isotropic emission and low opacity, with the exception of the strong silicate feature in the Sbc galaxies (this feature is also reflected in the bias factors in Figure 1). As in Figure 6 the differences between the galaxies are visible, with the decrease in both SFR and dust content visible through the decreasing equivalent width of the emission lines and decreasing dust effects (extinction and emission) as we go from the massive Sbc galaxies to the small G-series. In fact, in the smallest G0 galaxy, the SFR is so low that dependence on inclination is dwarfed by the the time variation, as shown in the bottom-right of Figure 8.
The contributions from primary emission (the star and mappingsiii particles) and from heated dust grains in the diffuse ISM that make up the SEDs in Figure 8 are shown separately for the Sbc galaxy (edge-on and face-on) in Figure 9. This figure nicely demonstrates the “step-by-step” radiative process, and the wavelength-dependent relative contributions. At all wavelengths longer than , where PAH emission begins to dominate over stellar emission, the SED is dominated by emission from the diffuse ISM. The contribution from star-forming regions, in the form of mappingsiii particles, is most important around where it contributes almost half of the emission. Since the emission from star-forming regions is concentrated into discrete regions, these regions have high surface brightness and are prominent in the images of the MIR emission, as seen in Figure 7.
| Galaxy | ||||
|---|---|---|---|---|
| Sbc+ |  |
 |
 |
 |
| Sbc | 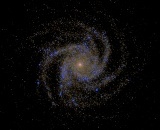 |
 |
 |
 |
| Sbc | 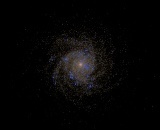 |
 |
 |
 |
| G3 | 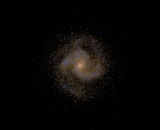 |
 |
 |
 |
| G2 | 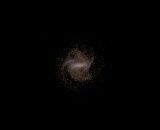 |
 |
 |
 |
| G1 |  |
 |
 |
 |
| G0 |  |
 |
 |
 |
| GALEX FUV | GALEX NUV | B | V |
 |
 |
 |
 |
| R | I | J | Ks |
 |
 |
 |
 |
| IRAC1 | IRAC2 | IRAC3 | IRAC4 |
 |
 |
 |
 |
| MIPS | MIPS | MIPS | SCUBA |
 |
 |
 |
 |
| Sbc+ | Sbc |
 |
 |
| Sbc | G3 |
 |
 |
| G2 | G1 |
 |
 |
| G0 | G0 (time variation, face-on view) |
 |
 |


4.1 Comparing the Simulations with Observed Galaxies
While the simulated galaxies were not created to be exact replicas of existing galaxies, it is still worthwhile to test whether the models of the simulated galaxies really produce realistic SEDs. To do this, the simulated galaxies were compared to the galaxies in the SINGS sample of nearby galaxies (Dale et al., 2007, hereafter D07). The D07 catalogue contains photometry in 17 bands from the GALEX FUV to Spitzer MIPS and, in some cases, from SCUBA for 75 nearby galaxies, making it possible to test the simulations against a homogeneous dataset over a very broad wavelength range. To extend the number of galaxies with SCUBA data, the SLUGS sample of Willmer et al. (2009) is also included when comparing the far-infrared and submillimeter data.
As mention in the previous section, the simulations have been observed at 21 points in time, each viewed from 13 different angles. For the 7 simulated galaxies this amounts to a total of 1,911 SEDs, making it infeasible to plot individual points. The results are instead presented as density plots where the shade represents the density of simulated galaxy observations in that region. The probability of observing the simulated galaxies has been weighted appropriately based on time and solid angle, but no attempt has been made to adjust for the abundance of galaxies of different masses. The simulated data points can thus be expected to over-emphasize large galaxies over small. However, the SINGS sample is also not a statistically representative sample of galaxies, but rather was selected to cover a wide range of morphologies, luminosities and infrared-to-optical ratios (Dale et al., 2007). The comparison should thus be done to ascertain whether the simulations lie in a region of parameter space occupied by real galaxies, rather than matching the detailed distributions of the simulated and real galaxies.
In all the following plots we use the given data values from D07, but do not indicate the uncertainties given in the paper, which range from for the optical-NIR data up to for the data (see D07 for exact values). In addition, aperture correction factors were applied to the longer wavelengths, as described in D07, with factors of 2 for some observations, increasing possible uncertainties.
Figure 10 shows a series of colour-colour plots across the full wavelength range, comparing the colours of the simulated and real galaxies. Figure 11 duplicates Figures 6 and 12 in D07, showing the dependence of the “infrared excess” on the FIR and UV spectral slopes.
 |
 |
 |
 |
 |
 |
 |
 |


In general, the simulated galaxies do lie in regions of colour-colour space occupied by SINGS galaxies of type Sb-Sc, which should be considered the most relevant comparison sample. However, some clear differences do exist. The most obvious is that the simulated galaxies seem to be a less diverse sample than the real galaxies, occupying a smaller range of colour-colour space. This is not unexpected given the small range of galaxy types considered (see Section 2.5). A second, more fundamental, difference is the visible displacement of the models from the SINGS galaxies in some colours.
The most glaring difference between the models and the SINGS galaxies is in the flux ratio, where the simulations have systematically lower flux ratios by about a factor of 4. However, there are clear inconsistencies between different observational samples in this colour, as is clear by the location of the SLUGS galaxies of Willmer et al. (2009). The SLUGS galaxies, while similar to the SINGS galaxies in their ratios, have systematically lower flux ratios that are more in agreement with the outputs from our simulations. This potential discrepancy and its origin will be discussed further below.
Clear differences with the SINGS sample also exist in the PAH region, where the simulations have too low and flux ratios. At MIPS wavelengths, the simulations are also displaced slightly low in and high in compared to the Sb-Sc SINGS galaxies. More subtly, while the simulations do lie in a region of space occupied by the SINGS galaxies, they appear to be slightly too blue in the GALEX FUV/NUV colour, slightly too red in , and slightly too blue in . This is also seen in the left panel of Figure 11 where the simulations have a too flat UV slope (too blue UV colours).
In all diagrams in Figures 10 and 11, a faint trail of simulations can be seen displaced from the main locus, especially in the UV and FIR plots. This locus arises from the G0 simulation, which has a very low star-formation rate. As mentioned in Section 2.5, this low SFR results in strong variations due to the stochastic implementation of star formation in the simulations. The star-formation rate of the G0 galaxy is about , the mass of the star particles created in the G0 simulation is . This means one star particle is spawned about every . Since the MAPPINGS particles have a lifetime of , this means that there will be on average 1/3 such particles at any given time. When such a particle is present, it will dominate the UV—and consequently also the IR—luminosity of the galaxy, but when no such particle is present, the IR colours will be very cool, thus giving rise to severe fluctuations in the SED. The simulations are unable to sample the population of young stars in the G0 galaxy adequately at the current resolution, so their SEDs are much more uncertain than that of the other galaxy models.
A qualitatively different kind of comparison is to compare the SEDs on a galaxy-by-galaxy basis. Such a comparison is valuable as it can provide clues to the nature of the systematic differences shown in the colour-colour plots. For each of the simulations, the SEDs at a time of , for all inclinations, were compared to the SEDs of the SINGS galaxies after normalizing the fluxes in the K-band. (The exception is the G0 galaxy. Due to the stochastic effects in its SED, we extended the matching to all times during the evolution.) The best matches are shown in Figure 12. Due to the small number of SINGS galaxies with data, and the systematic discrepancy between the simulations and the SINGS sample in the SCUBA band, we have not required a point to be present.
| Sbc+ | Sbc |
|---|---|
 |
 |
| Sbc | G3 |
 |
 |
| G2 | G1 |
 |
 |
| G0 | |
 |
In general, the agreement is good, surprisingly so as these simulations were not intended to be exact copies of existing galaxies. The UV-NIR SED can generally be matched very well, with the discrepancies matching those found in Figures 10 and 11. For example, the high FUV/NUV ratio can be seen to be due to the model producing an excessively strong feature in several of the galaxies. The most obvious discrepancy in the comparisons is that most SINGS spirals seem to have FIR SEDs which peak at longer wavelengths (is cooler) than the simulations, leading to the observed and offsets. Somewhat surprising, the best match to the G3 & G2 simulations are the elliptical galaxies NGC855 and NGC4125, which have shorter peak wavelengths more in line with the simulations. However, these ellipticals are unusual in the sense that they have detectable neutral gas and blue stellar populations and are clearly not classical red and dead ellipticals.
4.2 Emission Lines as Star-Formation Indicators


In the discussion so far, we have focused on broadband features of the SED. One of the major advantages made feasible with the high wavelength resolution of our model and the use of the mappingsiii models of H ii regions, however, is the inclusion of emission lines. In the context of galaxies, the foremost interest in emission lines is from their use as star-formation rate indicators. For the line, this was already done in Jonsson (2004) but, as discussed in Section 2.2, the mappingsiii models include all important emission lines from H ii regions. Thus we will now compare the emission line strengths of the simulated galaxies with star-formation rate calibrations from the literature.
Figure 13 shows the -derived SFR in the simulations using the calibration from Kennicutt (1998). Without dust correction, the SFR for the massive galaxies is underestimated by factors of several. When the luminosity is corrected for dust attenuation using the / line ratio (Calzetti et al., 1994), the SFR is, on average, predicted fairly well, but the scatter in the derived SFR is still about an order of magnitude.
Another important star-formation indicator, used for higher-redshift observations, is the line. Because the luminosity of this line depends on metal abundance and the ionization state of oxygen atoms, its relationship with star formation rate is more complicated, but these effects are included in the mappingsiii models. Figure 14 shows the star-formation rate derived from the luminosity of this line, again using the calibration of Kennicutt (1998). As this line is at much shorter wavelengths, dust attenuation is more severe and for the larger galaxies, the star-formation rate can be underestimated by almost two orders of magnitude. After applying the same dust correction as for the line (because of the way the SFR from the line was calibrated, Kennicutt 1998 claims the dust correction should be for the attenuation at ) the scatter is reduced to about one order of magnitude, but there is now a tendency to systematically overestimate the SFR.
With these proof-of-concept examples of the capabilities of our model, we defer a systematic study of the sensitivity of emission lines to dust attenuation, and the prospects of correcting for these dust effects, to a future paper.
4.3 Spatially Resolved Quantities
In our presentation of the results so far, we have shown that our model galaxies have realistic integrated spectra in comparison to real galaxies. However one of the strengths of sunrise is that it creates 2-dimensional spectra. So we now go beyond this and put the model through some more stringent tests by looking at spatially resolved spectral quantities. Even if the integrated spectra are realistic, the agreement may break down when looking at individual regions in the galaxies.
The spatial variations of the dust emission in the SINGS galaxies was studied by Bendo et al. (2008), who investigated emission from PAHs, measured at , hot dust at , and cold dust at . They found that the PAH surface brightness ratio exhibited significant scatter, but was generally higher in the diffuse interstellar medium and lower in bright star-forming regions with high surface brightness. The PAH emission was well-correlated with emission, with generally larger surface brightness ratio in regions that are brighter in . They interpreted these results as indicating the PAHs were mostly associated with the cold, diffuse dust that dominates the flux.
We have repeated this analysis with our model galaxies. The analysis was restricted to the face-on galaxies to match the galaxies in the Bendo et al. (2008) sample, and the pixel size set to (the pixel size in Bendo et al. (2008) varied between 0.7 and , but we saw no significant dependence on pixel size in our simulations). The results are shown in Figure 15 and are directly comparable to Figures 2 & 5 in Bendo et al. (2008). As with the previous figures, we show the distribution of and ratios as greyscale density plots due to the large number of pixels across the galaxies.
The ratio agrees well with the observed galaxies, but the ratio is too steep, increasing to too large values in regions with lower brightness. This is most likely a manifestation of the sunrise dust model not including stochastically heated dust grains. These grains contribute strongly to the flux at , which is underestimated. Simulations using the DL07 templates, which include stochastically heated grains, for emission agree better with the observational ratios at low surface brightnesses.


4.4 Model Sensitivities
In the previous sections we have shown how well our models produce realistic spectra compared to observed galaxies, with some noticeable offsets. Yet as mentioned in Section 2, there are several free parameters that can affect the outputs of the models, that we have chosen to fix to reasonable (and sometimes physically-based) values. In this section, we explore how sensitive the model outputs are to these various free parameters. If the model is insensitive to the exact value of a parameter, it generally gives an indication that the model is robust to perturbations in the parameters. On the other hand, it also means the parameter is largely unconstrained and leaves the possibility that the parameter may influence the outputs in some way that has not been tested. Conversely, if the model reacts sensitively to changing a free parameter, this makes it possible to tune the parameter but instead leaves open the possibility that the parameter may not be appropriate in another situation (for example in merger-driven starburst galaxies as opposed to the isolated, quiescently evolving galaxies shown here).
In the following figures (16 – 19) we use Figures 10 and 11 as bases for comparison and explore the effects on the Sbc galaxy simulation when changing a free parameter, keeping the other free parameters fixed to their fiducial values. In all plots we show the effect of the free parameter for the 13 different inclinations modelled (face-on to edge-on to opposite face-on).
The first parameter we explore here is the dust size distribution. Draine & Li (2007) has three classes of distributions: Milky-Way-like, LMC-like and SMC-like size distributions, with varying amounts of small carbonaceous and silicaceous grains. Following Draine et al. (2007) and given the roughly solar metallicity of most of the simulations, we have used Milky-Way-like dust within our simulations. Changing the dust model from this dust distribution to the LMC- or SMC-type size distributions (shown and discussed in Weingartner & Draine, 2001, DL07) has a large effect on the SED, both in the UV and the IR, as shown in Figure 16. In the UV, both the LMC- and SMC-type dust have a smaller bump than MW-type dust. Since the absorption feature sits directly in the GALEX NUV band, it strongly reduces the reddening effect in the FUV/NUV bands of dust. Increasing the amount of MW dust, with its strong feature, for example by viewing the galaxy more edge-on, increases the amount of overall UV absorption but produces very little reddening in the FUV/NUV bands. SMC-type dust, in contrast, whose overall opacity is generally lower but has a steeply increasing slope towards shorter wavelengths, produces strong reddening and less overall attenuation Both of these effects are seen in the UV colour-colour diagram and in the “IR excess-UV slope” diagram (IRX-). As the feature is generated by some of the same grains that also give rise to the PAH emission features in the MIR, LMC and SMC dust also have weaker PAH emission than MW dust, as can be seen in the IRAC colour diagrams. From Figure 16 we can consider SMC-type dust unlikely for the SINGS sample based both on the FUV/NUV colours and on the PAH emission in the IRAC bands (consistent with Draine et al., 2007). LMC dust on the other hand seems like just as viable candidate as the MW-type dust, with similar IRAC colours and slightly better agreement in the FUV/NUV colour, though the cause for the offset to bluer colour is unknown.
Figure 17 shows the effect of changing , the amount of PAH grains in the log-normal components of the size distributions of DL07. This parameter goes from to 0, corresponding to a mass fraction of PAH grains, , of 4.58% to 0.47%. Changing the PAH fraction has a small effect on the SED except in the mid-IR “PAH” region. As expected, models with lower amounts of PAH grains have weaker PAH emission features, leading to higher and ratios. However, this change is parallel to the locus of observed galaxies in these colours, so it does not mitigate the offset between the models and observations in the IRAC bands. More surprisingly, changing the PAH fraction does not significantly change the strength of the feature in the NUV band.
The effect of changing the mappingsiii cluster mass from the fiducial value of to is shown in Figure 18. This only affects the SED of the star-forming regions, and has a small effect on the overall SED except in the colour, where the higher cluster mass leads to more “compact” clusters and hence to a bluer (hotter) colour. This can be expected, as the band is where the fraction contributed by the star-forming regions is the greatest.
The other free parameter in the mappingsiii particles is the PDR fraction. As with the cluster mass, changing this parameter from its fiducial value of 0.20 to smaller or larger values has only a small effect on the overall SED, as shown in Figure 19, most due to the weak overall contribution of the mappingsiii particles. A smaller PDR fraction does result in slightly bluer FUV/NUV and colours, as the H ii regions and their hot, young stars are more exposed, while the change to the PAH region is minimal as it is dominated by diffuse PAH emission. If the PDR fraction is changed to unity, no light from the star-forming regions can escape unattenuated, and the colours become significantly redder, both in the FUV/NUV and bands.
The final ‘tunable’ parameter of the model is the PAH emission template fraction , whose variation is shown in Figure 20. Since this parameter expressly changes the way the emission in the PAH features is calculated, its effect is mostly in the IRAC bands. A larger results in stronger PAH features, moving the simulations to redder , and colours. As with the amount of PAH grains , this change is parallel to the locus of the SINGS galaxies and can not be used to improve the agreement with the observations. However, also affects the colour in such a way that values other than the fiducial moves the simulations away from the region occupied by the Sb-Sc SINGS galaxies, helping to constrain the value of this parameter.
Another important check is to verify that the use of a thermal equilibrium approximation for the dust grains does not have a large influence on the results. For this purpose, the alternative way of calculating the dust emission spectrum, using the precomputed SED templates of DL07 as explained in Section 2.4, was also included in sunrise. We compare the two IR SEDs in Figure 21. In general the match is good, with both the PAH features and the IR bump very similar. Yet they disagree in several details, the most significant being the overall shift of the DL07 IR bump to shorter (hotter) wavelengths, leading to a visible decrease in the sub-mm flux. There are also significant offsets around and below . The latter offset has little effect on the overall SED due to the increasing stellar contribution, except in the PAH feature.
As the IR SEDs are so similar, the change does not have a large impact on the flux ratios shown in Figure 22. The region does not fall in any of the included filter bands and is not seen (though this offset would be visible in Spitzer IRS spectra). A large offset () in the IRAC band is clearly visible. This arises from the stronger PAH emission feature in the DL07 dust relative to the Groves et al. (2008) template, which, apart from this feature, appears to agree very well. Which of the templates (if either) have the correct strength of this feature is unclear.
The largest offset in the IR appears in the colour (the bottom row of Figure 22) due to the slight shift in the IR peak. This shift leads to the visibly lower flux, slightly lower flux and slightly increased flux in Figure 21 and the offset seen in the colour-colour diagram. Interestingly, all this means that using the DL07 templates increases the flux ratio by only about compared to the standard thermal equilibrium emission, leaving a still significant offset with the SINGS galaxies, while making the colour too blue to match the SLUGS sample.
The parameters shown in the Figures mentioned above are not an exhaustive list, of course. We have also verified that parameters controlling the Springel & Hernquist (2003) multiphase model have negligible effect on the galaxy SED. As the gas densities in these quiescently star-forming galaxies are mostly below or around the threshold density for star formation (Cox et al., 2006), there is little mass at densities where the multiphase medium develops and the details of this treatment have little effect. The situation is dramatically different in gas-rich merging galaxies, where the multiphase model has a strong effect on the emerging SED (Younger et al., 2009).
The SED is also surprisingly insensitive to moderate changes in the overall fraction of metals that are assumed to be in dust grains, which are largely degenerate with viewing the galaxies at different inclinations. For higher dust/metal ratios, the maximum infrared excess is slightly higher, while the UV reddening is almost unchanged.
In addition to the parameters discussed above, a number of other parameters were examined for completeness. As these show no significant effects, the figures have been omitted. These additional tests include the effect of setting the radii of the mappingsiii particles to (as discussed in Section 2.3), and the effect of dropping the mappingsiii particles altogether (i.e. using only the Starburst99 models.
 |
 |
 |
 |
 |
 |
 |
 |
 |
 |
 |
 |
 |
 |
 |
 |
 |
 |
 |
 |
 |
 |
 |
 |
 |
 |
 |
 |
 |
 |
 |
 |
 |
|
 |
 |
 |
 |
 |
 |

 |
 |
 |
 |
 |
 |
 |
 |
5 Discussion
The previous sections have shown that, given a realistic hydrodynamic galaxy simulation, sunrise can produce broad-band images that look remarkably similar to those of real galaxies, such as found in the SDSS database, and integrated galaxy SEDs that both appear physical and have colours similar to observed galaxy samples.
Yet there are noticeable differences between the modelled images and spectra and the data from the observed galaxies that need to be considered. A lot of the issues with the images arise due to the resolution of the simulation themselves. The high mass of the stellar particles means that the radiation field is very concentrated, especially when considering the youngest populations, leading to the very “spotty” UV and images in Figure 7.
The offsets in the colour-colour diagrams of Figure 10 are more perplexing, requiring a wavelength-by-wavelength approach. The offset in the UV colours, visible both in the top left of Figure 10 and in the IRX- diagram in Figure 11 can have several possible causes, the most likely being variation in the type of dust, as shown in Figure 16. It is clear that the UV is very sensitive to the type of dust, which results from the strong dependence of both the UV extinction slope and the feature (which falls directly in the GALEX NUV band) on the dust size distribution, as discussed in the previous section. Large values of the MAPPINGS PDR fraction can also, as shown in Figure 19, significantly affect the UV colours, but such large values are probably unrealistic in isolated galaxies.
The UV/optical colours are also sensitive to recent star formation history (SFH), and hence the offset could also be due to differences between the simulated galaxy SFH and the real galaxy SFHs. Though the simulations are assumed to have nearly constant or slowly declining star-formation rates, it is possible the SINGS galaxies have a sufficiently different SFH that this could explain the offsets in the optical bands (i.e. BVR diagram, top right Figure 10 or V-Ks colour). These offsets result not from the attenuation calculations of sunrise (which move the galaxies in parallel to the SINGS sample), but rather directly from the Starburst99 particles. Thus the offset must be either model SFH or stellar population model related.
The mid-IR IRAC bands are again a different story. The IRAC1 band is mostly dominated by stellar light, but when compared to the Ks band, we can see the sensitivity to the other contribution to the band, the PAH feature (Figure 21), with this colour suggesting we are in the right “ballpark” at least for this (non-Spitzer-IRS observed) PAH feature. The offset in the IRAC-IRAC colour diagrams is interesting. The IRAC3/IRAC1 () and IRAC4/IRAC1 () colours are sensitive to the fraction of PAHs (or at least their emission), as seen in Figures 16, 17 & 20. These figures suggest that the dispersion in the SINGS galaxies in these colours may be related to a variation in PAH abundance. However, the offset between the models and the SINGS sample in the IRAC diagrams is almost perpendicular to the impact of these changes. This suggests that the PAH template itself is incorrect, leading to an offset in the IRAC3/IRAC4 () colour. This is interesting, as this offset exists for both the Draine & Li (2007) and Groves et al. (2008) PAH templates, both of which have been matched to Spitzer-IRS spectra of the PAH features (Draine et al., 2007; Groves et al., 2008). Hence, it is uncertain if either the templates or the observations are incorrect. It is also possible emission from an AGN in some of the SINGS galaxies affects these fluxes, but the lack of clear differences between e.g. Seyferts and star-forming galaxies argue against this possibility.
The MIPS colours seem reasonable in Figure 10. While the and model colours are somewhat offset, they still fall into reasonable ranges based on the observations. Any offset that does exist is most likely due to the lack of stochastic dust in sunrise (as can be seen in Figure 21). This also explains the offset spatially-resolved colours in Figure 15. Similarly, the colours of the models match those of the SINGS sample.
At yet longer wavelengths, we have the greatest offset from the SINGS galaxies with the discrepancy, whose origin is puzzling. The SINGS and SLUGS samples have very different far-IR characteristics, with the SINGS galaxies being seemingly deficient in cold dust. It is possible this is because of different sample selection criteria, in particular that the low detection rate at for the SLUGS galaxies is biasing their sample to galaxies with large amounts of cold dust (Willmer et al., 2009). However, it is important to remember that the SINGS sample is also not a statistically unbiased sample.
That the intensity of the radiation heating the dust grains is at the origin of the different values, is (at least partially) supported by our simulations. Draine et al. (2007) found that the dust emission SEDs of the SINGS galaxies could be fit by having most dust heated by an intensity slightly larger than the local ISRF (typically 2–, their Figure 7) plus a mass of dust at higher intensities scaling as . In no case did their SED fits include dust heated by intensities lower than . In contrast, the same fits performed on the SLUGS galaxies yield lower minimum intensities and a significantly lower fraction of dust heated by higher intensities.
In our Sbc galaxy, the diffuse ISM dust that sees intensities higher than also declines roughly as , but of the dust mass is heated by intensities , very different from the SINGS results. If all dust heated by intensities is instead assumed to emit as if the intensity was , the flux ratio is increased. Removing the emission from dust in low intensities lowers the emission by , but the flux ratio is still a factor of 2 lower than the SINGS galaxies. Thus, the presence of dust at can only be one of the factors contributing to the discrepancy with the SINGS galaxies.
Another factor is that the simulations presented here are missing dust at much higher intensities. In the fits by Draine et al. (2007), the distribution continues up to values of – , while the maximum intensity in the diffuse ISM is . The mappingsiii models are supposed to model the regions of higher intensity but, with the time-averaged models currently used, the PDRs have a radiation intensity of , the H ii regions themselves intensities . These intensities are not as high as those found by Draine et al. (2007). The time-averaging means that the highest-intensity early times are diluted. Another factor is that the mappingsiii models used here currently do not include ultra-compact H ii regions, that represent the dust around the individual stars (rather than the cluster as a whole). At early times, each individual star is expected to be surrounded by a very compact H ii region where dust can absorb a significant fraction of the ionizing photons (Churchwell, 2002; Dopita et al., 2003). As seen in Groves et al. (2008), these contribute significantly to the hot dust emission (i.e. high ). Including these ultra-compact H ii regions is a topic that will be addressed in future versions of sunrise.
It is an open question why the low-end heating intensities in the simulations should differ so much from the SINGS galaxies. As discussed above, a lack of higher heating intensities in the diffuse ISM of the simulations is to be expected due to their limited resolution and should be taken partly into account by the mappingsiii models. However, explaining a lack of dust at low intensities is more difficult. The only obvious missing source of cold dust in the simulations is dense, self-shielded clumps without internal sources, which are currently not included in the model. This means that the cold dust in the simulations must be in regions with little starlight, presumably at large radii in the disk. What drives the differences in far-IR SEDs between the SINGS and SLUGS samples is not clear, but investigating how the distribution of heating intensities depends on different properties of the simulated galaxies is a promising avenue for progress.
Finally, the full SEDs in Figure 12 show not only the offsets on an SED basis, giving a nice physical picture for the simulation SEDs, but also the issues in matching the simulation SEDs to the observations. For example, it is possible to match the IR or UV separately using the models, but matching the full SED is difficult, with many of the match optical-UV galaxies actually having different peaks of their IR (different average dust temperature).
The thing to remember throughout all these comparisons, especially the SED matching, is that these are simulations based on observations of real galaxies, not modelling individual real galaxies. Hence, to find small mismatches between the simulations and observations is quite reasonable. However, being based on real galaxies (such as the Sbc galaxies representing late-type spirals), we should expect these to fall within the same regions of parameter space as the SINGS galaxies. Yet disentangling the issues arising from the hydrodynamic simulations, the modelling of the source light (Starburst99 and mappingsiii), the sunrise radiative transfer, and even issues with selection effects of various observed samples are complex, making such comparisons useful, but ultimately difficult to interpret.
6 Summary & Future Expansions
We have presented in this work an updated version of the radiative transfer code sunrise that is able, given a hydrodynamic model of a galaxy, to model the 2-dimensional UV-IR spectrum of a galaxy, that can be used to create images in any bands or emission lines, or integrated galaxy SEDs. We have detailed how this code creates such models, using the outputs from the stellar population synthesis code Starburst99, the radiative transfer code mappingsiii, and including a polychromatic ray tracing algorithm and dust heating algorithm. Through various tests we have validated the output of this code, demonstrating its convergence, consistency and conservation of energy.
Using sunrise and hydrodynamic galaxy simulations of Cox et al. (2006), we have created 2D SEDs for 7 different galaxy models at different evolutionary times and inclinations. We have used these galaxies as both demonstrations of the sunrise capabilities and as test cases, comparing the outputs with the multiwavelength SINGS (Dale et al., 2007) and SLUGS (Willmer et al., 2009) datasets.
This comparison showed an overall good match creating similar colours to the observed SINGS sample, with only slight offsets. The exception is the colour, which the simulations underestimate by a factor compared to the SINGS sample, but which agrees better with the SLUGS sample. These large differences between different observed samples makes it difficult to evaluate whether this discrepancy is a failure of our model or an expression of some selection effect in the observed samples.
We have also shown the sensitivity of these results to the “free parameters” of the sunrise model, demonstrating the relative insensitivity to uncertain parameters, such as the photodissociation covering factor, and the deterministic sensitivity to other parameters that are expected to vary, such as the PAH fraction.
In all, we have shown in this paper both the viability and veracity of the code, which can be used in theory with any hydrodynamic galaxy simulation to produce the spectra of galaxies.
However, there are clearly still several issues or areas that remain outstanding with the code that we still plan to address. Some of the direct problems we have already discussed in the main text. One of the current issues in the model is the lack of treatment for the cold phase ISM. As discussed in Section 2.3, these dense clumps are currently ignored within the current version of sunrise due to their typically low filling-factor. Yet to extend the code to treat all galaxy situations, a treatment is needed, with our current idea being to treat these dense clumps using a “megagrains” formalism (Hobson & Padman, 1993).
Another issue is the current time-averaging of the mappingsiii particles. While the resolution of the stellar particles used here mean that such time-averaging is a reasonable approximation, as the treatment of the stellar particles gets better, this time averaging approximation breaks down, and we will need to include the full time-resolution available from the Groves et al. (2008) models. This will also lead to a finer sampling of the emission lines, allowing time-dependence of emission line strengths to be checked.
Another clear lack is the small range of galaxy simulations dealt with in this work. While representative of “normal” galaxies, these simulations do not represent the extreme situations which test the sunrise code. sunrise is also being used for simulations of gas-rich galaxy mergers at high redshift (e.g. Narayanan et al., 2009; Younger et al., 2009). In these, the complex geometries, high star-formation rates and high dust columns all provide more stringent tests of the models. The larger optical depths will also require a more stringent evaluation with respect to the double counting issue and overlapping mappingsiii particles, and due to the much larger filling factor of dense clumps in such simulations, the treatment of the multiphase ISM clumps must be included. Detailed comparisons of such simulations with observed luminous infrared galaxies is planned in a future paper.
In addition, these mergers also lead into one of the features currently lacking in sunrise, active galactic nuclei (AGN). These strong nuclear sources can clearly contribute to, if not dominate, a galaxies SED. Many hydrodynamic simulations (e.g. Springel et al., 2005; Di Matteo et al., 2005) include these, needing the AGN feedback to help blow out the gas and quench the star formation to make the colours of the merger remnant consistent with observed early-type galaxies. However, due to the difficulties in disentangling the galaxy emission from the ‘AGN’ emission, the interface problem between the AGN “source particle” and the galaxy ISM will be even more severe than for the mappingsiii models used here and, unlike for stars, a simple UV-IR spectral model for AGN does not exist.
One issue not mentioned throughout the text is that of the spectral resolution of the models. Currently, the spectrum is divided into bins, with higher resolution in the UV-optical, with fine emission line resolution, and becoming much coarser in the IR. This resolution is basically defined by the radiative transfer within the mappingsiii models. Yet much higher spectral resolution is possible, thanks to the polychromatic rays of sunrise, and runs with more than 13,000 wavelengths covering the UV/optical wavelengths, enough to clearly resolve stellar absorption lines, have been tried successfully. With this high resolution, including kinematic effects in the radiation transfer calculation is a natural addition that would make it possible to compare simulations to increasingly common IFU observations of kinematics in severely dust-obscured merging galaxies. The polychromatic algorithm used by sunrise lends itself naturally to the inclusion of kinematics, and such an improvement is planned.
Finally, the treatment of the dust grains themselves, always an unknown, is an ongoing work. Our current idea is to allow a more physical basis for the dust – linking closely the details of the local environment, such as metallicity, radiation field (including hard spectrum AGN), clumpy versus diffuse ISM, etc., with the details of the dust, such as the PAH fraction (as done within Groves et al., 2008), or dust size distribution (i.e. Milky Way versus LMC). In the future this could be expanded to track dust types separately (ie silicaceous versus carbonaceous dust) following the pollution events of the ISM (ie SN versus AGB star enrichment).
sunrise is currently a state-of-the-art radiative transfer code, suitable for the production of realistic UV-IR SEDs and images from hydrodynamic simulations, and with these improvements its applicability will only increase.
Acknowledgements
The authors are grateful for the hospitality of the Max-Planck Institut für Astrophysik in Garching, where part of this paper was written. We also thank Tom Abel, Fabio Governato, Chris Hayward, Desika Narayanan, Jennifer Lotz, Yuexing Li, Greg Novak, and Joel Primack for enduring long discussions about various aspects of our model, and Chris Willmer for providing an electronic sample of the SLUGS galaxies.
PJ was supported by Spitzer Theory Grant 30183 from the Jet Propulsion Laboratory and by programs HST-AR-10678/10958/11758, provided by NASA through grants from the Space Telescope Science Institute, which is operated by the Association of Universities for Research in Astronomy, Incorporated, under NASA contract NAS5-26555.
This research used computational resources of the NASA Advanced Supercomputing Division (NAS) and the National Energy Research Scientific Supercomputing Center (NERSC), which is supported by the Office of Science of the US Department of Energy.
References
- Baes et al. (2005) Baes M., Stamatellos D., Davies J. I., Whitworth A. P., Sabatini S., Roberts S., Linder S. M., Evans R., 2005, New Astronomy, 10, 523
- Bendo et al. (2008) Bendo G. J., Draine B. T., Engelbracht C. W., Helou G., Thornley M. D., Bot C., Buckalew B. A., Calzetti D., Dale D. A., Hollenbach D. J., Li A., Moustakas J., 2008, MNRAS, 389, 629
- Bianchi (2008) Bianchi S., 2008, A&A, 490, 461
- Bianchi et al. (2000) Bianchi S., Ferrara A., Davies J. I., Alton P. B., 2000, MNRAS, 311, 601
- Bjorkman & Wood (2001) Bjorkman J. E., Wood K., 2001, ApJ, 554, 615
- Calzetti (1997) Calzetti D., 1997, AJ, 113, 162
- Calzetti et al. (1994) Calzetti D., Kinney A. L., Storchi-Bergmann T., 1994, ApJ, 429, 582
- Ceverino & Klypin (2009) Ceverino D., Klypin A., 2009, ApJ, 695, 292
- Chakrabarti et al. (2008) Chakrabarti S., Fenner Y., Cox T. J., Hernquist L., Whitney B. A., 2008, ApJ, 688, 972
- Chakrabarti & Whitney (2009) Chakrabarti S., Whitney B. A., 2009, ApJ, 690, 1432
- Charlot & Fall (2000) Charlot S., Fall S. M., 2000, ApJ, 539, 718
- Churchwell (2002) Churchwell E., 2002, ARA&A, 40, 27
- Cox (2004) Cox T. J., 2004, PhD thesis, University of California, Santa Cruz
- Cox et al. (2006) Cox T. J., Jonsson P., Primack J. R., Somerville R. S., 2006, MNRAS, 373, 1013
- Cox et al. (2008) Cox T. J., Jonsson P., Somerville R. S., Primack J. R., Dekel A., 2008, MNRAS, 384, 386
- da Cunha et al. (2008) da Cunha E., Charlot S., Elbaz D., 2008, MNRAS, 388, 1595
- Dalcanton et al. (2004) Dalcanton J. J., Yoachim P., Bernstein R. A., 2004, ApJ, 608, 189
- Dale et al. (2007) Dale D. A., Gil de Paz A., Gordon K. D., Hanson H. M., Armus L., Bendo G. J., Bianchi L., Block M., Boissier S., Boselli A., Buckalew B. A., Buat V., Burgarella D., Calzetti D., Cannon J. M. e. a., 2007, ApJ, 655, 863
- Davis et al. (2007) Davis M., Guhathakurta P., Konidaris N. P., Newman J. A., Ashby M. L. N., Biggs A. D., Barmby P., Bundy K., Chapman S. C., Coil A. L., Conselice C. J., Cooper M. C., Croton D. J. e. a., 2007, ApJ, 660, L1
- Di Matteo et al. (2005) Di Matteo T., Springel V., Hernquist L., 2005, Nature, 433, 604
- Dopita et al. (2006) Dopita M. A., Fischera J., Sutherland R. S., Kewley L. J., Leitherer C., Tuffs R. J., Popescu C. C., van Breugel W., Groves B. A., 2006, ApJS, 167, 177
- Dopita et al. (2005) Dopita M. A., Groves B. A., Fischera J., Sutherland R. S., Tuffs R. J., Popescu C. C., Kewley L. J., Reuland M., Leitherer C., 2005, ApJ, 619, 755
- Dopita et al. (2003) Dopita M. A., Groves B. A., Sutherland R. S., Kewley L. J., 2003, ApJ, 583, 727
- Draine et al. (2007) Draine B. T., Dale D. A., Bendo G., Gordon K. D., Smith J. D. T., Armus L., Engelbracht C. W., Helou G., Kennicutt Jr. R. C., Li A., Roussel H. e. a., 2007, ApJ, 663, 866
- Draine & Li (2007) Draine B. T., Li A., 2007, ApJ, 657, 810
- Dwek (1998) Dwek E., 1998, ApJ, 501, 643
- Ferrara et al. (1999) Ferrara A., Bianchi S., Cimatti A., Giovanardi C., 1999, ApJS, 123, 437
- Gordon et al. (2001) Gordon K. D., Misselt K. A., Witt A. N., Clayton G. C., 2001, ApJ, 551, 269
- Governato et al. (2008) Governato F., Brook C. B., Brooks A. M., Mayer L., Willman B., Jonsson P., Stilp A. M., Pope L., Christensen C., Wadsley J., Quinn T., 2008, MNRAS, submitted (arXiv 0812.0379)
- Groves et al. (2008) Groves B., Dopita M. A., Sutherland R. S., Kewley L. J., Fischera J., Leitherer C., Brandl B., van Breugel W., 2008, ApJS, 176, 438
- Groves (2004) Groves B. A., 2004, PhD thesis, Research School of Astronomy & Astrophysics, Australian National University
- Hobson & Padman (1993) Hobson M. P., Padman R., 1993, MNRAS, 264, 161
- Jonsson (2004) Jonsson P., 2004, PhD thesis, University of California, Santa Cruz
- Jonsson (2006) Jonsson P., 2006, MNRAS, 372, 2
- Jonsson et al. (2006) Jonsson P., Cox T. J., Primack J. R., Somerville R. S., 2006, ApJ, 637, 255
- Juvela (2005) Juvela M., 2005, A&A, 440, 531
- Kennicutt (1998) Kennicutt R. C., 1998, ApJ, 498, 541
- Kim et al. (2009) Kim J.-h., Wise J. H., Abel T., 2009, ApJ, 694, L123
- Kimura et al. (2003) Kimura H., Mann I., Jessberger E. K., 2003, ApJ, 583, 314
- Leitherer et al. (1999) Leitherer C., Schaerer D., Goldader J. D., Delgado R. M. G., Robert C., Kune D. F., de Mello D. F., Devost D., Heckman T. M., 1999, ApJS, 123, 3
- Li & Draine (2001) Li A., Draine B. T., 2001, ApJ, 554, 778
- Li et al. (2007) Li Y., Hopkins P. F., Hernquist L., Finkbeiner D. P., Cox T. J., Springel V., Jiang L., Fan X., Yoshida N., 2007, ApJ, submitted (arXiv:0706.3706), 706
- Lotz et al. (2008) Lotz J. M., Jonsson P., Cox T. J., Primack J. R., 2008, MNRAS, 391, 1137
- Lucy (1999) Lucy L. B., 1999, A&A, 344, 282
- Lupton et al. (2004) Lupton R., Blanton M. R., Fekete G., Hogg D. W., O’Mullane W., Szalay A., Wherry N., 2004, PASP, 116, 133
- Mathis et al. (1983) Mathis J. S., Mezger P. G., Panagia N., 1983, A&A, 128, 212
- Meurer et al. (1999) Meurer G. R., Heckman T. M., Calzetti D., 1999, ApJ, 521, 64
- Misselt et al. (2001) Misselt K. A., Gordon K. D., Clayton G. C., Wolff M. J., 2001, ApJ, 551, 277
- Narayanan et al. (2009) Narayanan D., Hayward C., Cox T. J., Hernquist L., Jonsson P., Younger J., Groves B., 2009, ApJ, submitted
- Pascucci et al. (2004) Pascucci I., Wolf S., Steinacker J., Dullemond C. P., Henning T., Niccolini G., Woitke P., Lopez B., 2004, A&A, 417, 793
- Pierini et al. (2004) Pierini D., Gordon K. D., Witt A. N., Madsen G. J., 2004, ApJ, 617, 1022
- Rocha et al. (2008) Rocha M., Jonsson P., Primack J. R., Cox T. J., 2008, MNRAS, 383, 1281
- Scannapieco et al. (2005) Scannapieco C., Tissera P. B., White S. D. M., Springel V., 2005, MNRAS, 364, 552
- Silva et al. (1998) Silva L., Granato G. L., Bressan A., Danese L., 1998, ApJ, 509, 103
- Springel (2005) Springel V., 2005, MNRAS, 364, 1105
- Springel (2009) Springel V., 2009, MNRAS, submitted (ArXiv:0901.4107)
- Springel et al. (2005) Springel V., Di Matteo T., Hernquist L., 2005, MNRAS, 361, 776
- Springel & Hernquist (2003) Springel V., Hernquist L., 2003, MNRAS, 339, 289
- Springel et al. (2001) Springel V., Yoshida N., White S. D. M., 2001, New Astronomy, 6, 79
- Stinson et al. (2006) Stinson G., Seth A., Katz N., Wadsley J., Governato F., Quinn T., 2006, MNRAS, 373, 1074
- Tuffs et al. (2004) Tuffs R. J., Popescu C. C., Völk H. J., Kylafis N. D., Dopita M. A., 2004, A&A, 419, 821
- Városi & Dwek (1999) Városi F., Dwek E., 1999, ApJ, 523, 265
- Vázquez & Leitherer (2005) Vázquez G. A., Leitherer C., 2005, ApJ, 621, 695
- Weingartner & Draine (2001) Weingartner J. C., Draine B. T., 2001, ApJ, 548, 296
- Willmer et al. (2009) Willmer C. N. A., Rieke G. H., LeFloc’h E., Hinz J. L., Engelbracht C. W., Marcillac D., Gordon K. D., 2009, AJ, 138, 146
- Witt & Gordon (1996) Witt A. N., Gordon K. D., 1996, ApJ, 463, 681
- Witt & Gordon (2000) Witt A. N., Gordon K. D., 2000, ApJ, 528, 799
- Younger et al. (2009) Younger J., Hayward C., Narayanan D., Cox T. J., Hernquist L., Jonsson P., 2009, MNRAS, submitted