Shear Zone Refraction and Deflection in Layered Granular Materials
Abstract
Refraction and deflection of shear zones in layered granular materials was studied experimentally and numerically. We show, that (i) according to a recent theoretical prediction [T. Unger, Phys. Rev. Lett. 98, 018301 (2007)] shear zones refract in layered systems in analogy with light refraction, (ii) zone refraction obeys Snell’s law known from geometric optics and (iii) under natural pressure conditions (i.e. in the presence of gravity) the zone can also be deflected by the interface so that the deformation of the high friction material is avoided.
When granular materials deform under external stress the deformation is often localized into narrow regions. These shear zones fehe2003 ; feme2004 ; unto2004 ; lu2004 ; chle2006 ; feme2006 ; desa2006 ; dele2007 ; toun2007 ; un2007 ; un2007NP ; riun2007 ; safe2008 ; jo2008 ; ja2008 ; hifa2008 ; mude2000 ; gdrmidi2004 act as internal slip surfaces between solid-like blocks of the bulk. The formation of shear zones is a crucial deformation mechanism in fine powders, sand and soil (landslides). Geological faults are themselves large scale examples of shear zones. Here we study experimentally a recent theoretical prediction that shear zones behave in striking analogy with geometric optics un2007 ; un2007NP , and compare our results with numerical simulations. We show that shear zones alter their orientations when crossing media boundaries similarly to light refraction but here the frictional properties of the materials take the role of the optical refractive index. We find that the refraction phenomenon also exists in the presence of gravity, i.e. under natural pressure conditions. In certain configurations we observe another effect, namely that shear zones can be deflected by the material interface.
In the present experiments we use two materials with different frictional properties. One material is corundum which consists of angular grains
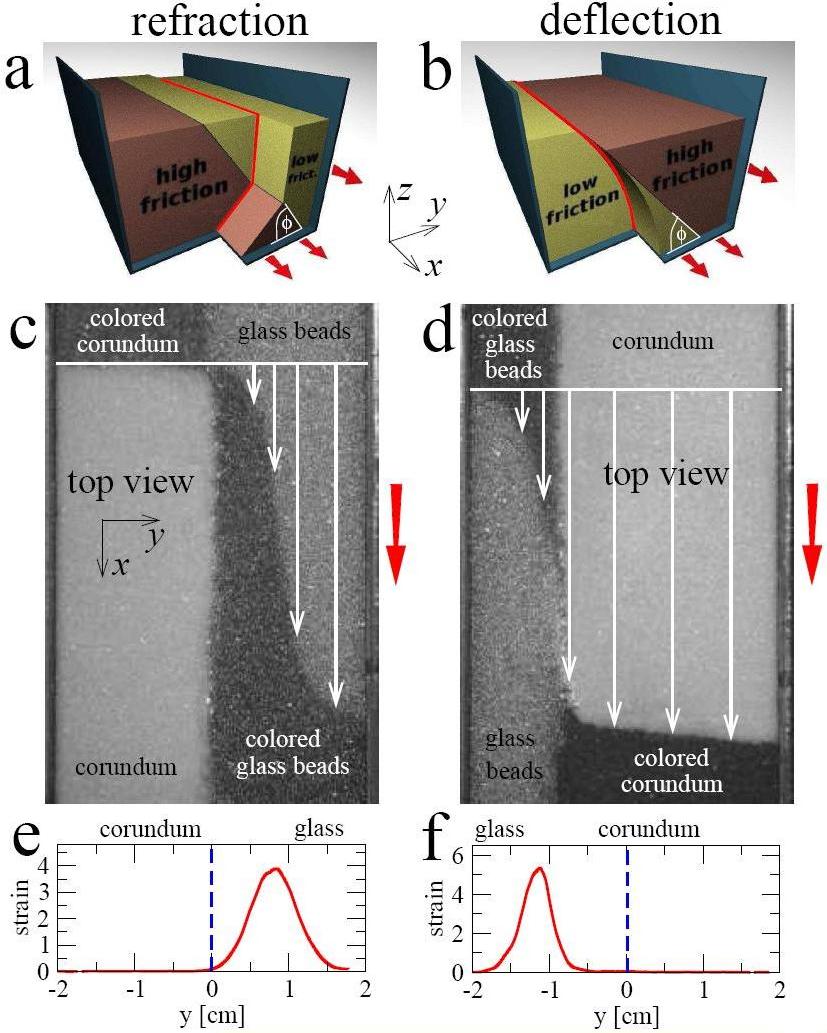
therefore it has higher effective internal friction than the other material consisting of glass beads. To characterize the difference in the internal frictions the angles of repose () were determined by the method used in boha2008 and were for glass beads while for corundum which is somewhat higher than the typical value for sand (). The ratio gives a reasonable contrast for the internal friction. The interface between the two materials (illustrated with different colors in Figs. 1(a) and 1(b)) is a tilted plane. The inclination of this tilted plane with respect to horizontal defines the interface angle . Shearing was performed in a straight split bottom cell desa2006 ; dele2007 ; riun2007 ; ja2008 with internal cross section of cm x cm. The shear cell included two 60 cm long L shaped sliders (cell wall), one of which was slowly translated in the experiments according to the red (gray) arrows (with total displacement between and cm), which creates the shear zone indicated by the red line on the sketch. The presence of the interface leads to refraction or deflection of the shear zone depending on the configuration. This is in contrast to the simple case when the cell is filled with one material and the shear zone is formed along a vertical plane riun2007 ; dele2007 ; desa2006 .
The idea of refraction for shear zones was proposed earlier un2007 and studied numerically in a special geometry with cylindrical walls and periodic boundary conditions. In that setup both ends of the shear zone were fixed and the system was sheared under constant pressure in zero gravity. These computer simulations showed that the zone changes its orientation at the interface and the extent of refraction follows Snell’s law of light refraction. With the present work we were able to reproduce the effect of refraction experimentally, moreover we show that the phenomenon exists also under more realistic circumstances. In our case the position of the shear zone is free at the top surface and gravity keeps the grains together leading to a natural pressure gradient. This geometry allowed us also to detect the effect of deflection where the interface modifies the position of the shear zone in such a way that the deformation of the high friction region is completely avoided. Deflection was not observed in the original cylindrical cell un2007 because the two ends of the zone were fixed on different sides of the interface. Therefore, the zone was forced to cross the interface and to enter the high friction material.
The deformation in our case was measured as follows. For both materials we used two samples with different colors, therefore four regions appear at the top surface as it is seen in Figs. 1(c) and 1(d) .
Two of these regions correspond to glass beads (grain size mm for the colored sample and mm for the uncolored sample) while the other two correspond to corundum (grain size mm for the colored sample and mm for the uncolored sample). Using particles with different sizes allowed the separation of samples after each experiment, but have been shown not to affect the results movie . This way not only the interface of the two materials is visualized (oriented vertically in Figs. 1(c) and 1(d)) but the displacement profile is also directly seen, as it is illustrated with white arrows in Figs. 1(c) and 1(d). The deformation of the surface layer was recorded during translation by a video camera, movies recorded during the experiments can be seen at movie . The displacement at the top surface as a function of the position was determined by digital image analysis. The corresponding shear strains (see Figs. 1(e) and 1(f)) show that the shear zones are shifted away from the split at the base of the cell. They are not in the middle (at ) where they would be in the absence of the interface i.e. for a homogeneous material.
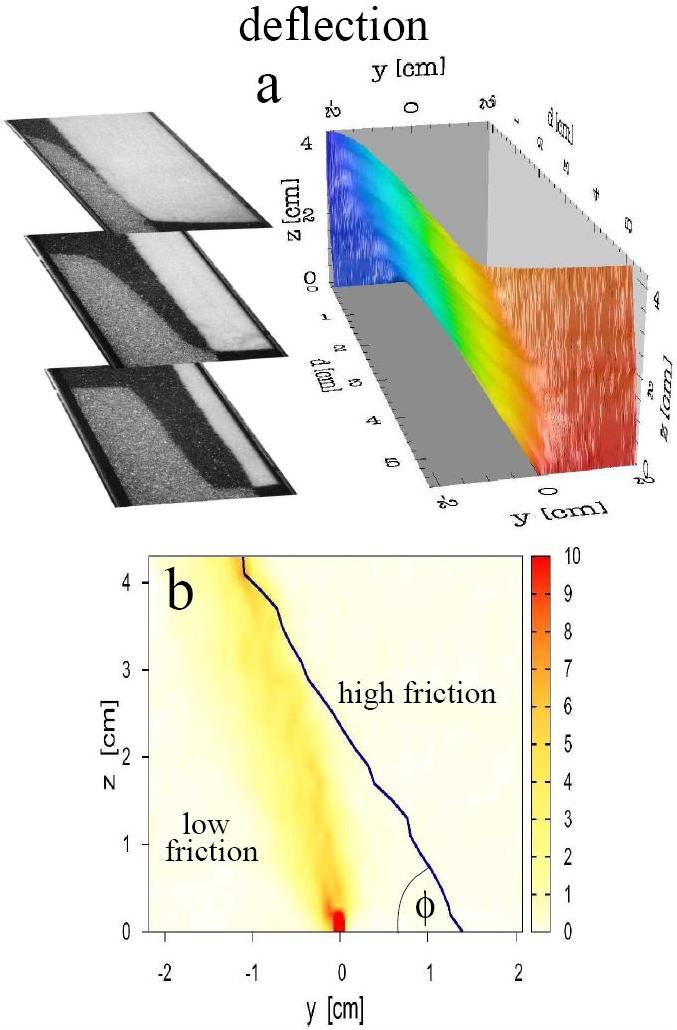
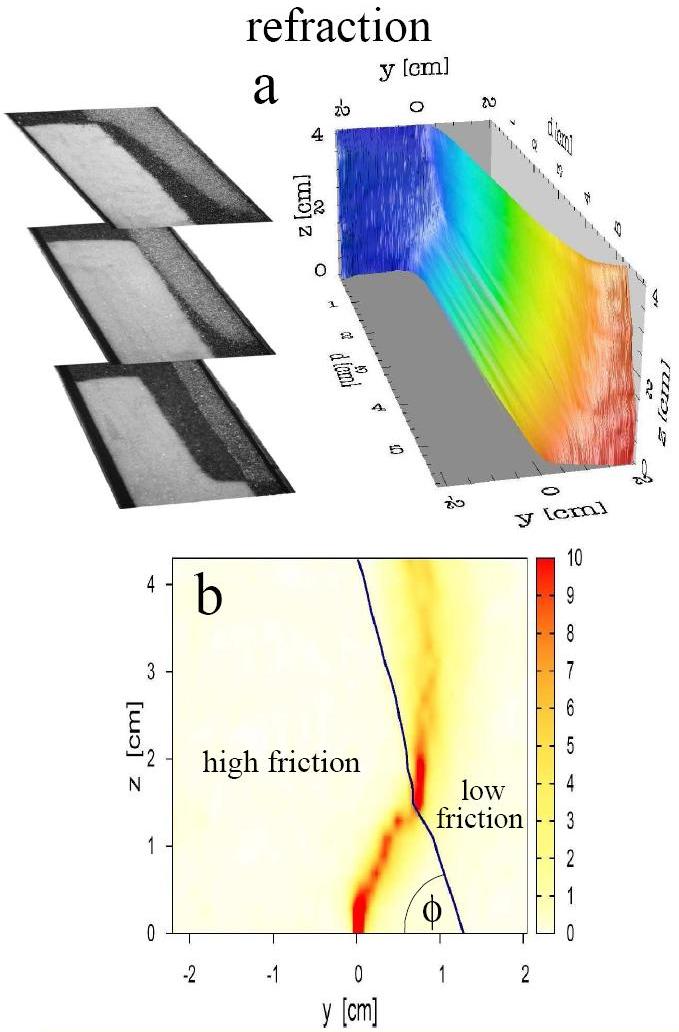
After each experiment the displacement profile in the bulk was reconstructed by removing the top surface of the material carefully layer by layer feme2006 . We used a commercial vacuum cleaner with additional extension tubes to provide a slow flow rate. The procedure takes several hours for one experiment. The displacement profiles are presented in Figs. 2(a) and 3(a) for refraction and deflection, respectively together with sample images taken during the excavation process. The gradient of the displacement provides the local shear strain inside the bulk . By plotting the shear strain as the function of position (Figs. 2(b) and 3(b)) the structure of the shear zone becomes visible. In Fig. 2(b) the zone, starting from the bottom, takes a short path towards the interface and by reaching the low friction region it changes direction abruptly and heads straight to the top. In Fig. 3(b) where the zone starts in the low friction material it deflects to avoid the high friction region even if it takes a much longer path.
The behavior can be well understood qualitatively based on a simple variational model of shear zones unto2004 ; un2007 . This model regards the shear zone as an infinitely thin slip surface and states that the shape of the slip surface is chosen according to minimum energy dissipation. For our straight geometry this is reduced to the condition that the minimization of the following integral provides the shape of the zone:
| (1) |
where the local effective friction coefficient times the local
pressure is integrated along the path that is taken by the shear zone in the --plane section. Thus not the length of the path but the length weighted by is minimized by the shear zone. This is quite similar to Fermat’s principle of optics where the length weighted by the refraction index is minimized by light beams. This analogy leads to the idea that similar refraction effects were expected in these two distant fields of physics.
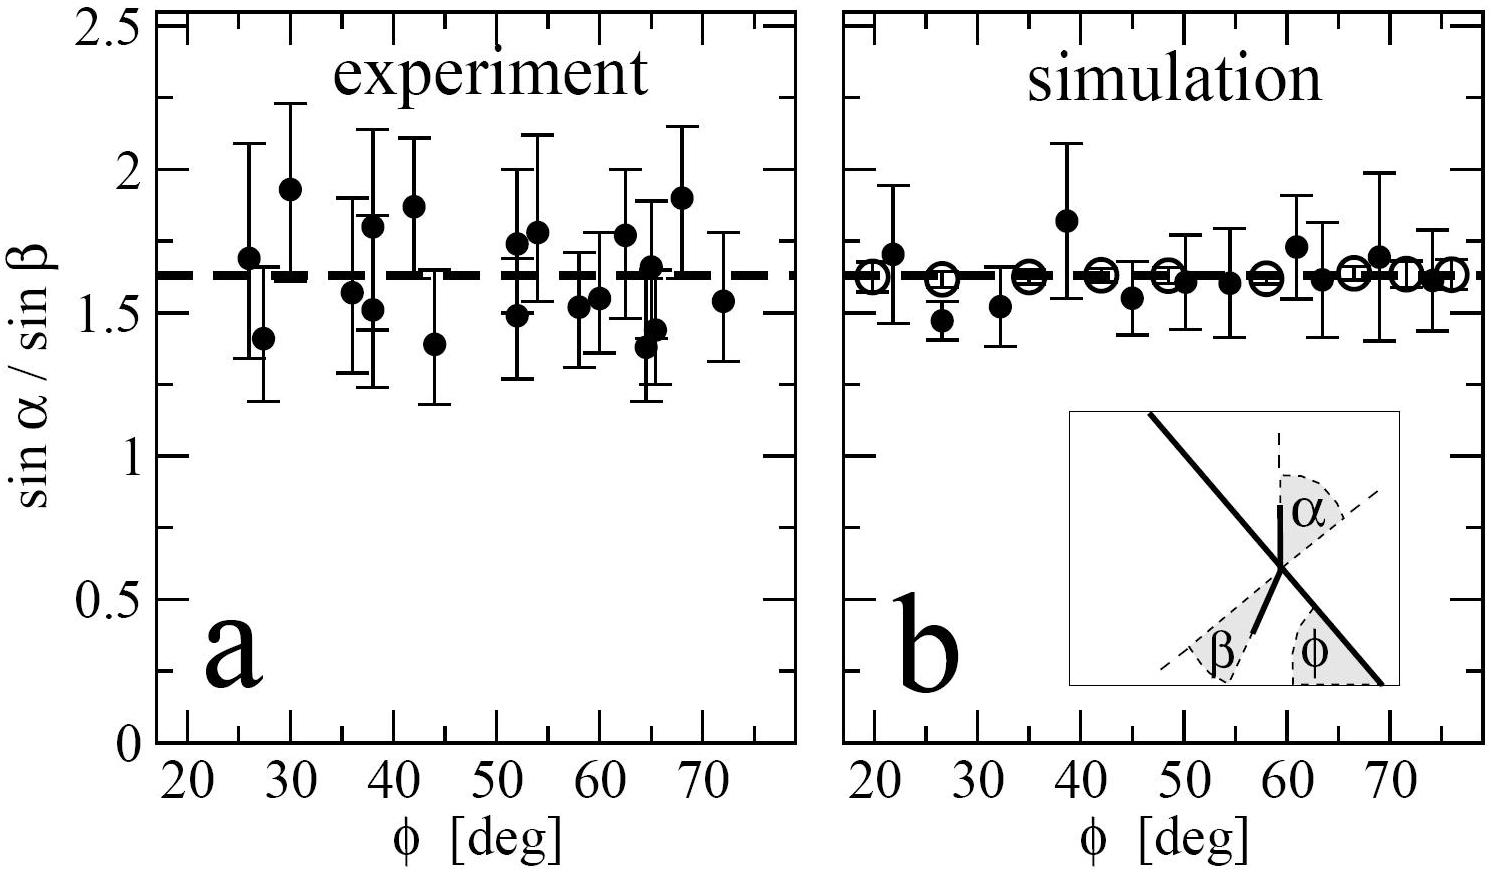
We performed experiments for numerous orientations of the interface to test whether zone refraction obeys Snell’s law known from optics, which reads in the present case. Here and are the angles of incidence (see inset of Fig. 4(b) for illustration) and the relative index of refraction is replaced by the ratio of the effective frictions un2007 . Fig. 4(a) shows as a function of the interface angle with respect to horizontal and the value of (dashed line) that was determined experimentally based on the two angles of repose boha2008 . As it is seen the data are independent of (within errors) for a wide range of and scatter around the expected value 1.63 in agreement with Snell’s law.
In order to better compare the predictions of the above concept with our experimental data we performed computer simulations based on the fluctuating narrow band model toun2007 . This method follows the concept of minimum dissipation but also takes the fact into account that the optimal slip surface has to be found in a random medium. Technically, in the simulation we search for an optimal path in a two dimensional underlying lattice which represents the cross section of the shear cell. Statistical fluctuations are introduced by random strength of the lattice-bonds. Depending on the random realization of the medium different slip surfaces are obtained. Taking ensemble average over random realizations one arrives at a continuous displacement profile instead of a thin slip surface. To incorporate the ratio of the effective frictions we use the same ratio for the average bond strength between the low and the high friction regions. There is one fit parameter in the simulation, the extent of fluctuations, which is chosen so that the width of the shear zone at the free surface approximately matches the experimental value. More details on this method can be found in toun2007 .
Numerical simulations (Fig. 4(b)) confirm with higher accuracy that matches the expected value of . Simulations also revealed, that this is true for both the absence and the presence of gravity where the pressure was taken to be constant and proportional to the depth, respectively riun2007 . In gravity the shear zone is slightly curved which is a direct consequence of the pressure gradient and makes the measurement of refraction more difficult. Under homogeneous pressure where the curvature is absent, the accuracy of data is much higher (see open circles in Fig. 4(b)).
For a more detailed quantitative comparison two simulations are shown in Fig. 5 which correspond to the experimental configurations presented in Figs. 2 and 3. The shear strain distributions obtained by
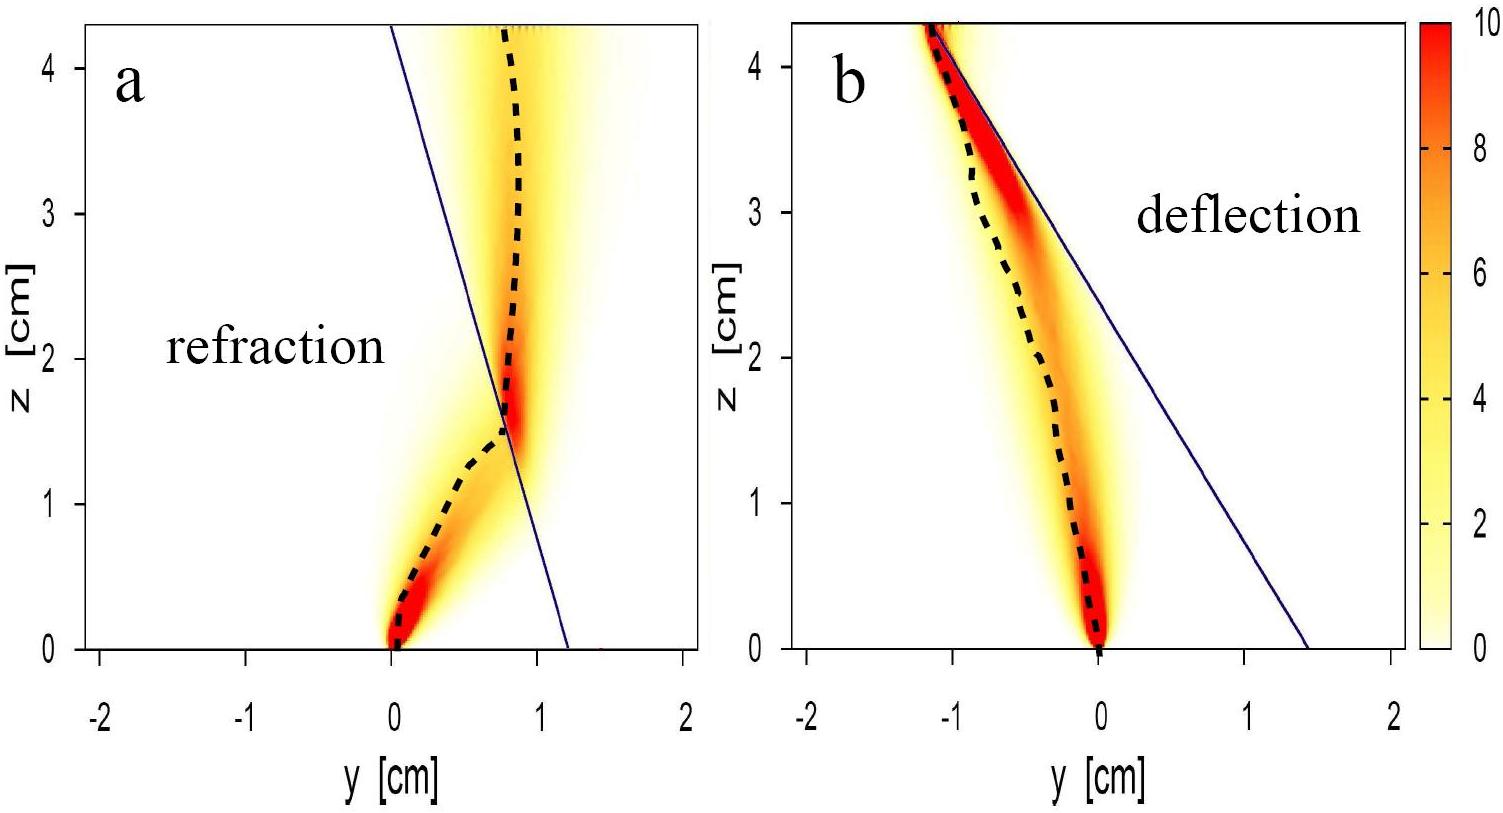
the simulation are in very good agreement with the experiments. The shape of the shear zones and other details are nicely reproduced, e.g. the largest values of the shear strain. In the case of refraction the largest strain is obtained at the bottom and right above the interface near to the refraction point, while for deflection the high shear strain is located at the bottom and at the top of the material. This latter effect leads to a narrower shear zone at the top in our second configuration (deflection) than in the first one (refraction), which is also nicely detected in the experiments - compare the width of the zone in Figs. 1(e) and 1(f). Comparing the center positions of the shear zones at the top gives also nice agreement. We obtain cm in the simulation and cm experimentally in case of refraction, while for deflection the positions are cm and cm in the simulation and experiment, respectively.
In this work we studied shear zones in granular systems where two different materials are layered on top of each other. On one hand we provided an experimental evidence of the phenomenon of zone refraction, on the other hand we found a new effect where the shear zone is deflected by the interface. For the case of zone refraction a close analogy can be drawn with light refraction in optics. Our experimental and numerical data show, that the well known Snell’s law is valid for this granular system. The presented experiments and simulations clearly demonstrate that both effects - refraction and deflection - alter significantly the position of the shear zone, thus they may play important role in various industrial and civil engineering applications. Moreover, we expect that our findings may be relevant in geological processes where the materials involved (soil, rock) have naturally layered structures.
Further experiments in layered materials are on the way to explore the bulk deformation with an independent method (MRI imaging). We recently learned about a parallel experimental study on shear zone refraction obtained in a vertical cylindrical cell knbe2009 .
Acknowledgments
The authors are thankful for discussions with János Kertész and Ralf Stannarius. T.B. and T.U. acknowledge support of the Bolyai János research program, and the Hungarian Scientific Research Fund (Contract Nos. OTKA F060157 and PD073172).
References
- (1) D. Fenistein, and M. van Hecke, Nature 425, 256 (2003).
- (2) D. Fenistein, J.W. van de Meent and M. van Hecke, Phys. Rev. Lett. 92, 094301 (2004).
- (3) A. Ries, D.E. Wolf and T. Unger, Phys. Rev. E 76 051301 (2007).
- (4) S. Luding, Molecular Dynamics Simulations of Granular Materials, in The Physics of Granular Media, ed. Hinrichsen H. and Wolf D.E., p. 299 (Wiley, 2004).
- (5) X. Cheng, J.B. Lechman, A. Fernandez-Barbero, G.S. Grest, H.M. Jaeger, G.S. Karczmar, M.E. Mobius and S.R. Nagel, Phys. Rev. Lett. 96, 038001 (2006).
- (6) M. Depken, J.B. Lechman, M. van Hecke and W. van Saarloos, Europhys. Lett. 78, 58001 (2007).
- (7) M. Depken, W. van Saarloos and M. van Hecke, Phys. Rev. E 73 031302 (2006).
- (8) K. Sakaie, D. Fenistein, T.J. Carroll, M. van Hecke and P. Umbanhowar, Europhys. Lett. 84, 38001 (2008).
- (9) P. Jop, Phys. Rev. E 77, 032301 (2008).
- (10) E.A. Jagla, Phys. Rev. E 78, 026105 (2008).
- (11) K.M. Hill and Y. Fan, Phys. Rev. Lett. 101, 088001 (2008).
- (12) T. Unger, Phys. Rev. Lett. 98, 018301 (2007).
- (13) Nature Physics, Shear light refraction, Research Highlights, 3, 76 (2007).
- (14) D.M. Mueth, G.F. Debregeas, G.S. Karczmar, P.J. Eng, S.R. Nagel and H.M. Jaeger, Nature 406, 385 (2000).
- (15) GDR MiDi, Eur. Phys. J. E 14, 341-365 (2004).
- (16) T. Unger, J. Török, J. Kertész and D.E. Wolf, Phys. Rev. Lett. 92, 214301 (2004).
- (17) J. Török, T. Unger, J. Kertész, and D.E. Wolf, Phys. Rev. E 75, 011305 (2007).
- (18) D. Fenistein, J-W. van de Meent and M. van Hecke, Phys. Rev. Lett. 96, 118001 (2006).
- (19) T. Börzsönyi, T.C. Halsey, R.E. Ecke, Phys. Rev. E 78, 011306 (2008).
- (20) Movies and images taken during the experiments can be downloaded from the web page: http://www.szfki.hu/~btamas/gran/shearzone.html
- (21) H.A. Knudsen and J. Bergli, Phys. Rev. Lett. 103, 108301 (2009).