Spitzer/IRS 5-35m Low-Resolution Spectroscopy of the 12m Seyfert Sample
Abstract
We present low-resolution 5.5-35 m spectra for 103 galaxies from the 12 m Seyfert sample, a complete unbiased 12 m flux limited sample of local Seyfert galaxies selected from the IRAS Faint Source Catalog, obtained with the Infrared Spectrograph (IRS) on-board Spitzer Space Telescope. For 70 of the sources observed in the IRS mapping mode, uniformly extracted nuclear spectra are presented for the first time. We performed an analysis of the continuum emission, the strength of the Polycyclic Aromatic Hydrocarbon (PAH) and astronomical silicate features of the sources. We find that on average, the 15-30 m slope of the continuum is =-0.850.61 for Seyfert 1s and -1.530.84 for Seyfert 2s, and there is substantial scatter in each type. Moreover, nearly 32% of Seyfert 1s, and 9% of Seyfert 2s, display a peak in the mid-infrared spectrum at 20 m, which is attributed to an additional hot dust component. The PAH equivalent width decreases with increasing dust temperature, as indicated by the global infrared color of the host galaxies. However, no statistical difference in PAH equivalent width is detected between the two Seyfert types, 1 and 2, of the same bolometric luminosity. The silicate features at 9.7 and 18 m in Seyfert 1 galaxies are rather weak, while Seyfert 2s are more likely to display strong silicate absorption. Those Seyfert 2s with the highest silicate absorption also have high infrared luminosity and high absorption (hydrogen column density N1023 cm-2) as measured from the X-rays. Finally, we propose a new method to estimate the AGN contribution to the integrated 12 m galaxy emission, by subtracting the ”star formation” component in the Seyfert galaxies, making use of the tight correlation between PAH 11.2 m luminosity and 12 m luminosity for star forming galaxies.
1 Introduction
for which most of their nuclear and often bolometric luminosities is produced in
Active galaxies are galaxies in which one detects radiation from their nucleus which is due to accretion onto a super-massive black hole (SMBH) located at the center. The spectrum of an Active Galactic Nucleus (AGN) is typically flat in fν. The fraction of the energy emitted from the AGN compared with the total bolometric emission of the host can range from a few percent in moderated luminosity systems (LL⊙) to more than 90% in quasars (LL⊙) (see Ho, 2008, and references therein). As a subclass, Seyfert galaxies are the nearest and brightest AGNs, with 2-10keV X-ray luminosities less than ergs-1 and their observed spectral line emission originates principally from highly ionized gas. Seyferts have been studied at many wavelengths, from X-rays, ultraviolet,optical, to infrared (IR) and radio. The analysis of their optical spectra has lead to the identification of two types, Seyfert 1s (Sy 1s) and Seyfert 2s (Sy 2s), with the type 1s displaying features of both broad (FWHM2000 km s-1) and narrow emission lines, while the type 2s only narrow-line emission.
The differences between the two Seyfert types have been an intense field of study for many years. Are they due to intrinsic differences in their physical properties, or are they simply a result of dust obscuration that hides the broad-line region in Sy 2s? A so-called unified model has been proposed (see Antonucci, 1993; Urry & Padovani, 1995), suggesting that Sy 1s and Sy 2s are essentially the same objects viewed at different angles. A dust torus surrounding the central engine blocks the optical light when viewed edge on (Sy 2s) and allows the nucleus to be seen when viewed face on (Sy 1s). Optical spectra in polarized light (Antonucci & Miller, 1985) have indeed demonstrated for several Sy 2s the presence of broad lines, confirming for these objects the validity of the unified model. However, the exact nature of this orientation-dependent obscuration is not clear yet. Recently, more elaborate models, notably the ones of Elitzur (2008), Nenkova et al. (2008), and Thompson et al. (2009) suggest that the same observational constraints can also be explained with discrete dense molecular clouds, without the need of a torus geometry.
The study of Seyfert galaxies is interesting also from a cosmological perspective, as they trace the build up of SMBHs at the centers of galaxies. Observations up to 10keV have established that the cosmic X-ray background (CXB) is mostly due to Seyferts with a peak in their redshift distribution at z0.7 (Hasinger et al., 2005). Furthermore, theoretical modeling of the observed number counts suggests that CXB at 30keV is also dominated by obscured Seyferts at z0.7 (Gilli et al., 2007; Worsley et al., 2005). Given the strong ionization field produced by the accretion disk surrounding a SMBH, the dust present can be heated to near sublimation temperatures, making an AGN appear very luminous in the mid-infrared (mid-IR).
Mid-IR spectroscopy is a powerful tool to examine the nature of the emission from AGNs, as well as the nuclear star-formation activity. Since IR observations are much less affected by dust extinction than those at shorter wavelengths, they have been instrumental in the study of obscured emission from optically thick regions in AGNs. This is crucial to understand the physical process of galaxy evolution. With the advent of the Infrared Space Observatory (ISO), local Seyferts have been studied by several groups (see Verma et al., 2005, for a review). Mid-IR diagnostic diagrams to quantitatively disentangle the emission from AGNs, starbursts and quiescent star-forming (SF) regions have been proposed, using both spectroscopy and broad-band photometry (i.e. Genzel et al., 1998; Laurent et al., 2000). The recent launch of the Spitzer Space Telescope (Werner et al., 2004) has enabled the study of AGN with substantially better sensitivity and spatial resolution. In particular, using the Infrared Spectrograph (IRS111The IRS was a collaborative venture between Cornell University and Ball Aerospace Corporation funded by NASA through the Jet Propulsion Laboratory and the Ames Research Center.) (Houck et al., 2004a) on board Spitzer, Weedman et al. (2005) demonstrated early into the mission the variety in the morphology displayed by the mid-IR spectra of eight classical AGNs. Since then, large samples of AGNs have been studied in detail, in an effort to quantify their mid-IR properties (Buchanan et al., 2006; Sturm et al., 2006; Deo et al., 2007; Gorjian et al., 2007; Hao et al., 2007; Tommasin et al., 2008). In addition, new mid-IR diagnostics have been developed to probe the physics of more complex sources, such as luminous and ultra luminous infrared galaxies (LIRGs/ULIRGs), which may also harbor AGNs. These were based on correlating the strength of the Polycyclic Aromatic Hydrocarbons (PAHs), high excitation fine-structure lines, as well as silicate features (i.e. Armus et al., 2007; Spoon et al., 2007; Charmandaris, 2008; Nardini et al., 2008).
The extended 12 m galaxy sample is a flux-limited (down to 0.22 Jy at 12 m) sample of 893 galaxies selected from the IRAS Faint Source Catalog 2 (Rush et al., 1993). As discussed by Spinoglio & Malkan (1989), all galaxies emit a nearly constant fraction (7%) of their bolometric luminosity at 12 m. As a result, selecting active galaxies based on their rest frame 12m fluxes is the best approach to reduce selection bias due to the variations in their intrinsic spectral energy distributions (SED). A total of 116 objects from this sample have been optically classified as Seyfert galaxies (53 Sy 1s and 63 Sy 2s), providing one of the largest IR selected unbiased AGN sample. This sample also has ancillary data in virtually all wavelengths, thus making it the most complete data set for systematically studying the fundamental issues of AGNs in the infrared. Low-resolution 5.5-35 m Spitzer/IRS spectra of 51 Seyferts from the 12 m sample have been published by Buchanan et al. (2006), who focused on the study of the Seyfert types and the shape of mid-IR SED using principal component analysis. Based on this analysis and comparing with radio data, where available, they estimate the starburst contribution to the observed spectrum and find it to appear stronger in Sy 2s, in contrast to the unified model. However, high resolution Spitzer spectroscopy on 29 objects by Tommasin et al. (2008) does not find a clear indication of stronger star formation in Sy 2s than Sy 1s.
In this paper, we extend earlier work and study the mid-IR properties and nature of the dust enshrouded emission from 103 Seyferts of the 12 m Seyferts, nearly 90% of the whole sample. We use low resolution Spitzer/IRS spectra, focusing mainly on their broad emission and absorption features and provide for the first time our measurements of the PAH emission and strength of Si absorption features. Our observations and data reduction are presented in §2. In §3, we show our analysis on the mid-IR continuum shape, PAH emission and silicate strength of Seyfert galaxies. A new method to separate the star-formation and AGN contribution in the 12 m continuum is proposed in §4. Finally, we summarize our conclusions in §5.
2 Observations and Data Reduction
Since the launch of Spitzer in August 2003, a large fraction of the 12 m Seyfert galaxies have been observed by various programs using the low-resolution (R64-128) and high-resolution (R600) modules of Spitzer/IRS. These observations are publicly available in the Spitzer archive. A total of 84 galaxies have been observed with the low-resolution spectral mapping mode of the IRS by the GO program “Infrared SEDs of Seyfert Galaxies: Starbursts and the Nature of the Obscuring Medium” (PID: 3269), and mid-IR spectra extracted from the central regions of the maps for 51 galaxies were published by Buchanan et al. (2006). Spectra for the remaining sources have been taken as part of a number of Guaranteed, Open Time, as well as Legacy programs with program identifications (PID) 14, 61, 86, 96, 105, 159, 3237, 3624, 30291, and 30572. For the purpose of this work, which is mainly to use the PAH emission features to diagnose starburst and AGN contribution, we are focusing on the low-resolution IRS spectra (Short Low, SL: 5-15 m; Long Low, LL: 15-37 m). We performed a complete search of the Spitzer Science Center (SSC) data archive and retrieved a total of 103 sources with at least Short Low observations. Among these objects, 47 are optically classified as Sy 1s and 56 as Sy 2s222The 12m Seyferts not included in this study due to lack of Spitzer/IRS SL spectra are 6 Sy 1s (Mrk1034, M-3-7-11, Mrk618, F05563-3820, F15091-2107, E141-G55) and 7 Sy 2s (F00198-7926, F00521-7054, E541-IG12, NGC1068, F03362-1642, E253-G3, F22017+0319). . We adopt the spectral classification of Rush et al. (1993) for the Seyfert types. Even though in a few cases, the classification may be ambiguous or may have changed, we do not expect our results, which are of statistical nature, to be affected. The complete list of the objects analyzed in this paper including their coordinates, IRAS fluxes, IR luminosity, redshift, Seyfert type and Spitzer program identification number are presented in Table 1. The redshift and luminosity distribution of the 12 m Seyfert sample and the galaxies with IRS data studied in this paper is displayed in Figure 1.
With the exception of the data from the SINGS Legacy program (PID 159), of which we directly used spectra available at the SSC333The SINGS data products are available at: http://data.spitzer.caltech.edu/popular/sings/. The nuclear spectra were extracted over a 5033 region on the nucleus., all other raw datasets are retrieved from the Spitzer archive and reduced in the following manner.
All except three444The three exceptions are NGC1097, NGC1566, NGC5033, and they were also observed by SINGS. of the 12 m Seyferts with cz10,000km s-1 have been observed with the IRS spectral mapping mode (PID 3269). This enabled us to also study the circumnuclear activity and examine the contribution of the host galaxy emission to the nuclear spectrum. Using datasets from this program, mid-IR spectra obtained from the central slit placement of each map with point-source extraction were published by Buchanan et al. (2006). However, as these authors have noted, since the observations had been designed as a spectral map, blind telescope pointing was used. As a result, no effort was made to accurately acquire each target and to ensure that the central slit of each map was indeed well centered on the source. Moreover, for sources where the mid-IR emission is extended, using a point-source extraction method would likely result in an overestimate of the flux densities, due to the slit loss correction function applied. This would consequently affect the SED of the galaxy.
For most of the data reduction in this paper, we used The CUbe Builder for IRS Spectra Maps (Smith et al., 2007b, CUBISM), in combination with an image convolution method. This method is developed explicitly for IRS mapping mode observations where the map size is small and involves the following steps. Spectral cubes were built using CUBISM from the IRS maps. Sky subtraction was performed by differencing the on and off source observations of the same order in each module (SL and LL). The observations from PID 3269 were designed to minimize redundancy and maximize the number of sources that can be observed using a limited amount of telescope time. As a result these maps consisted of only 13 steps in SL and 5 steps in LL with no repetition and for a source with extended mid-IR emission, the small map may not encompass the entire source, e.g. NGC1365. To obtain an accurate SED from the extracted region of the galaxy, one needs to ensure that the same fraction of source fluxes at all wavelengths is sampled. Since the point spread function (PSF) changes from 5 to 35 m, we adopted an image convolution method to account for the change in the full width half maximum (FWHM) of the PSF: 2-dimensional images at each wavelength were convolved to the resolution at the longest wavelength (35 m). Then low-resolution spectra were extracted with matched apertures, chosen to encompass the whole nuclear emission. Even though the image convolution method dilutes the fluxes included in the extraction aperture, it does ensure an accurate SED shape, especially for small maps that cannot encompass the extended emission for the source. A comparison of the LL spectra before and after image convolution for NGC1365 can be found in Figure 2.
A number of tests with varying sizes for the spectral extraction aperture were performed in order to select the optimum size. An aperture of 43 pixels in LL was adopted, which corresponds to an angular size of 20.415.3. Then a complete 5–35m spectrum of all galaxies centered on their nucleus was extracted555For two Sy 2s NGC1143/4 and NGC4922, only SL data were available, thus only 5–15m spectra were obtained.. The main motivation behind this choice was to ensure that we could produce an accurate overall SED of the extracted region, even in cases where the emission was extended. This was essential so that we have a reliable measurement of the continuum emission, in order to calculate the mid-IR slope, and to estimate the strength of the silicate features. Further tests were performed by extracting just the SL spectra of the sample using the smallest aperture possible (22 pixels in SL or 3.6). It was found that, in general, the measured fluxes and EWs of the PAH features did not differ more than 20% from the integrated spectra over the larger apertures, which indicates that these objects are likely to be less than 20% more extended than the point-spread-function of point sources. This suggests that most of the sources were not very extended in the mid-IR and more than 80% of their flux originates from a point source unresolved to Spitzer. Scaling the spectra between different orders and modules was not needed for most of the cases, and when an order mismatch was detected, the SL spectra were scaled to match LL. In Table 2, where we present our measurements, the sizes of the extraction apertures as well as their corresponding projected linear sizes on the sky are also listed. A histogram of the physical size of extraction aperture for the whole sample is presented in Figure 3 with the dotted line, while in the same figure, we also show the distribution for sources that are observed in spectral mapping mode with the solid line. All the sources that are extracted from a projected size of more than 20 kpc are observed using the staring mode and reduced with point-source extraction method.
For data obtained with the IRS staring mode, the reduction was done in the following manner. We started from intermediate pipeline products, the “droop” files, which only lacked stray light removal and flat-field correction. Individual pointings to each nod position of the slit were co-added using median averaging. Then on and off source images were differenced to remove the contribution of the sky emission. Spectra from the final 2-D images were extracted with the Spectral Modeling, Analysis, and Reduction Tool (SMART, Higdon et al., 2004) in a point source extraction mode, which scaled the extraction aperture with wavelength to recover the same fraction of the diffraction limited instrumental PSF. Note that since the width of both the SL and LL slits is 2 pixels (3.6 and 10.2 respectively), no information could be retrieved along this direction from areas of the galaxy which were further away. The spectra were flux calibrated using the IRS standard star Lac, for which accurate template was available (Cohen et al., 2003). Finally, using the first order of LL (LL1, 20–36m) spectrum to define the absolute value of the continuum, the flux calibrated spectra of all other low-resolution orders were scaled to it.
For nine sources in the 12 m Seyfert sample, both spectral mapping and staring mode observations had been obtained and were available in the SSC data archive. For these galaxies, the spectra were extracted following the above mentioned recipes for all observations. In order to ascertain again how extended the emission from these source was, we compared the resulting spectra of the same source. With two exceptions, NGC4151 and NGC7213, all other seven spectra obtained in staring mode required a scaling factor larger than 1.15 between the SL and LL modules. This further suggests that the nuclear emission in those sources is indeed extended, and point-source extraction may not be appropriate. For galaxies with only staring mode observations, we also checked the difference between the overlap region (m) in the SL and LL modules. None of them require a scaling factor more than 1.15, suggesting that those objects are point-like at least along the direction of the IRS slits.
3 Results
3.1 Global Mid-IR spectra of Seyfert Galaxies
It has been well established that the mid-IR spectra of Seyfert galaxies display a variety of features (see Clavel et al., 2000; Verma et al., 2005; Weedman et al., 2005; Buchanan et al., 2006; Hao et al., 2007, and references therein). This is understood since, despite the optical classification of their nuclear activity, emission from the circumnuclear region, as well as of the host galaxy, also influences the integrated mid-IR spectrum of the source. Our complete 12 m selected Seyfert sample provides an unbiased framework to study the statistics on their mid-IR properties. Earlier work by Buchanan et al. (2006) on just 51 AGN from this sample presented a grouping of them based on their continuum shapes and spectral features. In this section, we explore the global shape of the mid-IR spectra for the complete Spitzer/IRS set of data on the 12 m Seyferts.
We examine if the average mid-IR spectrum of a Sy 1 galaxy is systematically different from that of a Sy 2. The IRS spectra for 47 Sy 1s and 54 Sy 2s with full 5.5-35 m spectral coverage, normalized at the wavelength of 22 m, are averaged and plotted in Figure 4. For comparison, we over-plot the average starburst template from Brandl et al. (2006). It is clear that the mid-IR continuum slope of the average Sy 1 spectrum is shallower than that of Sy 2, while the starburst template has the steepest spectral slope, indicating a different mixture of hot/cold dust component in these galaxies (also see Hao et al., 2007). This would be consistent with the interpretation that our mid-IR spectra of Sy 2s display a strong starburst contribution, possibly due to circumnuclear star formation activity included in the aperture we used to extract the spectra from, consistent with the findings of Buchanan et al. (2006) that star formation is extended and it is not a purely nuclear phenomenon. PAH emission, which is a good tracer of star formation activity (Förster Schreiber et al., 2004), can be detected in the average spectra of both Seyfert types, while it is most prominent in the average starburst spectrum. PAH emission originates from photo-dissociation region (PDR) and can easily be destroyed by the UV/X-ray photons in strong a radiation field produced near massive stars and/or an accretion disk surrounding a SMBH (Voit, 1992; Laurent et al., 2000; Clavel et al., 2000; Sturm et al., 2002; Verma et al., 2005; Weedman et al., 2005). In the 12 m Seyfert sample, we detect PAH emission in 37 Sy 1s and 53 Sy 2s, that is 78% and 93% for each type respectively. This is expected since the apertures we used to extract the mid-IR spectra for the 12m sample correspond in most cases to areas of more than 1 kpc in linear dimensions (see Figure 3). As a result, emission from the PDRs associated with the extended circumnuclear region and the disk of the host galaxy is also encompassed within the observed spectrum. High ionization fine-structure lines, such as [NeV]14.32 m/24.32 m, are clearly detected even in the low-resolution average spectrum of Sy 1. This signature is also visible, though rather weak, in the average spectrum of Sy 2, while it is absent in the average starburst template. Due to photons of excitation energy higher than 97eV and typically originating from the accretion disk of an AGN, [NeV] serves as an unambiguous indicator of an AGN. Even though the low-resolution module of IRS was not designed for studying fine-structure lines, we are still able to detect [NeV] emission in 29 Sy 1s and 32 Sy 2s, roughly 60% for both types. Another high ionization line, [OIV] 25.89 m, with ionization potential of 54eV, also appears in both Seyfert types (42 Sy 1s and 41 Sy 2s), and is stronger in the average spectrum of Sy 1. The [OIV] emission line can be powered by shocks in intense star forming regions or AGNs (see Lutz et al., 1998; Schaerer & Stasińska, 1999; Bernard-Salas et al., 2009; Hao et al., 2009). In our sample it is probably powered by both, given the large aperture we adopted for spectral extraction. More details and a complete analysis of mid-IR fine-structure lines for 29 galaxies from the 12 m Seyfert sample are presented in Tommasin et al. (2008), while the work for the entire sample is in progress (Tommasin et al. 2009).
An atlas with mid-IR low-resolution spectra of the 12 m Seyfert sample is included at the end of this paper666All spectra are also available in electronic format.. We find that a fraction of our sources show a flattening or a local maximum in the mid-IR continuum at 20 m, which had also been noted as a “broken power-law” in some Seyfert galaxies by Buchanan et al. (2006). Another more extreme such case was the metal-poor blue compact dwarf galaxy SBS0335-052E (Houck et al., 2004b), and it was interpreted with the possible absence of larger cooler dust grains in the galaxy. Since the change of continuum slope appears at 20 m, we use the flux ratio at 20 and 30 m, F20/F30, to identify these objects. After further examination of the spectra, we find 15 Sy 1s and 4 Sy 2s, which have a F20/F300.95. We call these objects “20 m peakers”.
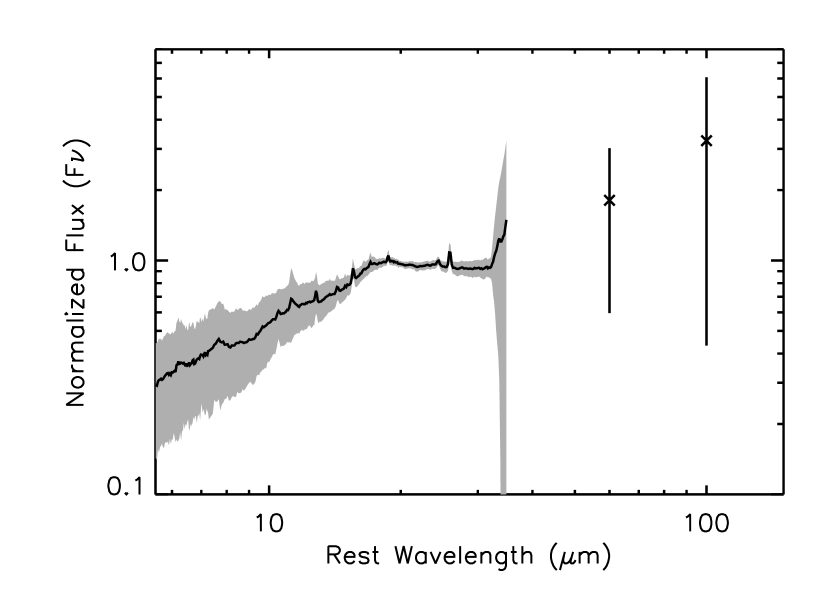
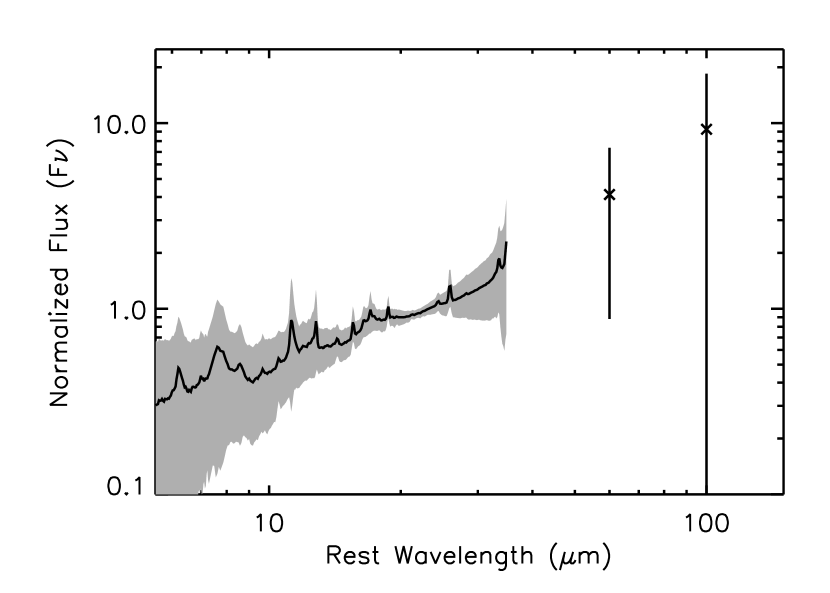
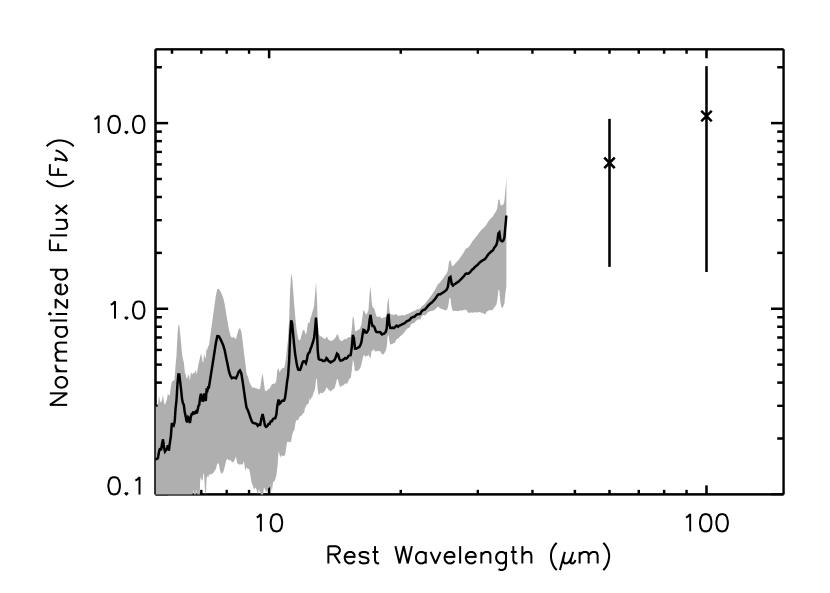
To analyse the properties of “20 m peakers”, we plot the average IRS spectra of the 19 sources in Figure 5. As most of these sources are type 1 Seyferts (15 out of 19), we also overplot the average Sy 1 spectrum for comparison. In addition to their characteristic continuum shape, a number of other differences between the “20 m peakers” and Sy 1s are also evident. PAH emission, which is clearly detected in the average Sy 1 spectrum, appears to be rather weak in the average “20 m peaker” spectrum. The high-ionization lines of [NeV] and [OIV] are seen in both spectra with similar strength, while low-ionization lines, especially [NeII] and [SIII], are much weaker in the average spectrum of “20 m peakers”. If we calculate the infrared color of a galaxy using the ratio of F25/F60 (see section 3.3 for more detailed discussion on this issue), we find an average value of 0.75 for the “20 m peakers”, while it is 0.30 for the other “non-20 m peaker” Sy 1s in the 12 m sample. Finally, the average IR luminosities of the “20 m peakers” and Sy 1s do not show significant difference, with log(L)=10.96 for the former and log(L)=10.86 for the latter. These results are consistent with the “20 m peakers” being AGNs with a dominant hot dust emission from a small grain population heated to effective temperatures of 150K and a possible contribution due to the distinct emissivity of astronomical silicates at 18m. Their radiation field must also be stronger than a typical Sy 1, since it destroys the PAH molecules around the nuclear region more efficiently. We should stress that unlike SBS0335-052E, whose global IR SED peaks at 30 m, and likely has limited quantities of cold dust, the mid-IR peak we observe in these objects at 20 m is likely a local one777However, some objects, such as Mrk335, Mrk704 and 3C234, do have IRAS ratios of F25/F1.. This becomes more evident in Figure 6, where we also include the scaled average 60 and 100 m flux densities for the “20 m peakers”. It is clear that their far-IR emission increases with wavelength, thus confirming the presence of ample quantities cold dust in these objects. To contrast the global SED of these objects with the whole Seyfert sample we include in Figures 7 and 8 the average SED of the Sy 1s and Sy 2s of the sample. All SEDs have been normalized as in Figure 4 at 22m. Unlike the “20 m peakers” one can easily observe the regular increase of the flux from 15 to 60m in the average Sy 1 and Sy 2 SEDs. A more detailed analysis of the dust properties of the “20 m peakers” in comparison with typical active galaxies will be presented in a future paper.
3.2 The PAH emission in the 12m Seyferts
In this section, we explore some of the properties of the PAH emission in our sample and contrast our findings to the previous work. To quantify the strength of PAH emission, we follow the usual approach and measure the fluxes and equivalent widths (EWs) of the 6.2 and 11.2 m PAH features from their mid-IR spectra. Even though the 7.7m PAH is the strongest of all PAHs (Smith et al., 2007a), we prefer not to include it in our analysis. This is due to the fact that its measurement is affected by absorption and emission features next to it and depends strongly both on the assumptions of the various measurement methods (spline or Drude profile fitting) as well as the underlying continuum. Furthermore, it often spans between the two SL orders, which could also affect its flux estimate. The 6.2 and 11.2 m PAH EWs are derived by integrating the flux of the features above an adopted continuum and then divide by the continuum fluxes in the integration range. The baseline is determined by fitting a spline function to the selected points (5.95-6.55 m for the 6.2 m PAH and 10.80-11.80 m for the 11.2 m PAH). The PAH EWs as well as the integrated fluxes are listed in Table 2. The errors including both flux calibration and measurement are estimated to be less than 15% on average.
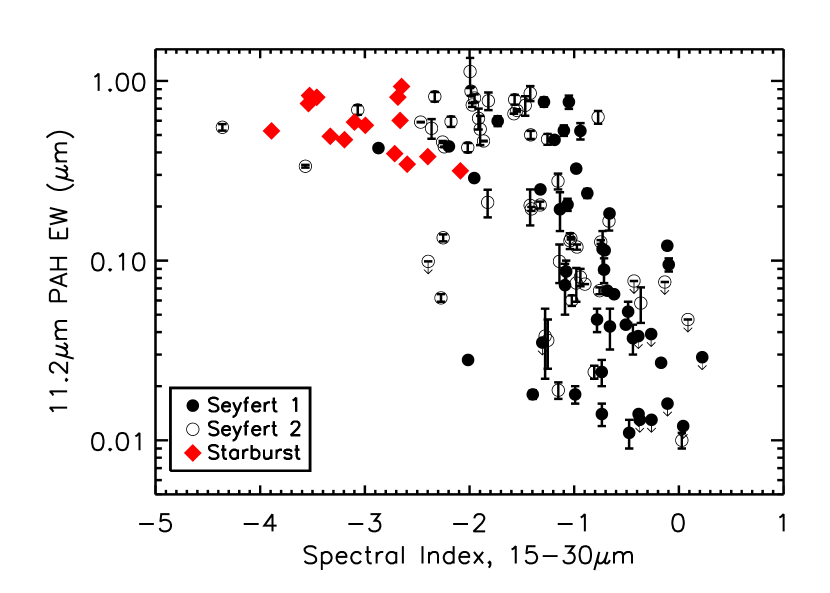
The first study on the PAH properties of a large sample of Seyferts was presented by Clavel et al. (2000), using ISO/PHOT-S 2.5–11m spectra and ISO/CAM broad band mid-IR imaging. The authors suggested that there was a statistical difference in the strength of the PAH emission and the underlying hot continuum (m) emission between type 1 and type 2 objects. They also found that Sy 2s had stronger PAHs than Sy 1s, while Sy 1s had higher hot continuum associated with emission from the AGN torus. This was consistent with an orientation depended depression of the continuum in Sy 2s. The interpretation of these results was challenged by Lutz et al. (2004), who attributed it to the large (24) aperture of ISO/PHOT-S, and the possible contamination from the host galaxy. More recently, Deo et al. (2007) have found a relation between the 6.2 m PAH EWs and the 20-30 m spectral index888The spectral index is defined as log(F1/F2)/log(/). , with a steeper spectral slope seen in galaxies with a stronger starburst contribution. This is understood since galaxies hosting an AGN are “warmer” and have an IR SED peaking at shorter wavelengths thus appearing flatter in the mid-IR (see also next section). Given the global correlations between star formation activity and PAH strength (Förster Schreiber et al., 2004; Peeters et al., 2004; Wu et al., 2005; Calzetti et al., 2005, 2007, i.e.), star-forming galaxies are expected to also have stronger PAH features. In Figure 9, we plot the 15-30 m999We choose to use so that we can directly make use of the spectral index measurement for the starburst galaxies in the Brandl et al. (2006) sample. spectral index for the 12 m Seyfert sample as a function of their 11.2 m PAH EWs. The diamonds indicate the starburst galaxies from Brandl et al. (2006)101010We have excluded the 6 galaxies that have AGN signatures from the Brandl et al. (2006) starburst sample.. A general trend of the PAH EWs decreasing as a function of 15-30 m spectral index is observed in Figure 9, even though it is much weaker than the anti-correlation presented by Deo et al. (2007). Starburst galaxies are located on the upper left corner of the plot, having very steep spectral slopes, with =-3.020.50, and large PAH EWs, nearly 0.7m. Seyfert galaxies spread over a considerably larger range in spectral slopes as well as PAH EWs. Sy 1s and Sy 2s are mixed on the plot. On average, the 15-30 m spectral index is =-0.850.61 for Sy 1s and =-1.530.84 for Sy 2s. Note that although the mean spectral slope is slightly steeper for Sy 2s, there is substantial scatter, as is evident by the uncertainties of the mean for each types (see also Figure 7 and 8).
It is well known that the flux ratio of different PAH emission bands is a strong function of PAH size and their ionization state (Draine & Li, 2001). The 6.2 m PAH emission is due to C-C stretching mode and the 11.2 m feature is produced by C-H out-of-plane bending mode (Draine, 2003). In Figure 10, we display a histogram of the 11.2 m to 6.2 m PAH flux ratios for the 12 m Seyferts. Given the relatively small number of starburst galaxies in the Brandl et al. (2006) sample (16 sources), we also included 20 HII galaxies from the SINGS sample of Smith et al. (2007a), thus increasing the number of SF galaxies to 36 sources and making its comparison with the Seyferts more statistically meaningful. However, since Smith et al. (2007a) adopted multiple Drude profile fitting for the measurement of PAH features, for reasons of consistency, we re-measured the PAH fluxes of the 20 SINGS galaxies with our spline fitting method. From Figure 10, we can see that both the Seyferts and SF galaxies, indicated by the solid and dashed line respectively, appear to have very similar distribution of PAH 11.2m/6.2m band ratios. The average PAH flux ratios for the Seyfert sample is 0.940.37 while for the SF galaxies is 0.870.24, which agree within 1-. This is also consistent with the findings of Shi et al. (2007), who reported similar 11.2m/7.7m flux ratios between a sample of higher redshift AGNs (PG, 2MASS and 3CR objects) and the SINGS HII galaxies. This implies that even though the harsh radiation field in AGNs may destroy a substantial amount of the circumnuclear PAH molecules, and does so preferentially – the smaller PAHs being destroyed first (Draine & Li, 2001; Smith et al., 2007a) – it likely does not do so over a large volume. Enough molecules in the circumnuclear regions do remain intact and as a result, the aromatic features that we observe from Seyferts are essentially identical to those in SF galaxies.
The relative strength of PAH emission can also be used to examine the validity of the unified AGN model. As mentioned earlier, this model attributes the variation in AGN types as the result of dust obscuration and relative orientation of the line of sight to the nucleus (Antonucci, 1993). Sy 1s and Sy 2s are intrinsically the same but appear to be different in the optical, mainly because of the much larger extinction towards the nuclear continuum of Sy 2s when viewed edge on. The latest analysis of the IRS high-resolution spectra of 87 galaxies from the 12 m Seyfert sample shows that the average 11.2 m PAH EW is 0.290.38 m for Sy 1s and 0.370.35 m for Sy 2s (Tommasin et al. 2009, in preparation). As we show in Table 3, the 11.2 m PAH EWs of the whole 12m Seyfert sample (90 objects excluding upper limits) is 0.210.22 m for the Sy 1s and 0.380.30m for the Sy 2s. The difference we observe in the PAH EWs between the two Seyfert types is somewhat larger than the one reported by Tommasin et al. (2009, in preparation), though still consistent within 1. This further suggests that there is little discernible difference between Sy 1s and Sy 2s at this wavelength.
If the observed AGN emission in the infrared does not depend on the line of sight of the observer, one can compare the circumnuclear PAH emission of Sy 1s and Sy 2s of similar bolometric luminosities to test the unified model. If we bin the sources according to their IR luminosity, we find an average PAH EW of 0.220.23 m for Sy 1s and 0.40 0.30 m for Sy 2s with L1011L⊙; while the average PAH EWs are 0.190.19 m for Sy 1s and 0.370.30 m for Sy 2s with L1011L⊙ (see Table 3 for a summary of these results). The difference between the two Seyfert types is still less than 1. This result is not in agreement with the findings of Buchanan et al. (2006) who based on a principle component analysis find that in their subset of 51 galaxies the Sy 2s show a stronger starburst eigenvector/template contribution than the Sy 1s. As the authors suggest this might be due to a bias of selection effects. Our result can be interpreted as indicating that there is some, but not substantial obscuration in the mid-IR. As a consequence we are able to probe deep into the nuclear region, sampling most of the volume responsible for the mid-IR emission. This result is consistent with a similar finding of Buchanan et al. (2006) who compared the mid-IR to radio ratio for their sample. They concluded that the observed factor of 2 difference between the two types would imply either a smooth torus which is optically thin in the mid-IR or a clumpy one containing a steep radial distribution of optically thick dense clumps (Nenkova et al., 2008).
3.3 Cold/Warm AGN diagnostics
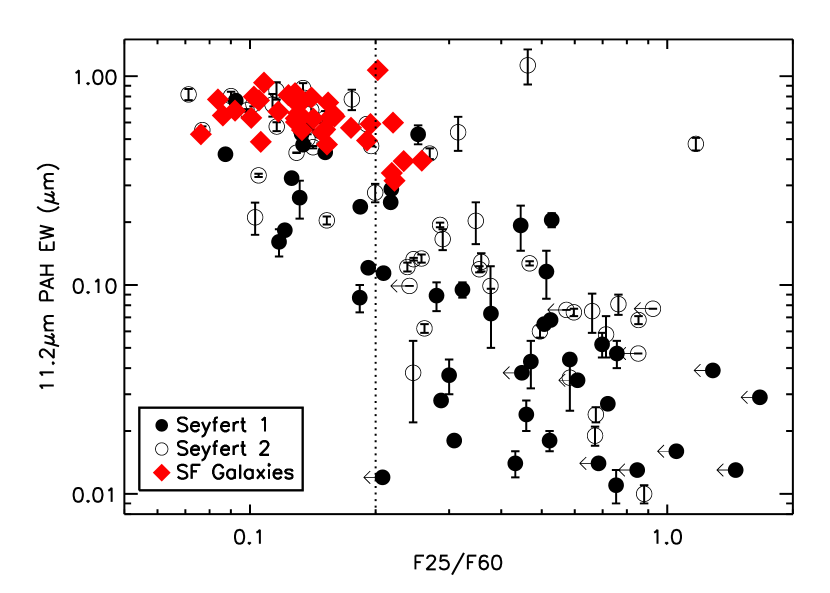
The IRAS 25 and 60 m flux ratio has long been used to define the infrared color (“warm” or “cold”) of a galaxy, with “warm” galaxies having a ratio of F25/F0.2 (Sanders et al., 1988). In Figure 11, we plot the 11.2 m PAH EW as a function of the flux ratio between F25 and F60 for the 12 m Seyfert sample. The IRAS 25 and 60 m fluxes were compiled from Rush et al. (1993) and Sanders et al. (2003) and are listed in Table 1. The aperture of the IRAS broad band filters is on the order of a few arcminutes on the sky111111According to the IRAS Explanatory Supplement Document for unenhanced coadded IRAS images the resolution is approximately 1’ 5’, 1’ 5’, 2’ 5’ and 4’ 5’ at 12, 25, 60 and 100 m, respectively ( see http://lambda.gsfc.nasa.gov/product/iras/docs/exp.sup ). and typically encompass the whole galaxy, while the PAH EW is measured from a spectrum of a smaller region centered on the nucleus of the galaxy (see Table 2). Nevertheless, we observe a clear trend of the 11.2 m PAH EW decreasing with F25/F60 ratio in Figure 11. On this plot, we also include the SF galaxies from Brandl et al. (2006) and Smith et al. (2007a). All SF galaxies appear to be clustered on the top left corner of the plot, having high PAH EWs and low F25/F60 values, suggesting strong star formation and cooler dust temperatures. The observed suppression of PAH emission seen in the warm AGNs implies that the soft X-ray and UV radiation of the accretion disk, which destroys the PAH molecules, is also reprocessed by the dust and dominates the mid- and far-IR colors. More specifically, warm Sy 1s have an average 11.2m PAH EW of 0.100.12m, while for Sy 2s the value is 0.180.24m. Similarly for the cold sources, the average PAH EW is 0.400.23m for Sy 1s and 0.590.19m for Sy 2s. We observe a 3 difference in the PAH EWs between the cold and warm sources, independent of their Seyfert type. This indicates that as the emission from the accretion disk surrounding the SMBH of the active nucleus contributes progressively more to the IR luminosity, its radiation field also destroys more of the PAH molecules and thus diminishes their mid-IR emission.
The trend of PAH EWs decreasing with F25/F60 has also been detected in a large sample of ULIRGs studied by Desai et al. (2007). The luminosities of the 12 m Seyfert sample are more comparable with LIRGs, thus our work extends the correlation of Desai et al. (2007) to a lower luminosity range. This is rather interesting since deep photometric surveys with Spitzer can now probe normal galaxies as well as LIRGs at z1 (Le Floc’h et al., 2005), a fraction of which are known to host an AGN based on optical spectra and mid-IR colors (Fadda et al., 2002; Stern et al., 2005; Brand et al., 2006).
We have also investigated the dependence of the 6.2 m PAH EW on the F25/F60 ratio for our sample. A similar trend of the 6.2 m EWs decreasing with F25/F60 is observed as well, though there is larger scatter than the one seen with the 11.2 m feature. This is probably due to the fact that the 6.2 m PAH EW is intrinsically fainter and only upper limits could be measured for a number of source (see Table 2) . Despite the scatter, this trend is still a rather important finding, because for high redshift galaxies (z2.5), the 6.2 and 7.7m PAHs might be the only features available in the wavelength range covered by the IRS, thus measuring them can reveal essential information on the star-formation luminosity and dust composition of high-redshift galaxies (see Houck et al., 2005; Yan et al., 2005; Teplitz et al., 2007; Weedman & Houck, 2008).
3.4 The Silicate Strength of the 12 m Seyferts
In the mid-IR regime, one can examine not only the structure of complex organic molecules and determine their aromatic or aliphatic nature, but can also probe the chemistry of dust grains (see van Dishoeck, 2004). One of the most prominent continuum features in the 5-35m range is the one associated with the presence of astronomical silicates in the grains, which are characterized by two peaks in the emissivity at 9.7 and 18m (see Dudley & Wynn-Williams, 1997). The silicate features had been detected in absorption in SF galaxies, protostars and AGN for over 30 years (ie Gillett et al., 1975; Rieke & Low, 1975), but it was the advent of space observatories such as ISO and Spitzer, which allowed for the first time of study over a wide range of astronomical objects and physical conditions. According to the unified model, an edge-on view through the cool dust in the torus will cause the silicate feature to be seen in absorption, while with a face-on view, the hot dust at the inner surface of the torus will cause an emission feature for the silicate (Efstathiou & Rowan-Robinson, 1995). Even though silicate in emission at 9.7m had already been observed in the SF region N66 (Contursi et al., 2000), emission at both 9.7 m and 18 m in AGNs and Quasars was detected with Spitzer (Siebenmorgen et al., 2005; Hao et al., 2005; Sturm et al., 2005), providing strong support for the unified model (Antonucci, 1993). Using Spitzer/IRS data, Hao et al. (2007) compiled a large, though inhomogeneous sample of AGNs and ULIRGs, and uniformly studied the silicate features in these galaxies. Using the same sample, Spoon et al. (2007) proposed a new diagnostic of mid-IR galaxy classification based on the strength of silicate and PAH features. To put in the same context the properties of the silicate feature in the 12 m Seyfert sample, we also measured the strength of the silicate at 9.7 m, using the definition and approach of Spoon et al. (2007) as:
| (1) |
where fcont(9.7 m) is the flux density of a local mid-IR continuum, defined from the 5-35 m IRS spectrum. Sources with silicate in emission have positive strength and those in absorption negative. Buchanan et al. (2006) did identify two AGN with silicate emission and two more with broad silicate absorption out of the 51 sources they studied. In this paper, we provide for the first time measurements on the silicate features for this complete sample. We follow the prescription of Spoon et al. (2007) and Sirocky et al. (2008) for the continuum definition and identify the sources to be PAH-dominated, continuum-dominated and absorption-dominated. The values of Ssil measured from the 12 m Seyferts can be found in Table 2.
In Figure 12a, we plot the 11.2 m PAH EWs as a function of the 9.7 m silicate strength121212A similar plot using the 6.2 m PAH EWs was proposed by Spoon et al. (2007) as a mid-IR galaxy classification method. We observe that most Sy 1s are located close to Ssil=0 and the range of their silicate strength is rather narrow, with the exception of one galaxy, UGC5101, which is also one of the ULIRGs of the Bright Galaxy Sample (Armus et al., 2004, 2007). This is in agreement with the results of Hao et al. (2007), who found that Sy 1s are equally likely to display the 9.7 m silicates feature in emission and in absorption. The Sy 2s have a larger scatter in the value of the silicate strength, with most of them showing the feature in absorption. The average silicate strength of the 12 m Seyfert sample is -0.070.29 for Sy 1s and -0.460.73 for Sy 2s, while the median values are -0.02 for Sy 1s and -0.23 for Sy 2s. Overall, though selected at 12 m, most objects have a rather weak silicate strength, with only 18 Sy 2s and 2 Sy1s displaying values of S-0.5. We also examined the dependence of the silicate strength with the IR luminosity of the objects and plot it in Figure 12b. Except for one galaxy (NGC7172), all the sources with deep silicate absorption features have IR luminosities larger than 1012L⊙, and thus are also classified as ULIRGs. In Sy 1 galaxies, even when their luminosities are larger than 1012L⊙, the 9.7 m silicate strength is still near zero, while high-luminosity Sy 2s are more likely to have deep silicate absorption features.
We also compare the silicate strength with galaxy color, as defined in §3.3. In Figure 13a, we plot the silicate strength as a function of the IRAS flux ratio of F25/F60. Since the majority of the galaxies do not have strong silicate features, no clear correlation between the two parameters is seen. We notice that galaxies with S also appear to have colder colors. This indicates that more dust absorption is present in sources with the colder IR SEDs, even though many sources with small F25/F60 ratios do not display any silicate absorption features.
Finally, we investigate the relation between the mid-IR silicate strength and the hydrogen column density131313The values of the hydrogen column density have been taken from Markwardt et al. (2005); Bassani et al. (2006); Sazonov et al. (2007); Shu et al. (2007)., as measured from the X-rays. The latter can measure directly the absorption in active galaxies: the power law spectrum in the 2-10keV range may be affected by a cutoff due to photo-electric absorption, from which column densities of are derived (eg. Maiolino et al., 1998). One should note though that due to the substantially smaller physical size of the nuclear region emitting in (hard) X-rays this measurement is more affected by the clumpiness of the intervening absorbing medium. The well established observational fact that Sy 2s are preferentially more obscured than Sy 1s, as has been shown both in the optical and in the X-ray spectra, is also apparent in the mid-IR spectra by our results given in Figure 13b. We find that sources with weak silicate absorption or emission features span over all values of the column densities. However, most of the sources with a strong silicate absorption (S -0.5) have a (cm-2) (11 of 15 sources), and Sy 2s dominate this group (13 of 15 sources).
4 What powers the 12 m luminosity in the 12m Seyferts?
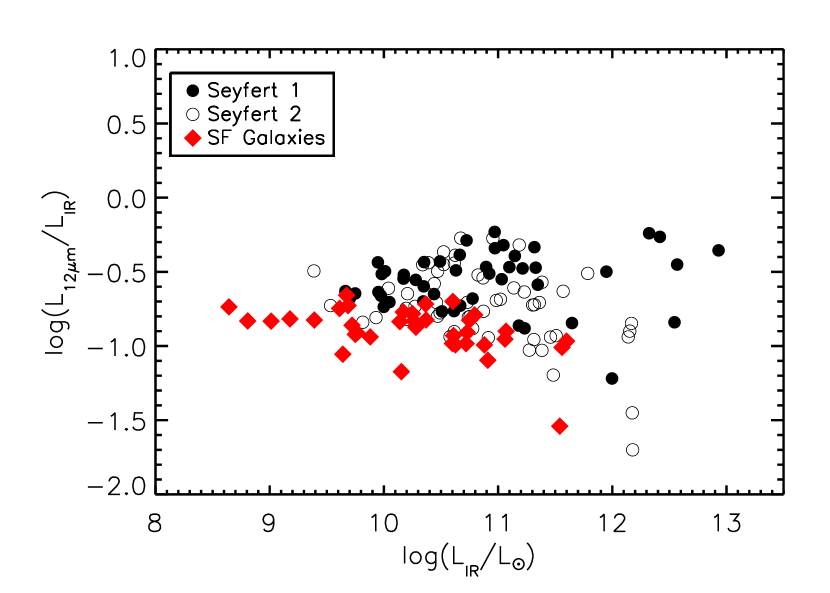
The use of the global infrared dust emission as a tracer of the absorbed starlight and associated star formation rate has been known since the first results of IRAS (see Kennicutt 1998 and references there in). At 12 m, the flux obtained from the IRAS broadband filter is dominated by the continuum emission, though it could also be affected by several other discrete factors, including the silicate features, the PAH emission, fine-structure lines, etc. In Figure 14, we present the usual plot of L12μm/LIR versus the total IR luminosity141414Calculated from the IRAS flux densities following the prescription of Sanders & Mirabel (1996): LIR=5.6105D(). for the Seyfert galaxies and SF galaxies. A clear correlation between these two parameters, originally presented for the 12m sample by Spinoglio et al. (1995), is seen. The two Seyfert types do not show significant differences. SF galaxies appear to have a lower fractional 12 m luminosity when compared to Seyferts of similar total IR luminosity. This can be explained by the presence of hot dust emission (T300K) originating from regions near the active nucleus, contributing more strongly at the shortest wavelengths (5 to 15 m) of the IR SED. This is consistent with the results of Spinoglio et al. (1995), who have shown that the 12 m luminosity is 15% of the bolometric luminosity151515According to Spinoglio et al. (1995), the bolometric luminosity is derived by combining the blue photometry, the near-IR and FIR luminosities, as well as an estimate of the flux contribution from cold dust longward of 100 m. in AGNs (Spinoglio & Malkan, 1989), while only 7% in starburst and normal galaxies.
Following these early IRAS results, a number of studies have explored the issue of distinguishing AGN from the star formation signatures in the mid-IR and to determine the fractional contribution of each component to the IR luminosity for local (i.e. Genzel et al., 1998; Laurent et al., 2000; Peeters et al., 2004; Buchanan et al., 2006; Farrah et al., 2007; Nardini et al., 2008) and high redshift sources (i.e. Brand et al., 2006; Weedman et al., 2006; Sajina et al., 2007). More recently, using the [OIV]25.89m line emission as an extinction free tracer of the AGN power, Meléndez et al. (2008b) were able to decompose the stellar and AGN contribution to the [NeII]12.81m line. These authors have compiled a sample from existing Spitzer observations by Deo et al. (2007); Tommasin et al. (2008); Sturm et al. (2002); Weedman et al. (2005), as well as X-ray selected sources from Meléndez et al. (2008a). They found that Sy 1 and Sy 2 galaxies are different in terms of the relative AGN/starburst contribution to the infrared emission, with star formation being responsible for 25% of the mid- and far-IR continuum in Sy 1s, and nearly half of what was estimated for Sy 2s.
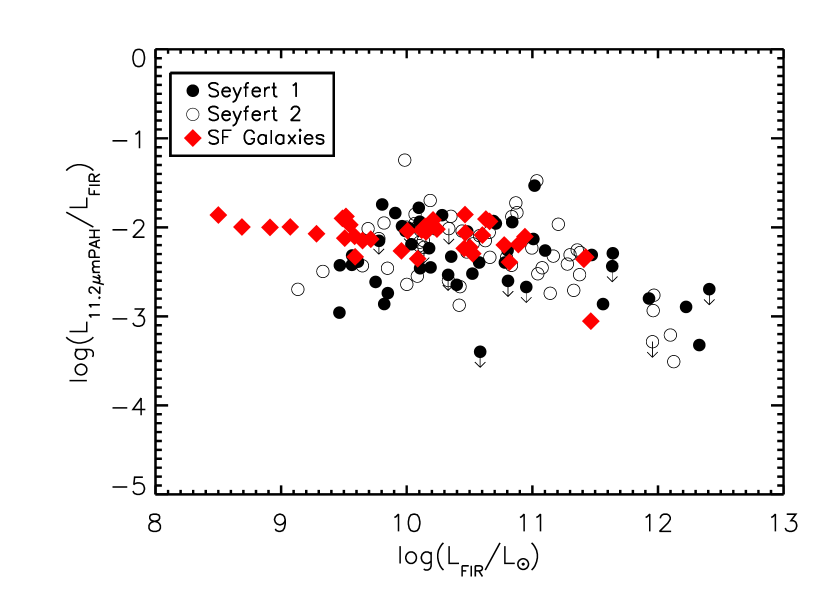
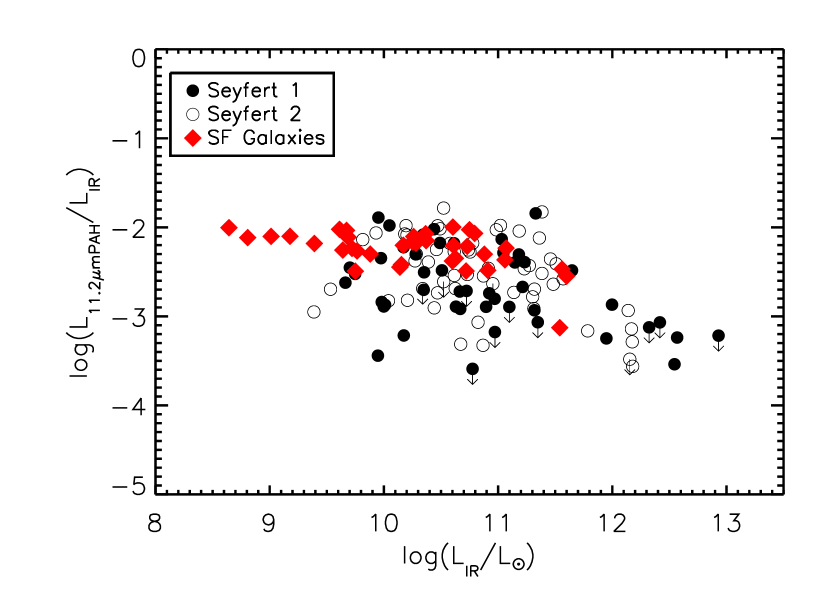
In Figure 15a and 15b, we plot L11.2μmPAH/LFIR and L11.2μmPAH/LIR as a function of the far-infrared (FIR) luminosity161616Calculated from the IRAS flux densities following the prescription of Sanders & Mirabel (1996): LFIR=5.6105D() and the total IR luminosity for the Seyferts and SF galaxies. For both the SF galaxies and the Seyferts, their PAH luminosity appear to have a nearly constant fraction of their FIR luminosity, which would be expected since both quantities have been used as indicators of the star-formation rate. However, for a given PAH luminosity, Seyfert galaxies display an excess in the total IR luminosity compared to starburst systems. This is also understood as the total IR luminosity is the sum of mid-IR and FIR luminosity and consequently it is affected by the AGN emission in the mid-IR. We propose a simple method to the mid-IR excess and estimate the AGN contribution to the 12 m luminosity.
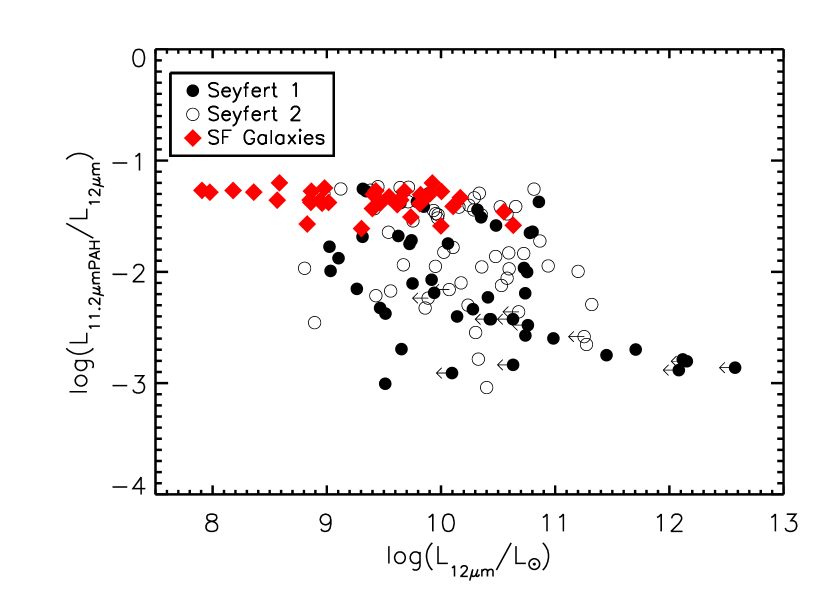
In Figure 16, we plot the L11.2μmPAH/L12μm versus the 12 m luminosity for the Seyfert and SF galaxies. There is a clear correlation for SF galaxies with an average L(11.2 m PAH)/L(12 m) ratio of 0.0440.010. Since there is no AGN contamination in the 12 m luminosity for these galaxies, we can attribute all mid-IR continuum emission to star formation. Seyfert galaxies display a larger scatter on this plot, and we decompose their 12 m luminosity into two parts: one contributed by the star formation activity, which is proportional to their PAH luminosity, and one due to dust heated by the AGN. If we assume that the star formation component in the 12 m luminosity of Seyferts is associated with the 11.2 m PAH luminosity in the same manner as in SF galaxies, then we can estimate the star formation contribution to the integrated 12 m luminosity of the Seyfert sample. Subtracting this SF contribution from the total 12 m luminosity, we can obtain, in a statistical sense, the corresponding AGN contribution.
To check the validity of this method, we plot in Figure 17 the “AGN fraction” as a function of the IRAC 8 m to IRAS 12 m flux ratios. We define “AGN fraction” as the AGN luminosity estimated using the above method divided by the total 12 m luminosity: AGN fraction (12 m) = (L12μm-LSF)/L12μm. The IRAC 8 m flux will be dominated by PAH emission when PAHs are present, thus normalizing by the 12 m flux provides an estimate of the PAH EW171717A similar approach using Spitzer broad band filters was used successfully by Engelbracht et al. (2008) to estimate the PAH contribution in starburst galaxies.. As one would expect, examining the Seyferts for which an AGN fraction was not a lower limit, an anti-correlation between the two parameters is visible. This suggests that our method of decomposing the 12 m luminosity is reasonable. Since the scatter in the linear fit for SF galaxies in Figure 16 is 25%, this translates directly to the “AGN fraction” we have obtained. We estimate the uncertainty of our calculated “AGN fraction” to be no better than 25%.
5 Conclusions
We have analyzed Spitzer/IRS data for a complete unbiased sample of Seyfert galaxies selected from the IRAS Faint Source Catalog based on their 12 m fluxes. We extended earlier work on the same sample by Buchanan et al. (2006) who have published spectra for 51 objects and explored the continuum shapes and the differences between Seyfert types. In our study, we present 5–35 m low-resolution spectra for 103 objects, nearly 90% of the whole 12 m Seyfert sample. The main results of our study are:
1. The 12 m Seyferts display a variety of mid-IR spectral shapes. The mid-IR continuum slopes of Sy 1s and Sy 2s are on average =-0.850.61 and -1.530.84 respectively, though there is substantial scatter for both types. We identify a group of objects with a local maximum in their mid-IR continuum at 20 m, which is likely due to the presence of a warm 150 K dust component and 18 m emission from astronomical silicates. Emission lines, such as the [NeV] 14.3 m/24.3 m and [OIV] 25.9 m lines, known to be a signature of an AGN are stronger in the average spectra of Sy 1s than those of Sy 2s.
2. PAH emission is detected in both Sy 1s and Sy 2s, with no statistical difference in the relative strength of PAHs between the two types. This suggests that the volume responsible for the bulk of their emission is likely optically thin at 12 m.
3. The 11.2 m PAH EW of the 12 m Seyfert sample correlates well with the IRAS color of the galaxies as indicated by the flux ratio of F25/F60. PAH emission is more suppressed in warmer galaxies, in which the strong AGN activity may destroy the PAH molecules.
4. The 9.7 m silicate feature is rather weak in Sy 1s (Ssil=-0.070.29) while Sy 2s mostly display silicate in absorption (Ssil=-0.460.73). Deep silicate absorption is observed in high luminosity Sy 2s which are classified as ULIRGs, and those with high hydrogen column density estimated from their X-ray emission.
5. The FIR luminosities of the 12 m Seyferts are dominated by star-formation. Their mid-IR luminosity increases by the additional AGN contribution. A method to estimate the AGN contribution to the 12 m luminosity, in a statistical sense, has been proposed and applied to the sample.
References
- Antonucci & Miller (1985) Antonucci, R. R. J., & Miller, J. S. 1985, ApJ, 297, 621
- Antonucci (1993) Antonucci, R. 1993, ARA&A, 31, 473
- Armus et al. (2004) Armus, L., et al. 2004, ApJS, 154, 184
- Armus et al. (2007) Armus, L., et al. 2007, ApJ, 656, 148
- Bassani et al. (2006) Bassani, L., et al. 2006, ApJ, 636, L65
- Bernard-Salas et al. (2009) Bernard-Salas, J. et al. 2009, ApJS, submitted
- Brand et al. (2006) Brand, K., et al. 2006, ApJ, 644, 143
- Brandl et al. (2006) Brandl, B. R., et al. 2006, ApJ, 653, 1129
- Buchanan et al. (2006) Buchanan, C. L., Gallimore, J. F., O’Dea, C. P., Baum, S. A., Axon, D. J., Robinson, A., Elitzur, M., & Elvis, M. 2006, AJ, 132, 401
- Calzetti et al. (2005) Calzetti, D., et al. 2005, ApJ, 633, 871
- Calzetti et al. (2007) Calzetti, D., et al. 2007, ApJ, 666, 870
- Charmandaris (2008) Charmandaris, V. 2008, Infrared Diagnostics of Galaxy Evolution, 381, 3
- Clavel et al. (2000) Clavel, J., et al. 2000, A&A, 357, 839
- Cohen et al. (2003) Cohen, M., Megeath, T.G., Hammersley, P.L., Martin-Luis, F., & Stauffer, J. 2003, AJ, 125, 2645
- Contursi et al. (2000) Contursi, A., et al. 2000, A&A, 362, 310
- de Graauw et al. (1996) de Graauw, T., et al. 1996, A&A, 315, L49
- Deo et al. (2007) Deo, R. P., Crenshaw, D. M., Kraemer, S. B., Dietrich, M., Elitzur, M., Teplitz, H., & Turner, T. J. 2007, ApJ, 671, 124
- Desai et al. (2007) Desai, V., et al. 2007, ApJ, 669, 810
- Desert & Dennefeld (1988) Desert, F. X., & Dennefeld, M. 1988, A&A, 206, 227
- Draine (2003) Draine, B. T. 2003, ARA&A, 41, 241
- Draine & Li (2001) Draine, B. T., & Li, A. 2001, ApJ, 551, 807
- Dudley & Wynn-Williams (1997) Dudley, C. C., & Wynn-Williams, C. G. 1997, ApJ, 488, 720
- Efstathiou & Rowan-Robinson (1995) Efstathiou, A., & Rowan-Robinson, M. 1995, MNRAS, 273, 649
- Elitzur (2008) Elitzur, M. 2008, New Astronomy Review, 52, 274
- Engelbracht et al. (2008) Engelbracht, C. W., Rieke, G. H., Gordon, K. D., Smith, J.-D. T., Werner, M. W., Moustakas, J., Willmer, C. N. A., & Vanzi, L. 2008, ApJ, 678, 804
- Fadda et al. (2002) Fadda, D., Flores, H., Hasinger, G., Franceschini, A., Altieri, B., Cesarsky, C. J., Elbaz, D., & Ferrando, P. 2002, A&A, 383, 838
- Farrah et al. (2007) Farrah, D., et al. 2007, ApJ, 667, 149
- Förster Schreiber et al. (2004) Förster Schreiber, N. M., Roussel, H., Sauvage, M., & Charmandaris, V. 2004, A&A, 419, 501
- Galliano et al. (2008) Galliano, F., Madden, S. C., Tielens, A. G. G. M., Peeters, E., & Jones, A. P. 2008, ApJ, 679, 310
- Genzel et al. (1998) Genzel, R., et al. 1998, ApJ, 498, 579
- Gillett et al. (1975) Gillett, F. C., Kleinmann, D. E., Wright, E. L., & Capps, R. W. 1975, ApJ, 198, L65
- Gilli et al. (2007) Gilli, R., Comastri, A., & Hasinger, G. 2007, A&A, 463, 79
- Gorjian et al. (2007) Gorjian, V., Cleary, K., Werner, M. W., & Lawrence, C. R. 2007, ApJ, 655, L73
- Hao et al. (2005) Hao, L., et al. 2005, ApJ, 625, L75
- Hao et al. (2007) Hao, L., Weedman, D. W., Spoon, H. W. W., Marshall, J. A., Levenson, N. A., Elitzur, M., & Houck, J. R. 2007, ApJ, 655, L77
- Hao et al. (2009) Hao, L., Wu, Y., Charmandaris, V., et al. 2009,ApJ, (submitted)
- Hasinger et al. (2005) Hasinger, G., Miyaji, T., & Schmidt, M. 2005, A&A, 441, 417
- Higdon et al. (2004) Higdon, S. J. U., et al. 2004, PASP, 116, 975
- Ho (2008) Ho, L. C. 2008, ARA&A, 46, 475
- Houck et al. (2004a) Houck, J. R., et al. 2004a, ApJS, 154, 18
- Houck et al. (2004b) Houck, J. R., et al. 2004b, ApJS, 154, 211
- Houck et al. (2005) Houck, J. R., et al. 2005, ApJ, 622, 105
- Kennicutt (1998) Kennicutt, R. C., Jr. 1998, ARA&A, 36, 189
- Kennicutt et al. (2003) Kennicutt, R. C., Jr., et al. 2003, PASP, 115, 928
- Laurent et al. (2000) Laurent, O., Mirabel, I. F., Charmandaris, V., Gallais, P., Madden, S. C., Sauvage, M., Vigroux, L., & Cesarsky, C. 2000, A&A, 359, 887
- Le Floc’h et al. (2005) Le Floc’h, E., et al. 2005, ApJ, 632, 169
- Li et al. (2008) Li, M. P., Shi, Q. J., & Li, A. 2008, MNRAS, 391, L49
- Lutz et al. (2004) Lutz, D., Maiolino, R., Spoon, H. W. W., & Moorwood, A. F. M. 2004, A&A, 418, 465
- Lutz et al. (1998) Lutz, D., Spoon, H. W. W., Rigopoulou, D., Moorwood, A. F. M., & Genzel, R. 1998, ApJ, 505, L103
- Maiolino et al. (1998) Maiolino, R., Salvati, M., Bassani, L., Dadina, M., della Ceca, R., Matt, G., Risaliti, G., & Zamorani, G. 1998, A&A, 338, 781
- Markwardt et al. (2005) Markwardt, C. B., Tueller, J., Skinner, G. K., Gehrels, N., Barthelmy, S. D., & Mushotzky, R. F. 2005, ApJ, 633, L77
- Meléndez et al. (2008a) Meléndez, M., et al. 2008a, ApJ, 682, 94
- Meléndez et al. (2008b) Meléndez, M., Kraemer, S. B., Schmitt, H. R., Crenshaw, D. M., Deo, R. P., Mushotzky, R. F., & Bruhweiler, F. C. 2008b, ApJ, 689, 95
- Nardini et al. (2008) Nardini, E., Risaliti, G., Salvati, M., Sani, E., Imanishi, M., Marconi, A., & Maiolino, R. 2008, MNRAS, 385, L130
- Nenkova et al. (2008) Nenkova, M., Sirocky, M. M., Nikutta, R., Ivezić, Ž., & Elitzur, M. 2008, ApJ, 685, 160
- Peeters et al. (2002) Peeters, E., Hony, S., Van Kerckhoven, C., Tielens, A. G. G. M., Allamandola, L. J., Hudgins, D. M., & Bauschlicher, C. W. 2002, A&A, 390, 1089
- Peeters et al. (2004) Peeters, E., Spoon, H. W. W., & Tielens, A. G. G. M. 2004, ApJ, 613, 986
- Rieke & Low (1975) Rieke, G. H., & Low, F. J. 1975, ApJ, 199, L13
- Roche et al. (1991) Roche, P. F., Aitken, D. K., Smith, C. H., & Ward, M. J. 1991, MNRAS, 248, 606
- Rush et al. (1993) Rush, B., Malkan, M. A., & Spinoglio, L. 1993, ApJS, 89, 1
- Sajina et al. (2007) Sajina, A., Yan, L., Armus, L., Choi, P., Fadda, D., Helou, G., & Spoon, H. 2007, ApJ, 664, 713
- Sanders et al. (1988) Sanders, D. B., Soifer, B. T., Elias, J. H., Neugebauer, G., & Matthews, K. 1988, ApJ, 328, L35
- Sanders & Mirabel (1996) Sanders, D. B., & Mirabel, I. F. 1996, ARA&A, 34, 749
- Sanders et al. (2003) Sanders, D. B., Mazzarella, J. M., Kim, D.-C., Surace, J. A., & Soifer, B. T. 2003, AJ, 126, 1607
- Sazonov et al. (2007) Sazonov, S., Revnivtsev, M., Krivonos, R., Churazov, E., & Sunyaev, R. 2007, A&A, 462, 57
- Schaerer & Stasińska (1999) Schaerer, D., & Stasińska, G. 1999, A&A, 345, L17
- Shi et al. (2007) Shi, Y., et al. 2007, ApJ, 669, 841
- Shu et al. (2007) Shu, X. W., Wang, J. X., Jiang, P., Fan, L. L., & Wang, T. G. 2007, ApJ, 657, 167
- Siebenmorgen et al. (2005) Siebenmorgen, R., Haas, M., Krügel, E., & Schulz, B. 2005, A&A, 436, L5
- Sirocky et al. (2008) Sirocky, M. M., Levenson, N. A., Elitzur, M., Spoon, H. W. W., & Armus, L. 2008, ApJ, 678, 729
- Smith et al. (2007a) Smith, J. D. T., et al. 2007a, ApJ, 656, 770
- Smith et al. (2007b) Smith,J.D.T., et al., 2007b, PASP, 119, 1133
- Spinoglio & Malkan (1989) Spinoglio, L., & Malkan, M. A. 1989, ApJ, 342, 83
- Spinoglio et al. (1995) Spinoglio, L., Malkan, M. A., Rush, B., Carrasco, L., & Recillas-Cruz, E. 1995, ApJ, 453, 616
- Spoon et al. (2007) Spoon, H. W. W., Marshall, J. A., Houck, J. R., Elitzur, M., Hao, L., Armus, L., Brandl, B. R., & Charmandaris, V. 2007, ApJ, 654, L49
- Stern et al. (2005) Stern, D., et al. 2005, ApJ, 631, 163
- Sturm et al. (2002) Sturm, E., Lutz, D., Verma, A., Netzer, H., Sternberg, A., Moorwood, A. F. M., Oliva, E., & Genzel, R. 2002, A&A, 393, 821
- Sturm et al. (2005) Sturm, E., et al. 2005, ApJ, 629, L21
- Sturm et al. (2006) Sturm, E., et al. 2006, ApJ, 653, L13
- Teplitz et al. (2007) Teplitz, H. I., et al. 2007, ApJ, 659, 941
- Thompson et al. (2009) Thompson, G. D., Levenson, N. A., Uddin, S. A., & Sirocky, M. M. 2009, ApJ, 697, 182
- Tommasin et al. (2008) Tommasin, S., Spinoglio, L., Malkan, M. A., Smith, H., González-Alfonso, E., & Charmandaris, V. 2008, ApJ, 676, 836
- Urry & Padovani (1995) Urry, C. M., & Padovani, P. 1995, PASP, 107, 803
- van Dishoeck (2004) van Dishoeck, E. F. 2004, ARA&A, 42, 119
- Verma et al. (2005) Verma, A., Charmandaris, V., Klaas, U., Lutz, D., & Haas, M. 2005, Space Science Reviews, 119, 355
- Voit (1992) Voit, G. M. 1992, MNRAS, 258, 84
- Weedman et al. (2005) Weedman, D. W., et al. 2005, ApJ, 633, 706
- Weedman et al. (2006) Weedman, D., et al. 2006, ApJ, 653, 101
- Weedman & Houck (2008) Weedman, D. & Houck, J. R., 2008, ApJ, 686, 127
- Werner et al. (2004) Werner, M. W., et al. 2004, ApJS, 154, 1
- Worsley et al. (2005) Worsley, M. A., et al. 2005, MNRAS, 357, 1281
- Wu et al. (2005) Wu, H., Cao, C., Hao, C.-N., Liu, F.-S., Wang, J.-L., Xia, X.-Y., Deng, Z.-G., & Young, C. K.-S. 2005, ApJ, 632, L79
- Yan et al. (2005) Yan, L., et al. 2005, ApJ, 628, 604


| Object Name | RA | Dec | IRAS Flux (Jy)aaThe IRAS fluxes are adopted from Rush et al. (1993) and Sanders et al. (2003). The uncertainties in the flux measurements range from a few percent to over 20%, averaging 10%. | log(LIR) | redshift | Type | PID | |||
|---|---|---|---|---|---|---|---|---|---|---|
| J2000 | J2000 | 12 m | 25 m | 60 m | 100 m | (L⊙) | ||||
| Mrk335 | 00h06m19.5s | +20d12m10s | 0.27 | 0.45 | 0.35 | 0.57 | 10.72 | 0.026 | Sy 1bbWe call these sources “20 m peakers”, which have F20/F300.95. | 3269 |
| Mrk938 | 00h11m06.5s | -12d06m26s | 0.35 | 2.39 | 17.05 | 16.86 | 11.48 | 0.020 | Sy 2 | 3269 |
| E12-G21 | 00h40m46.1s | -79d14m24s | 0.22 | 0.19 | 1.51 | 3.22 | 11.03 | 0.030 | Sy 1 | 3269 |
| Mrk348 | 00h48m47.1s | +31d57m25s | 0.49 | 1.02 | 1.43 | 1.43 | 10.62 | 0.015 | Sy 2bbWe call these sources “20 m peakers”, which have F20/F300.95. | 3269 |
| IZw1 | 00h53m34.9s | +12d41m36s | 0.47 | 1.17 | 2.24 | 2.87 | 11.95 | 0.061 | Sy 1 | 14 |
| NGC424 | 01h11m27.6s | -38d05m00s | 1.22 | 1.76 | 2.00 | 1.74 | 10.67 | 0.012 | Sy 2bbWe call these sources “20 m peakers”, which have F20/F300.95. | 3269 |
| NGC526A | 01h23m54.4s | -35d03m56s | 0.23 | 0.48 | 2.31 | 4.08 | 10.78 | 0.019 | Sy 1bbWe call these sources “20 m peakers”, which have F20/F300.95. | 30572 |
| NGC513 | 01h24m26.8s | +33d47m58s | 0.25 | 0.48 | 0.41 | 1.32 | 10.52 | 0.020 | Sy 2 | 3269 |
| F01475-0740 | 01h50m02.7s | -07d25m48s | 0.32 | 0.84 | 1.10 | 1.05 | 10.62 | 0.018 | Sy 2 | 3269 |
| NGC931 | 02h28m14.5s | +31d18m42s | 0.62 | 1.42 | 2.80 | 5.66 | 10.92 | 0.017 | Sy 1 | 3269 |
| NGC1056 | 02h42m48.3s | +28d34m27s | 0.34 | 0.48 | 5.33 | 10.20 | 9.93 | 0.005 | Sy 2 | 3269 |
| NGC1097 | 02h46m19.0s | -30d16m30s | 2.96 | 7.30 | 53.35 | 104.79 | 10.78 | 0.004 | Sy 2 | 159 |
| NGC1125 | 02h51m40.3s | -16d39m04s | 0.32 | 1.00 | 3.71 | 4.04 | 10.46 | 0.011 | Sy 2 | 3269 |
| NGC1143/4 | 02h55m12.2s | -00d11m01s | 0.26 | 0.62 | 5.35 | 11.60 | 10.46 | 0.029 | Sy 2 | 3269ccSL only. |
| M-2-8-39 | 03h00m30.6s | -11d24m57s | 0.35 | 0.46 | 0.54 | 0.85 | 10.95 | 0.029 | Sy 2bbWe call these sources “20 m peakers”, which have F20/F300.95. | 3269 |
| NGC1194 | 03h03m49.1s | -01d06m13s | 0.28 | 0.85 | 0.92 | 0.71 | 10.34 | 0.014 | Sy 2 | 3269 |
| NGC1241 | 03h11m14.6s | -08d55m20s | 0.33 | 0.60 | 4.37 | 10.74 | 10.75 | 0.014 | Sy 2 | 3269 |
| NGC1320 | 03h24m48.7s | -03d02m32s | 0.33 | 1.32 | 2.21 | 2.82 | 10.21 | 0.009 | Sy 2 | 3269 |
| NGC1365 | 03h33m36.4s | -36d08m25s | 5.12 | 14.28 | 94.31 | 165.67 | 11.23 | 0.005 | Sy 1 | 3269 |
| NGC1386 | 03h36m46.2s | -35d59m57s | 0.52 | 1.46 | 5.92 | 9.55 | 9.53 | 0.003 | Sy 2 | 3269 |
| F03450+0055 | 03h47m40.2s | +01d05m14s | 0.29 | 0.39 | 0.87 | 3.92 | 11.10 | 0.031 | Sy 1bbWe call these sources “20 m peakers”, which have F20/F300.95. | 3269 |
| NGC1566 | 04h20m00.4s | -54d56m16s | 1.91 | 3.02 | 22.53 | 58.05 | 10.61 | 0.005 | Sy 1 | 159 |
| 3C120 | 04h33m11.1s | +05d21m16s | 0.43 | 0.67 | 1.55 | 4.82 | 11.33 | 0.033 | Sy 1 | 86 |
| F04385-0828 | 04h40m54.9s | -08d22m22s | 0.59 | 1.70 | 2.91 | 3.55 | 10.82 | 0.015 | Sy 2 | 3269 |
| NGC1667 | 04h48m37.1s | -06d19m12s | 0.63 | 0.71 | 6.27 | 14.92 | 11.02 | 0.015 | Sy 2 | 3269 |
| E33-G2 | 04h55m58.9s | -75d32m28s | 0.24 | 0.47 | 0.82 | 1.84 | 10.52 | 0.018 | Sy 2bbWe call these sources “20 m peakers”, which have F20/F300.95. | 3269 |
| M-5-13-17 | 05h19m35.8s | -32d39m28s | 0.23 | 0.57 | 1.28 | 2.34 | 10.28 | 0.012 | Sy 1 | 3269 |
| F05189-2524 | 05h21m01.5s | -25d21m45s | 0.74 | 3.47 | 13.25 | 11.84 | 12.17 | 0.043 | Sy 2 | 86 |
| Mrk6 | 06h52m12.2s | +74d25m37s | 0.26 | 0.73 | 1.25 | 0.90 | 10.63 | 0.019 | Sy 1bbWe call these sources “20 m peakers”, which have F20/F300.95. | 3269 |
| Mrk9 | 07h36m57.0s | +58d46m13s | 0.23 | 0.39 | 0.76 | 0.98 | 11.15 | 0.040 | Sy 1 | 3269 |
| Mrk79 | 07h42m32.8s | +49d48m35s | 0.36 | 0.73 | 1.55 | 2.35 | 10.90 | 0.022 | Sy 1 | 3269 |
| F07599+6508 | 08h04m33.1s | +64d59m49s | 0.33 | 0.54 | 1.75 | 1.47 | 12.57 | 0.148 | Sy 1 | 105 |
| NGC2639 | 08h43m38.1s | +50d12m20s | 0.24 | 0.27 | 2.03 | 7.18 | 10.34 | 0.011 | Sy 1 | 3269 |
| F08572+3915 | 09h00m25.4s | +39d03m54s | 0.33 | 1.76 | 7.30 | 4.77 | 12.15 | 0.058 | Sy 2 | 105 |
| Mrk704 | 09h18m26.0s | +16d18m19s | 0.42 | 0.60 | 0.36 | 0.45 | 10.97 | 0.029 | Sy 1bbWe call these sources “20 m peakers”, which have F20/F300.95. | 704 |
| UGC5101 | 09h35m51.6s | +61d21m11s | 0.25 | 1.02 | 11.68 | 19.91 | 12.00 | 0.039 | Sy 1 | 105 |
| NGC2992 | 09h45m42.0s | -14d19m35s | 0.63 | 1.38 | 7.51 | 17.22 | 10.51 | 0.008 | Sy 1 | 3269 |
| Mrk1239 | 03h10m53.7s | -02d33m11s | 0.76 | 1.21 | 1.68 | 2.42 | 11.32 | 0.029 | Sy 1bbWe call these sources “20 m peakers”, which have F20/F300.95. | 3269 |
| NGC3031 | 09h55m33.2s | +69d03m55s | 5.86 | 5.42 | 44.73 | 174.02 | 9.70 | 0.001 | Sy 1 | 159 |
| 3C234 | 10h01m49.5s | +28d47m09s | 0.22 | 0.35 | 0.24 | 0.34 | 12.42 | 0.185 | Sy 1bbWe call these sources “20 m peakers”, which have F20/F300.95. | 3624 |
| NGC3079 | 10h01m57.8s | +55d40m47s | 2.54 | 3.61 | 50.67 | 104.69 | 10.62 | 0.004 | Sy 2 | 3269 |
| NGC3227 | 10h23m30.6s | +19d51m54s | 0.94 | 1.83 | 8.42 | 17.30 | 9.97 | 0.004 | Sy 1 | 96 |
| NGC3511 | 11h03m23.8s | -23d05m12s | 1.03 | 0.83 | 8.98 | 21.87 | 9.95 | 0.004 | Sy 1 | 3269 |
| NGC3516 | 11h06m47.5s | +72d34m07s | 0.39 | 0.96 | 2.09 | 2.73 | 10.17 | 0.009 | Sy 1 | 3269 |
| M+0-29-23 | 11h21m12.2s | -02d59m03s | 0.48 | 0.76 | 5.85 | 9.18 | 11.36 | 0.025 | Sy 2 | 3269 |
| NGC3660 | 11h23m32.3s | -08d39m31s | 0.42 | 0.64 | 2.03 | 4.47 | 10.47 | 0.012 | Sy 2 | 3269 |
| NGC3982 | 11h56m28.1s | +55d07m31s | 0.47 | 0.97 | 7.18 | 16.24 | 9.81 | 0.004 | Sy 2 | 3269 |
| NGC4051 | 12h03m09.6s | +44d31m53s | 1.35 | 2.20 | 10.53 | 24.93 | 9.66 | 0.002 | Sy 1 | 3269 |
| UGC7064 | 12h04m43.3s | +31d10m38s | 0.22 | 0.88 | 3.48 | 6.25 | 11.18 | 0.025 | Sy 1 | 3269 |
| NGC4151 | 12h10m32.6s | +39d24m21s | 2.01 | 4.87 | 6.46 | 8.88 | 9.95 | 0.003 | Sy 1bbWe call these sources “20 m peakers”, which have F20/F300.95. | 14 |
| Mrk766 | 12h18m26.5s | +29d48m46s | 0.35 | 1.47 | 3.89 | 4.20 | 10.67 | 0.013 | Sy 1 | 3269 |
| NGC4388 | 12h25m46.7s | +12d39m44s | 1.01 | 3.57 | 10.27 | 14.22 | 10.73 | 0.008 | Sy 2 | 3269 |
| 3C273 | 12h29m06.7s | +02d03m09s | 0.82 | 1.43 | 2.09 | 2.53 | 12.93 | 0.158 | Sy 1bbWe call these sources “20 m peakers”, which have F20/F300.95. | 105 |
| NGC4501 | 12h31m59.2s | +14d25m14s | 2.29 | 2.98 | 19.68 | 62.97 | 10.98 | 0.008 | Sy 2 | 3269 |
| NGC4579 | 12h37m43.5s | +11d49m05s | 1.12 | 0.78 | 5.93 | 21.39 | 10.17 | 0.005 | Sy 1 | 159 |
| NGC4593 | 12h39m39.4s | -05d20m39s | 0.47 | 0.96 | 3.43 | 6.26 | 10.35 | 0.009 | Sy 1 | 3269 |
| NGC4594 | 12h39m59.4s | -11d37m23s | 0.74 | 0.50 | 4.26 | 22.86 | 9.75 | 0.003 | Sy 1 | 159 |
| NGC4602 | 12h40m36.8s | -05d07m59s | 0.58 | 0.65 | 4.75 | 13.30 | 10.44 | 0.008 | Sy 1 | 3269 |
| Tol1238-364 | 12h40m52.8s | -36d45m21s | 0.72 | 2.54 | 8.90 | 13.79 | 10.87 | 0.011 | Sy 2 | 3269 |
| M-2-33-34 | 12h52m12.4s | -13d24m53s | 0.36 | 0.65 | 1.23 | 2.36 | 10.49 | 0.015 | Sy 1 | 3269 |
| Mrk231 | 12h56m14.2s | +56d52m25s | 1.83 | 8.84 | 30.80 | 29.74 | 12.54 | 0.042 | Sy 1 | 105 |
| NGC4922 | 13h01m24.9s | +29d18m40s | 0.27 | 1.48 | 6.21 | 7.33 | 11.31 | 0.024 | Sy 2 | 3237ccSL only. |
| NGC4941 | 13h04m13.1s | -05d33m06s | 0.39 | 0.46 | 1.87 | 4.79 | 9.39 | 0.004 | Sy 2 | 30572 |
| NGC4968 | 13h07m06.0s | -23d40m37s | 0.62 | 1.16 | 2.48 | 3.39 | 10.39 | 0.010 | Sy 2 | 3269 |
| NGC5005 | 13h10m56.2s | +37d03m33s | 1.65 | 2.26 | 22.18 | 63.40 | 10.20 | 0.003 | Sy 2 | 3269 |
| NGC5033 | 13h13m27.5s | +36d35m38s | 1.77 | 2.14 | 16.20 | 50.23 | 10.05 | 0.003 | Sy 1 | 159 |
| M-3-34-63 | 13h22m19.0s | -16d42m30s | 0.95 | 2.88 | 6.22 | 6.37 | 11.38 | 0.021 | Sy 2 | 3269 |
| NGC5135 | 13h25m44.0s | -29d50m01s | 0.63 | 2.38 | 16.86 | 30.97 | 11.27 | 0.014 | Sy 2 | 3269 |
| NGC5194 | 13h29m52.7s | +47d11m43s | 7.21 | 9.56 | 97.42 | 221.21 | 10.18 | 0.002 | Sy 2 | 159 |
| M-6-30-15 | 13h35m53.8s | -34d17m44s | 0.33 | 0.97 | 1.39 | 2.26 | 9.98 | 0.008 | Sy 1bbWe call these sources “20 m peakers”, which have F20/F300.95. | 3269 |
| F13349+2438 | 13h37m18.7s | +24d23m03s | 0.61 | 0.72 | 0.85 | 0.90 | 12.32 | 0.108 | Sy 1bbWe call these sources “20 m peakers”, which have F20/F300.95. | 61 |
| NGC5256 | 13h38m17.5s | +48d16m37s | 0.32 | 1.07 | 7.25 | 10.11 | 11.51 | 0.028 | Sy 2 | 3269 |
| Mrk273 | 13h44m42.1s | +55d53m13s | 0.24 | 2.36 | 22.51 | 22.53 | 12.17 | 0.038 | Sy 2 | 105 |
| I4329A | 13h49m19.2s | -30d18m34s | 1.11 | 2.26 | 2.15 | 2.31 | 10.97 | 0.016 | Sy 1bbWe call these sources “20 m peakers”, which have F20/F300.95. | 3269 |
| NGC5347 | 13h53m17.8s | +33d29m27s | 0.30 | 1.22 | 1.43 | 3.33 | 10.04 | 0.008 | Sy 2 | 3269 |
| Mrk463 | 13h56m02.9s | +18d22m19s | 0.47 | 1.49 | 2.21 | 1.87 | 11.78 | 0.050 | Sy 2 | 105 |
| NGC5506 | 14h13m14.8s | -03d12m27s | 1.29 | 4.17 | 8.42 | 8.87 | 10.44 | 0.006 | Sy 2 | 3269 |
| NGC5548 | 14h17m59.5s | +25d08m12s | 0.43 | 0.81 | 1.07 | 2.07 | 10.66 | 0.017 | Sy 1 | 30572 |
| Mrk817 | 14h36m22.1s | +58d47m39s | 0.38 | 1.42 | 2.33 | 2.35 | 11.35 | 0.031 | Sy 1 | 3269 |
| NGC5929 | 15h26m06.1s | +41d40m14s | 0.43 | 1.67 | 9.52 | 13.84 | 10.58 | 0.008 | Sy 2 | 3269 |
| NGC5953 | 15h34m32.4s | +15d11m38s | 0.82 | 1.58 | 11.79 | 19.89 | 10.49 | 0.007 | Sy 2 | 3269 |
| Arp220 | 15h34m57.1s | +23d30m11s | 0.61 | 8.00 | 104.09 | 115.29 | 12.18 | 0.018 | Sy 2 | 105 |
| M-2-40-4 | 15h48m24.9s | -13d45m28s | 0.41 | 1.45 | 4.09 | 7.06 | 11.32 | 0.025 | Sy 2 | 3269 |
| F15480-0344 | 15h50m41.5s | -03d53m18s | 0.24 | 0.72 | 1.09 | 4.05 | 11.14 | 0.030 | Sy 2 | 3269 |
| F19254-7245 | 19h31m21.4s | -72d39m18s | 0.26 | 1.35 | 5.24 | 8.03 | 12.14 | 0.062 | Sy 2 | 105 |
| NGC6810 | 19h43m34.4s | -58d39m21s | 1.27 | 3.55 | 18.20 | 32.60 | 10.74 | 0.007 | Sy 2 | 3269 |
| NGC6860 | 20h08m46.9s | -61d06m01s | 0.25 | 0.31 | 0.96 | 2.19 | 10.35 | 0.015 | Sy 1bbWe call these sources “20 m peakers”, which have F20/F300.95. | 3269 |
| NGC6890 | 20h18m18.1s | -44d48m25s | 0.36 | 0.80 | 4.01 | 8.26 | 10.27 | 0.008 | Sy 2 | 3269 |
| Mrk509 | 20h44m09.7s | -10d43m25s | 0.30 | 0.73 | 1.39 | 1.36 | 11.21 | 0.034 | Sy 1 | 86 |
| I5063 | 20h52m02.3s | -57d04m08s | 1.11 | 3.94 | 5.87 | 4.25 | 10.87 | 0.011 | Sy 2 | 30572 |
| UGC11680 | 21h07m43.6s | +03d52m30s | 0.37 | 0.86 | 2.97 | 5.59 | 11.23 | 0.026 | Sy 2 | 3269 |
| NGC7130 | 21h48m19.5s | -34d57m05s | 0.58 | 2.16 | 16.71 | 25.89 | 11.38 | 0.016 | Sy 2 | 3269 |
| NGC7172 | 22h02m01.9s | -31d52m11s | 0.42 | 0.88 | 5.76 | 12.42 | 10.47 | 0.009 | Sy 2 | 30572 |
| NGC7213 | 22h09m16.2s | -47d10m00s | 0.65 | 0.81 | 2.70 | 8.99 | 10.01 | 0.006 | Sy 1bbWe call these sources “20 m peakers”, which have F20/F300.95. | 86 |
| NGC7314 | 22h35m46.2s | -26d03m01s | 0.55 | 0.96 | 5.24 | 16.57 | 10.00 | 0.005 | Sy 1 | 30572 |
| M-3-58-7 | 22h49m37.1s | -19d16m26s | 0.25 | 0.98 | 2.60 | 3.62 | 11.30 | 0.031 | Sy 2 | 3269 |
| NGC7469 | 23h03m15.6s | +08d52m26s | 1.59 | 5.96 | 27.33 | 35.16 | 11.65 | 0.016 | Sy 1 | 3269 |
| NGC7496 | 23h09m47.3s | -43d25m41s | 0.58 | 1.93 | 10.14 | 16.57 | 10.28 | 0.006 | Sy 2 | 3269 |
| NGC7582 | 23h18m23.5s | -42d22m14s | 2.30 | 7.39 | 52.20 | 82.86 | 10.91 | 0.005 | Sy 2 | 3269 |
| NGC7590 | 23h18m54.8s | -42d14m21s | 0.69 | 0.89 | 7.69 | 20.79 | 10.19 | 0.005 | Sy 2 | 3269 |
| NGC7603 | 23h18m56.6s | +00d14m38s | 0.40 | 0.24 | 1.25 | 2.00 | 11.05 | 0.030 | Sy 1bbWe call these sources “20 m peakers”, which have F20/F300.95. | 3269 |
| NGC7674 | 23h27m56.7s | +08d46m45s | 0.68 | 1.92 | 5.36 | 8.33 | 11.57 | 0.029 | Sy 2 | 3269 |
| CGCG381-051 | 23h48m41.7s | +02d14m23s | 0.51 | 0.18 | 1.75 | 2.76 | 11.19 | 0.031 | Sy 2 | 3269 |
| Object Name | EW(6.2 m) | F(6.2 m) | EW(11.2 m) | F(11.2 m) | Silicate StrengthaaThe error in the silicate measurement is determined by the S/N of the continuum flux, which has an absolute uncertainty of 5%. | Aperture Size | Projected Size |
|---|---|---|---|---|---|---|---|
| (m) | (10-20 W cm-2) | (m) | (10-20 W cm-2) | () | (kpc) | ||
| Mrk335 | 0.074 | 5.17 | 0.039 | 1.33 | 0.157 | 20.415.3 | 11.38.4 |
| Mrk938 | 0.4400.018 | 33.50.9 | 0.6900.042 | 22.10.7 | -0.991 | 20.415.3 | 8.66.5 |
| E12-G21 | 0.2780.017 | 10.90.3 | 0.3250.005 | 7.530.03 | -0.022 | 20.415.3 | 13.09.8 |
| Mrk348 | 0.083 | 5.78 | 0.0580.013 | 2.320.50 | -0.333 | 20.415.3 | 6.44.8 |
| IZw1 | 0.018 | 2.90 | 0.0180.002 | 2.100.27 | 0.284 | 10.2bbSpectrum extracted from IRS staring mode. The size of the LL slit is 2 pixel wide, where 1 pixel5.1. | 13.6 |
| NGC424 | 0.024 | 6.95 | 0.0100.001 | 1.530.09 | -0.111 | 20.415.3 | 5.13.9 |
| NGC526A | 0.240 | 1.60 | 0.012 | 0.62 | 0.033 | 10.2bbSpectrum extracted from IRS staring mode. The size of the LL slit is 2 pixel wide, where 1 pixel5.1. | 4.1 |
| NGC513 | 0.3340.107 | 9.501.5 | 0.4740.033 | 9.350.37 | 0.149 | 20.415.3 | 8.66.5 |
| F01475-0740 | 0.177 | 4.74 | 0.0810.009 | 2.750.22 | 0.188 | 20.415.3 | 7.75.8 |
| NGC931 | 0.060 | 7.47 | 0.0650.002 | 4.530.20 | -0.026 | 20.415.3 | 7.35.5 |
| NGC1056 | 0.4860.125 | 26.93.6 | 0.8030.039 | 22.40.5 | 0.084 | 20.415.3 | 2.11.6 |
| NGC1097 | 0.3270.003 | 1033 | 0.6570.001 | 1161 | 0.099 | 5033 | 4.22.8 |
| NGC1125 | 0.2580.049 | 7.751.17 | 0.4260.025 | 7.160.15 | -1.022 | 20.415.3 | 4.73.5 |
| NGC1143/4 | 0.3430.067 | 18.21.5 | 0.5740.028 | 13.00.3 | ccTo measure the silicate feature, a complete 5-35 m spectrum is needed. This source only has an SL spectrum from 5-14.5 m. | 19.816.2 | 12.210.0 |
| M-2-8-39 | 0.128 | 2.98 | 0.047 | 1.19 | -0.076 | 20.415.3 | 12.69.4 |
| NGC1194 | 0.059 | 5.05 | 0.077 | 2.47 | -0.978 | 20.415.3 | 6.04.5 |
| NGC1241 | 0.4610.024 | 8.130.34 | 0.5010.026 | 5.010.01 | -0.908 | 20.415.3 | 6.04.5 |
| NGC1320 | 0.0820.019 | 6.861.24 | 0.0740.003 | 4.600.11 | -0.065 | 20.415.3 | 3.82.9 |
| NGC1365 | 0.3680.003 | 1731 | 0.4320.015 | 1203 | -0.229 | 20.415.3 | 2.11.6 |
| NGC1386 | 0.0530.022 | 5.891.81 | 0.1330.002 | 9.130.07 | -0.542 | 20.415.3 | 1.31.0 |
| F03450+0055 | 0.103 | 6.58 | 0.038 | 1.62 | 0.027 | 20.415.3 | 13.510.1 |
| NGC1566 | 0.2230.034 | 27.62.8 | 0.4700.004 | 32.20.4 | 0.105 | 5033 | 5.23.4 |
| 3C120 | 0.015 | 1.35 | 0.0140.002 | 0.9040.142 | 0.130 | 10.2bbSpectrum extracted from IRS staring mode. The size of the LL slit is 2 pixel wide, where 1 pixel5.1. | 7.2 |
| F04385-0828 | 0.058 | 8.03 | 0.0360.011 | 2.160.62 | -0.766 | 20.415.3 | 6.44.8 |
| NGC1667 | 0.3910.073 | 17.31.5 | 0.7310.091 | 15.61.0 | -0.050 | 20.415.3 | 6.44.8 |
| E33-G2 | 0.102 | 6.25 | 0.076 | 2.70 | -0.247 | 20.415.3 | 7.75.8 |
| M-5-13-17 | 0.2000.004 | 6.650.06 | 0.1930.047 | 5.220.92 | -0.206 | 20.415.3 | 5.13.9 |
| F05189-2524 | 0.0370.001 | 6.540.16 | 0.0620.003 | 8.020.35 | -0.315 | 10.2bbSpectrum extracted from IRS staring mode. The size of the LL slit is 2 pixel wide, where 1 pixel5.1. | 9.3 |
| Mrk6 | 0.097 | 6.32 | 0.0440.001 | 1.590.03 | -0.036 | 20.415.3 | 8.26.1 |
| Mrk9 | 0.142 | 8.12 | 0.1160.030 | 3.540.82 | 0.050 | 20.415.3 | 17.513.1 |
| Mrk79 | 0.039 | 4.05 | 0.0430.011 | 2.220.54 | -0.079 | 20.415.3 | 9.57.1 |
| F07599+6508 | 0.0270.001 | 3.360.14 | 0.0180.001 | 0.970.06 | 0.113 | 10.2bbSpectrum extracted from IRS staring mode. The size of the LL slit is 2 pixel wide, where 1 pixel5.1. | 35.0 |
| NGC2639 | 0.207 | 5.40 | 0.5300.036 | 4.700.19 | -0.127 | 20.415.3 | 4.73.5 |
| F08572+3915 | 0.021 | 5.25 | 0.099 | 2.36 | -3.509 | 10.2bbSpectrum extracted from IRS staring mode. The size of the LL slit is 2 pixel wide, where 1 pixel5.1. | 12.9 |
| Mrk704 | 0.071 | 7.38 | 0.029 | 1.58 | -0.075 | 20.415.3 | 12.69.4 |
| UGC5101 | 0.2290.004 | 12.30.2 | 0.4230.007 | 10.10.1 | -1.619 | 10.2bbSpectrum extracted from IRS staring mode. The size of the LL slit is 2 pixel wide, where 1 pixel5.1. | 8.6 |
| NGC2992 | 0.1510.006 | 15.30.2 | 0.2370.014 | 15.80.6 | -0.200 | 20.415.3 | 3.42.6 |
| Mrk1239 | 0.029 | 7.18 | 0.0270.001 | 3.190.20 | 0.010 | 20.415.3 | 12.69.4 |
| NGC3031 | 0.034 | 16.8 | 0.1830.002 | 23.20.2 | -0.035 | 5033 | 1.00.7 |
| 3C234 | 0.019 | 0.82 | 0.013 | 0.45 | -0.007 | 10.2bbSpectrum extracted from IRS staring mode. The size of the LL slit is 2 pixel wide, where 1 pixel5.1. | 44.6 |
| NGC3079 | 0.4580.006 | 1112 | 0.8180.050 | 62.62.0 | -0.828 | 20.415.3 | 1.71.3 |
| NGC3227 | 0.1380.003 | 24.00.5 | 0.2490.007 | 29.00.6 | -0.234 | 10.2bbSpectrum extracted from IRS staring mode. The size of the LL slit is 2 pixel wide, where 1 pixel5.1. | 0.8 |
| NGC3511 | 0.6380.168 | 18.01.5 | 0.7640.046 | 12.70.4 | 0.009 | 20.415.3 | 1.71.3 |
| NGC3516 | 0.061 | 6.57 | 0.0240.004 | 1.220.24 | -0.158 | 20.415.3 | 3.82.9 |
| M+0-29-23 | 0.4370.099 | 21.02.5 | 0.6190.082 | 16.71.1 | -0.507 | 20.415.3 | 10.88.1 |
| NGC3660 | 0.434 | 5.10 | 0.5390.100 | 2.970.34 | -0.020 | 20.415.3 | 5.13.9 |
| NGC3982 | 0.4670.058 | 14.41.1 | 0.7870.049 | 14.00.3 | 0.110 | 20.415.3 | 1.71.3 |
| NGC4051 | 0.0790.015 | 9.201.20 | 0.1140.002 | 9.990.13 | 0.065 | 20.415.3 | 0.80.6 |
| UGC7064 | 0.3640.015 | 7.900.21 | 0.5270.055 | 7.870.43 | -0.031 | 20.415.3 | 10.88.1 |
| NGC4151 | 0.011 | 6.98 | 0.0110.002 | 4.820.91 | 0.030 | 10.2bbSpectrum extracted from IRS staring mode. The size of the LL slit is 2 pixel wide, where 1 pixel5.1. | 0.7 |
| Mrk766 | 0.0360.013 | 3.081.06 | 0.0730.023 | 4.381.21 | -0.274 | 20.415.3 | 5.64.2 |
| NGC4388 | 0.1280.013 | 15.01.2 | 0.2030.046 | 14.32.5 | -0.699 | 20.415.3 | 3.42.6 |
| 3C273 | 0.013 | 2.17 | 0.014 | 1.03 | 0.064 | 10.2bbSpectrum extracted from IRS staring mode. The size of the LL slit is 2 pixel wide, where 1 pixel5.1. | 37.6 |
| NGC4501 | 0.187 | 6.96 | 0.6290.051 | 6.910.26 | -0.232 | 20.415.3 | 3.42.6 |
| NGC4579 | 0.1520.039 | 14.42.6 | 0.2620.054 | 8.861.43 | 0.218 | 5033 | 5.33.5 |
| NGC4593 | 0.0440.005 | 4.820.57 | 0.0890.014 | 6.100.85 | 0.063 | 20.415.3 | 3.82.9 |
| NGC4594 | 0.0520.002 | 13.10.5 | 0.1610.024 | 7.560.97 | -0.036 | 5033 | 3.62.3 |
| NGC4602 | 0.3260.194 | 4.611.54 | 0.5980.038 | 5.210.17 | -0.010 | 20.415.3 | 3.42.6 |
| Tol1238-364 | 0.1850.003 | 15.10.2 | 0.1940.005 | 14.60.3 | -0.312 | 20.415.3 | 4.73.5 |
| M-2-33-34 | 0.304 | 5.11 | 0.2050.016 | 3.010.17 | -0.209 | 20.415.3 | 6.44.8 |
| Mrk231 | 0.0110.001 | 7.500.39 | 0.0280.001 | 8.770.35 | -0.640 | 10.2bbSpectrum extracted from IRS staring mode. The size of the LL slit is 2 pixel wide, where 1 pixel5.1. | 9.2 |
| NGC4922 | 0.1520.008 | 7.220.35 | 0.1220.006 | 5.820.29 | ccTo measure the silicate feature, a complete 5-35 m spectrum is needed. This source only has an SL spectrum from 5-14.5 m. | 10.2 | 5.1 |
| NGC4941 | 0.041 | 1.06 | 0.0380.016 | 0.820.34 | -0.084 | 10.2bbSpectrum extracted from IRS staring mode. The size of the LL slit is 2 pixel wide, where 1 pixel5.1. | 0.8 |
| NGC4968 | 0.1720.010 | 9.110.44 | 0.1270.003 | 6.560.13 | -0.206 | 20.415.3 | 4.33.2 |
| NGC5005 | 0.1920.015 | 18.21.3 | 0.7350.018 | 28.80.1 | -0.425 | 20.415.3 | 1.31.0 |
| NGC5033 | 0.3190.060 | 76.88.8 | 0.7640.065 | 84.43.3 | -0.116 | 5033 | 3.12.1 |
| M-3-34-63 | 0.9150.325 | 4.270.61 | 1.1280.215 | 3.240.23 | 0.090 | 20.415.3 | 9.16.8 |
| NGC5135 | 0.3840.032 | 41.61.9 | 0.5940.039 | 39.21.3 | -0.367 | 20.415.3 | 6.04.5 |
| NGC5194 | 0.3720.014 | 1113 | 0.6860.010 | 1181 | 0.109 | 5033 | 2.11.4 |
| M-6-30-15 | 0.063 | 6.33 | 0.0520.007 | 3.010.40 | -0.108 | 20.415.3 | 3.42.6 |
| F13349+2438 | 0.008 | 2.06 | 0.013 | 1.69 | 0.038 | 10.2bbSpectrum extracted from IRS staring mode. The size of the LL slit is 2 pixel wide, where 1 pixel5.1. | 24.7 |
| NGC5256 | 0.6080.045 | 19.90.9 | 0.5450.068 | 10.80.9 | -0.692 | 20.415.3 | 12.19.1 |
| Mrk273 | 0.1920.003 | 13.00.2 | 0.3350.006 | 8.350.12 | -1.746 | 10.2bbSpectrum extracted from IRS staring mode. The size of the LL slit is 2 pixel wide, where 1 pixel5.1. | 8.2 |
| I4329A | 0.020 | 6.20 | 0.016 | 2.85 | -0.077 | 20.415.3 | 6.95.1 |
| NGC5347 | 0.112 | 4.37 | 0.0680.003 | 3.290.15 | -0.251 | 20.415.3 | 3.42.6 |
| Mrk463 | 0.008 | 1.79 | 0.0240.002 | 2.780.22 | -0.464 | 10.2bbSpectrum extracted from IRS staring mode. The size of the LL slit is 2 pixel wide, where 1 pixel5.1. | 11.1 |
| NGC5506 | 0.0230.001 | 10.80.3 | 0.0600.004 | 9.800.67 | -0.852 | 20.415.3 | 2.61.9 |
| NGC5548 | 0.0180.005 | 1.080.32 | 0.0470.007 | 2.710.38 | 0.040 | 10.2bbSpectrum extracted from IRS staring mode. The size of the LL slit is 2 pixel wide, where 1 pixel5.1. | 3.7 |
| Mrk817 | 0.109 | 7.60 | 0.035 | 1.72 | -0.032 | 20.415.3 | 13.510.1 |
| NGC5929 | 0.480 | 4.44 | 0.7750.087 | 3.500.22 | 0.245 | 20.415.3 | 3.42.6 |
| NGC5953 | 0.6840.039 | 52.91.4 | 0.8770.050 | 40.70.1 | -0.068 | 20.415.3 | 3.02.2 |
| Arp220 | 0.3440.006 | 22.20.3 | 0.5520.023 | 15.40.6 | -2.543 | 10.2bbSpectrum extracted from IRS staring mode. The size of the LL slit is 2 pixel wide, where 1 pixel5.1. | 3.9 |
| M-2-40-4 | 0.0660.002 | 8.250.17 | 0.1190.004 | 8.290.21 | -0.068 | 20.415.3 | 10.88.1 |
| F15480-0344 | 0.190 | 5.29 | 0.0750.016 | 2.450.48 | -0.159 | 20.415.3 | 13.09.8 |
| F19254-7245 | 0.0640.002 | 5.090.18 | 0.1340.006 | 5.060.22 | -1.345 | 10.2bbSpectrum extracted from IRS staring mode. The size of the LL slit is 2 pixel wide, where 1 pixel5.1. | 13.7 |
| NGC6810 | 0.4190.020 | 56.11.4 | 0.4630.002 | 46.40.3 | -0.158 | 20.415.3 | 3.02.2 |
| NGC6860 | 0.0840.018 | 6.321.28 | 0.0950.008 | 3.590.28 | 0.005 | 20.415.3 | 6.44.8 |
| NGC6890 | 0.2370.020 | 9.660.57 | 0.2770.028 | 8.330.58 | -0.054 | 20.415.3 | 3.42.6 |
| Mrk509 | 0.0420.002 | 4.920.19 | 0.0680.002 | 4.770.16 | -0.002 | 10.2bbSpectrum extracted from IRS staring mode. The size of the LL slit is 2 pixel wide, where 1 pixel5.1. | 7.5 |
| I5063 | 0.0110.002 | 2.140.34 | 0.0190.002 | 3.960.40 | -0.263 | 10.2bbSpectrum extracted from IRS staring mode. The size of the LL slit is 2 pixel wide, where 1 pixel5.1. | 2.4 |
| UGC11680 | 0.334 | 7.77 | 0.1660.019 | 2.500.25 | 0.142 | 20.415.3 | 11.38.4 |
| NGC7130 | 0.4930.044 | 32.71.9 | 0.4300.001 | 25.20.1 | -0.227 | 20.415.3 | 6.95.2 |
| NGC7172 | 0.0450.001 | 9.250.29 | 0.2040.009 | 7.520.05 | -1.795 | 10.2bbSpectrum extracted from IRS staring mode. The size of the LL slit is 2 pixel wide, where 1 pixel5.1. | 1.9 |
| NGC7213 | 0.0220.002 | 1.730.20 | 0.0370.007 | 2.880.51 | 0.236 | 10.2bbSpectrum extracted from IRS staring mode. The size of the LL slit is 2 pixel wide, where 1 pixel5.1. | 1.2 |
| NGC7314 | 0.0630.007 | 1.630.18 | 0.0870.013 | 1.870.27 | -0.476 | 10.2bbSpectrum extracted from IRS staring mode. The size of the LL slit is 2 pixel wide, where 1 pixel5.1. | 1.0 |
| M-3-58-7 | 0.0740.002 | 5.580.13 | 0.0990.024 | 5.031.10 | -0.047 | 20.415.3 | 13.510.1 |
| NGC7469 | 0.2930.003 | 60.80.5 | 0.2880.012 | 45.41.2 | -0.159 | 20.415.3 | 6.95.2 |
| NGC7496 | 0.9120.189 | 44.64.5 | 0.5900.002 | 21.60.1 | -0.626 | 20.415.3 | 2.61.9 |
| NGC7582 | 0.2740.023 | 1015 | 0.4570.006 | 77.10.3 | -0.833 | 20.415.3 | 2.21.6 |
| NGC7590 | 0.4960.005 | 14.00.1 | 0.8540.082 | 13.00.5 | 0.023 | 20.415.3 | 2.21.6 |
| NGC7603 | 0.0560.004 | 7.080.53 | 0.1210.006 | 6.220.24 | 0.211 | 20.415.3 | 13.09.8 |
| NGC7674 | 0.1320.006 | 14.20.4 | 0.1290.013 | 10.00.8 | -0.215 | 20.415.3 | 12.69.4 |
| CGCG381-051 | 0.5420.031 | 5.070.16 | 0.2110.037 | 4.040.47 | 0.316 | 20.415.3 | 13.510.1 |
| Seyfert 1 | Seyfert 2 | |||
|---|---|---|---|---|
| EW(m) | Sources | EW(m) | Sources | |
| Whole sampleaaValues calculated including the upper limits on PAH EWs. | 0.1540.216 | 47 | 0.3520.312 | 56 |
| Whole samplebbValues calculated excluding the upper limits on PAH EWs. | 0.2050.215 | 37 | 0.3840.299 | 52 |
| LIR1011L⊙aaValues calculated including the upper limits on PAH EWs. | 0.1710.235 | 29 | 0.3560.318 | 35 |
| LIR1011L⊙aaValues calculated including the upper limits on PAH EWs. | 0.1270.184 | 18 | 0.3450.310 | 21 |
| LIR1011L⊙bbValues calculated excluding the upper limits on PAH EWs. | 0.2170.232 | 24 | 0.3950.303 | 32 |
| LIR1011L⊙bbValues calculated excluding the upper limits on PAH EWs. | 0.1850.188 | 13 | 0.3670.300 | 20 |
| F25/F600.2aaValues calculated including the upper limits on PAH EWs. | 0.0680.116 | 33 | 0.1430.237 | 30 |
| F25/F600.2aaValues calculated including the upper limits on PAH EWs. | 0.3580.262 | 14 | 0.5920.191 | 26 |
| F25/F600.2bbValues calculated excluding the upper limits on PAH EWs. | 0.1020.119 | 24 | 0.1770.237 | 26 |
| F25/F600.2bbValues calculated excluding the upper limits on PAH EWs. | 0.3970.227 | 13 | 0.5920.191 | 26 |