Chromospheric changes in K stars with activity
Abstract
We study the differences in chromospheric structure induced in K stars by stellar activity, to expand our previous work for G stars, including the Sun as a star. We selected six stars of spectral type K with 0.820.90, including the widely studied Epsilon Eridani and a variety of magnetic activity levels. We computed chromospheric models for the stars in the sample, in most cases in two different moments of activity. The models were constructed to obtain the best possible match with the Ca II K and the H observed profiles. We also computed in detail the net radiative losses for each model to constrain the heating mechanism that can maintain the structure in the atmosphere. We find a strong correlation between these losses and S, the index generally used as a proxy for activity, as we found for G stars.
keywords:
radiative transfer - stars: atmosphere - stars: activity1 Introduction
Solar and stellar chromospheric models have been developed to study the dependency of chromospheric plasma parameters with height and temperature. The best known examples are the models for the solar atmosphere computed by E. Avrett and his co-workers, in particular model C for the average quit Sun by val, which was later modified by fon93
In several cases, these models were used to characterize changes due to activity and spectral type. For example, Kelch et al. (1979) studied a sample of eight main-sequence stars ranging in spectral type from F0 to M0, some of which were of similar spectral type and different levels of chromospheric activity. They computed the photospheric structure starting from a radiative equilibrium model for the of each star and fitting the
2 Our stellar sample
| HD (Name) | S. type | (K) | Fe/H | / | / | Min | Max | ||
|---|---|---|---|---|---|---|---|---|---|
| 17925 (V* EP Eri) | K1 V | 0.86 | 4956 | 0.10 | 0.662 | 0.792/0.584 | 0.566/0.520 | 11/22/02 | 12/5/03 |
| 22049 ( Eri) | K2 V | 0.88 | 5110 | -0.14 | 0.483 | 0.555/0.468 | 0.440/0.389 | 11/21/02 | 3/9/04 |
| 26965 (V* DY Eri) | K1 V | 0.82 | 5203 | -0.25 | 0.185 | 0.188/0.149 | 0.138/0.147 | 3/9/04 | 8/11/00 |
| 37572 (V* UY Pic) | K0 V | 0.85 | 5175 | — | 0.952 | 0.703/0.687 | 0.691/— | — | 11/24/04 |
| 128621 ( Cen B) | K1 V | 0.90 | 5037 | 0.24 | 0.209 | 0.247/0.180 | 0.164/0.139 | 8/13/00 | 9/11/03 |
| 177996 (—) | K1 V | 0.86 | 5092 | — | 0.861 | 0.821/0.798 | 0.613/— | — | 6/27/02 |
The largest observational study of chromospheric activity is the one started in 1966 at the Mount Wilson Observatory, which at present includes more than 2200 stars in the spectral range between F and early K. As the indicator of chromospheric stellar activity, they use the S index, which is the ratio of the fluxes in the H and K line cores and two nearby reference windows 20 Å wide (vau78). The emission in the cores of these lines increase with increasing chromospheric activity, with increasing surface magnetism. In this work we used the same activity indicator.
To select the stars in our sample, we require that , a colour similar to Eri, and that the magnetic activity levels are different. All the stars are part of the library of southern late-type dwarfs published by cin04 (cin04, hereafter CM04).
The stellar parameters of the stars in our sample are listed in Table 1. In the third column we list the spectral type, in the fourth to sixth columns we indicate the colour index , and the metallicity. In column 7 we show the mean values of the S index obtained at the Cerro Tololo InterAmerican Observatory (he96), and in columns 8 and 9 the maximum and minimum S obtained from our spectra (see Cincunegui et al. 2007 for details on how this index is obtained) and from the models we built in this paper. Finally, in the last two columns of Table 1 we include the observing dates of each spectrum used in the present work.
The observations were made at the 2.15 m telescope of the Complejo Astronomico El Leoncito (CASLEO), located in San Juan, Argentina. They were obtained with a REOSC spectrograph designed to work between 3500 and 7500 Å and a 1024 x 1024 pixel TEK CCD as detector. The spectral resolution ranges from 0.141 to 0.249 Å per pixel (). We refer the reader to CM04 for more details on the observations and the data reduction.
For all the stars, we have several spectra obtained in different observing runs. To study the differences in atmospheric structure with activity level, in this paper we consider, in most cases, two spectra for each star, chosen between those with the better signal to noise ratio. Generally we selected the spectra showing the lowest and the highest levels of activity, except for HD 177996 and HD 37572, for which the least active spectra are very similar to the most active ones of HD 22049 and HD 17925 respectively. In this way, we built 10 different models. It is important to note, given the dependence of activity level with the observation time, that all the line profiles used to build the models are simultaneous.
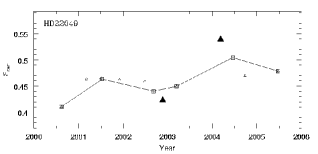
In Figure 1 we show the S index of Eri obtained from our observations (open triangles). The two spectra modeled in this paper are represented by full triangles. The difference in the Ca II K line flux between the maximum and minimum is 17%. With squares we also present the annual average of the S index. For details on the variability of Eri, see bu.
3 The chromospheric models
For each star we built a different chromospheric model, assuming one-dimensional, plane-parallel atmospheres. We simultaneously solved the equations of hydrostatic equilibrium, radiative transfer and statistical equilibrium, using the computer code Pandora. A description of this code can be found in av03.
For a given distribution of temperature with height, we self-consistently computed non-LTE populations for 15 levels of H, 13 of He I, 6 of He II, 15 of Fe I, 8 of Ca I, 5 of Ca II, 7 of Mg I, 6 of Mg II, 21 of Si I, 8 of Na I and 6 of Al I. The atomic models we used for H and Ca II are described in ma97 and fa98. The
3.1 Stellar parameters for Eri
Before building the model atmosphere, a set of atmospheric parameters has to be determined. Both the surface gravity and the metallicity are fundamental input parameters in any atmospheric model, and the effective temperature, although is not needed as input, is used in Ec. 2 to calculate the stellar surface flux needed to analyze the results.
In Table 2 we summarize several values of these quantities that can be found in the literature. Given the astrophysical interest on Eri, dra93 recognized the necessity of determining these parameters with high precision and they summarized the methods used to obtain them until 1993, and the validity of these determinations. To improve these values, they determined the surface gravity, metallicity and effective temperature in a self-consistent way, comparing the equivalent widths of several Fe I, Fe II and Ca I lines with theoretical profiles from different model atmospheres. The parameters derived by dra93 were used in the most recent model for Eri by sim05 (sim05, hereafter SJ05), although they recognized that the value of log(g) adopted could be too high (private communication).
The difficulty in the calculation of the surface gravity is that it is indirectly determined from the values of mass and stellar radius. Since these two parameters can be calculated more precisely for stars in binary systems, we studied another star of our sample, Centauri B (HD 128621), pertaining to the system Centauri AB. For close systems like this visual binary, the stellar radii and masses can be derived with an error of 1 to 10% (guedem).
According to cay01, the values of log(g) found for Cen B range from 4.51 to 4.73, with an average value of 4.60. We therefore adopted a value of for all the stars in our sample, since this value is contained in the range given by dra93, considering the error in their calculation (). This same value of log(g) was adopted by nes08 in their recent study of the corona and transition region of Eri.
Regarding the rest of the stellar parameters, we adopted = 5110 K (tom99), which is close to the value by dra93. We adopted solar metallicity as a good approximation for Eri, as has been done in all the previous models for this star, since it is a young star which is probably not metal defficient. This was suggested by kri66, who built a grid of model atmospheres for Eri with different metallicities to fit the
3.2 The model
To build the atmospheric models for Eri, as a first step we computed a photospheric structure capable of reproducing the observed continuum spectrum for this star. Once the photospheric model was obtained, we changed the chromospheric structure to fit the