Ultrafast pump/probe spectroscopy (< 1 psec)
Magnetooptical effects
X-ray absorption spectra
Influence of laser-excited electron distributions on the x-ray
magnetic
circular dichroism spectra: Implications for femtosecond demagnetization in Ni
Abstract
In pump-probe experiments an intensive laser pulse creates non-equilibrium excited electron distributions in the first few hundred femtoseconds after the pulse. The influence of non-equilibrium electron distributions caused by a pump laser on the apparent X-ray magnetic circular dichroism (XMCD) signal of Ni is investigated theoretically here for the first time, considering electron distributions immediately after the pulse as well as thermalized ones, that are not in equilibrium with the lattice or spin systems. The XMCD signal is shown not to be simply proportional to the spin momentum in these situations. The computed spectra are compared to recent pump-probe XMCD experiments on Ni. We find that the majority of experimentally observed features considered to be a proof of ultrafast spin momentum transfer to the lattice can alternatively be attributed to non-equilibrium electron distributions. Furthermore, we find the XMCD sum rules for the atomic spin and orbital magnetic moment to remain valid, even for the laser induced non-equilibrium electron distributions.
pacs:
78.47.J-pacs:
78.20.Lspacs:
78.70.Dm1 Introduction
Ultrafast control of the magnetization of ferromagnetic materials is essential for modern technologies such as high-speed magnetic recording and spin electronics [1, 2, 3]. Magneto-optical pump-probe techniques have become exploited to investigate the relaxation process and dynamics of the magnetization in the sub-picosecond regime [4, 5, 6]. In such experiments an intensive, short laser pulse is applied to optically excite a material and subsequently the magnetic response of the system is probed by a magneto-optical technique, for example, the Kerr effect. Earlier pump-probe experiments on Ni in the visible range showed a strong reduction of the Kerr signal [4], yet, the mechanisms of the magnetization decay were not well understood. The possible dissipation channels, the role of the spin-orbit interaction (SOI), and the influence of the non-equilibrium electron population have been discussed [4, 7, 8, 9, 10].
Stamm et al. [11] have recently extended the pump-probe technique by using the x-ray magnetic circular dichroism (XMCD) to probe the magnetic response of a Ni film that was excited through an intensive pump laser pulse. The observed XMCD value at the Ni edge was found to be strongly decreased, by 65% of its original value, which was interpreted as a quenching of the Ni magnetization within 120 fs. As the XMCD technique gives access—through the XMCD sum rules—to separate values for the spin and orbital magnetism, a new window on their individual response is offered. Stamm et al. [11] concluded from a sum rule application that it is the spin component that becomes strongly reduced, whereas the orbital moment is practically unchanged, and deduce accordingly that the spin becomes reduced within 120 fs through spin angular momentum transfer to the lattice.
However, there are several open questions. The sharp drop of the Kerr signal observed in pump-probe experiments on Ni has been interpreted as evidence for demagnetization occurring through SOI within 20 fs [7], but it has also been attributed to state-blocking effects [8], or to a combination of these [12]. The state-blocking effect occurs when certain unoccupied states that are accessible to the probe laser under equilibrium conditions are no longer accessible, as they have been populated already through the pump laser, and also, some of the originally forbidden transitions become allowed. Magneto-optical pump-probe experiments on Ni films [8] indicated that state-blocking effects had disappeared from the transient Kerr response at about 250 fs after the beginning of the pump pulse. More advanced magneto-optical pump-probe polarimetry experiments performed on CoPt3 films demonstrated that state-blocking effects had vanished from the magneto-optical response 150 fs after the onset of the pump [13, 14]. The somewhat different relaxation times for CoPt3 and Ni could be possible, because CoPt3 exhibits a much stronger spin-orbit interaction than Ni and a very different band structure. Therefore, the relaxations in these materials have to be considered separately.
Here we study computationally the influence of non-equilibrium effects on x-ray absorption and XMCD spectra. We show that such effects do considerably modify both the x-ray absorption spectrum (XAS) and XMCD spectrum, each in a specific way. The predicted modification of these spectra for the case of Ni is found to be in good agreement with observed experimental features [11]. We consider two forms of non-equilibrium electron distributions, first, specific modifications of the population of states due to the pump laser, which are expected to exist to about 100 fs after the pulse, and second, thermalized electron distributions, which are expected at about 300–400 fs after the pump pulse [15, 16]. In the former case, the electron distribution is not a Fermi-Dirac (FD) function, while in the latter case, the thermalized electrons can be described by a FD distribution, but the electrons are not yet in equilibrium with the lattice.
2 Computational methodology
In our computational approach we use, first, experimental information as well as ab initio calculated transition probabilities to determine the amount of population or depopulation of Ni’s spin-polarized band states by the pump laser. These modified occupation numbers are subsequently used in relativistic calculations of the XAS and XMCD spectrum, in which the exchange-splitting of the core levels is included. The XAS and XMCD asymmetry are determined from the dielectric tensor whose elements we compute from the Kubo linear-response expression. This computational scheme, combined with accurate relativistic band structure calculations, in which the exchange-splitting of the core states is taken into account, provides theoretical XAS and XMCD spectra that agree very well with experiments [17, 18]. Our evaluations of the XAS and XMCD have been implemented on the full-potential, relativistic WIEN2k method [19], employing the local spin-density approximation (LSDA). The full Brillouin zone in the calculation comprised points, the fcc Ni lattice parameter was . Lorentzian broadening of 1.2 eV for the edge and 0.7 eV for the edge was applied to the calculated spectra to represent the core-hole lifetime and smoothen small features of spectra below the experimental resolution. We note that certain features of the electronic structure of Ni are not correctly described within the LSDA, in particular the width of the occupied band and the appearance of a photoemission satellite peak at 6 eV binding energy [20, 21]. These discrepancies can be corrected when on-site correlation effects are taken into account [22].
The number of pump-laser excited electrons per atom of the studied sample follows from the effective excitation density . Its maximum value reached due to the pulse can be estimated from the information about the laser and the absorption in the material, using the formula [8]: where is the thickness of the thin Ni film, is the fraction of incident light absorbed in the film, the unit cell volume, the pulse energy, the frequency of the pulse laser, and is the area of the spot irradiated by the pump laser. For the experimental values given by Stamm et al. we obtain the maximum excitation density , where the fact that % of each laser pulse excites the sample is taken into account, = nm, = mJ, =, = eV, and = mm2. The fine accuracy of estimate might be limited, but what is important here is that it determines roughly the range of values for to be expected in the system. Our results are provided as a function of for a wide range of starting from . We note that the present value of is rather high; the energy of the employed pump laser (2 mJ) is considerably larger than, for example, that of = nJ which was used in an earlier pump-probe study of Ni [8]. To avoid very high occupations of bands above we have restricted our calculations to values up to 0.6.
Next, we compute the occupation numbers of relevant bands in Ni, following the approach outlined earlier [23]. The simplest picture of a non-FD distribution due to a pulse with fixed energy is the following: occupied bands down to below are partially depleted and previously unoccupied bands up to above are partially populated. The occupation numbers of those bands that are accessible to the pump laser are computed from ab initio calculated optical intensities. Note that the optical excitation conserves spin, thus we examine majority and minority spin transitions separately. The spin-resolved occupation of bands above the Fermi level is computed from , where is the spin-dependent weight of transitions to band , the probability of transition with spin , and is the total number of spin electrons that fits in the band in the considered energy window111 Our ab initio calculations give that close to % of all majority-spin transitions go into valence band no. , while the minority spin transitions are divided between bands no. , , and , with respective weights 52%, 3%, and 44%. For , the number of electrons that fit in the relevant bands, we obtain 0.39, 0.022, and 0.28 for spin-down electrons in bands no. 10, 11, and 12, respectively, and 0.22 spin-up electrons in band 11.. Below there are several flat bands with similar transition strengths and a simpler approach is adopted here, neglecting the small differences between band-resolved transition strengths, but ensuring that spin-polarization of electrons removed from occupied bands is correctly accounted.
After the initial laser excitation, fast electron-electron processes cause electron equilibration on a time scale of about 350 fs [16], leading to a FD distribution with a well defined electron temperature . The electron temperature can be computed from the energy deposited by the laser. The average energy per excited Ni atom follows from = , where is the Ni density of states (DOS). Using the computed Ni DOS, we obtain a maximal electron temperature of 11 300 K, which corresponds to the laser excitation with . A temporal evolution of the electron population is expected to reduce already directly after the laser pulse. In our calculations we therefore consider electron temperatures ranging from 1 000 to 11 000 K. These temperatures are higher than the Curie temperature of Ni ( K), what is possible since the thermalized electrons are not yet in equilibrium with the spins nor with the lattice. The magnetic moment on Ni, however, computed for such a high-temperature FD function, is reduced from the equilibrium moment, because there exists a high spin-majority -DOS peak just below whose contribution becomes diminished through the FD function.
3 Calculated results
Fig. 1(top) shows the computed equilibrium XAS spectrum at the Ni -edge as well as the computed non-equilibrium XAS spectra due to state-blocking and thermalization effects. Both state-blocking and thermalization cause a shift of the calculated XAS peak to lower energies and also small broadening of the peak width. This is the very same modification of the XAS as the one that has been observed experimentally [11]. The XAS difference signal of the non-equilibrium and equilibrium spectra exhibits a 5 eV wide, oscillator-type structure centered around 852 eV which is very similar to the one observed experimentally [11], Fig. 1(bottom). The modification of the XAS spectrum can be understood from the depletion and repopulation: first, down to 1.59 eV below the band states are depleted by the pump laser pulse. These states can be accessed in the subsequent x-ray transition, which gives rise to extra XAS intensity at lower energies. Repopulation removes furthermore accessible states above , leading to a reduced intensity at higher energies. Due to lifetime broadening the effects are distributed over a several eV wide spectral range.
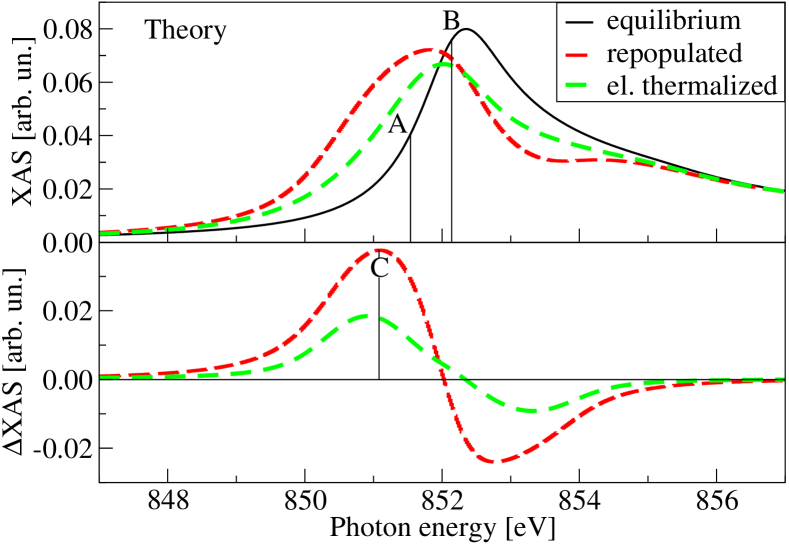
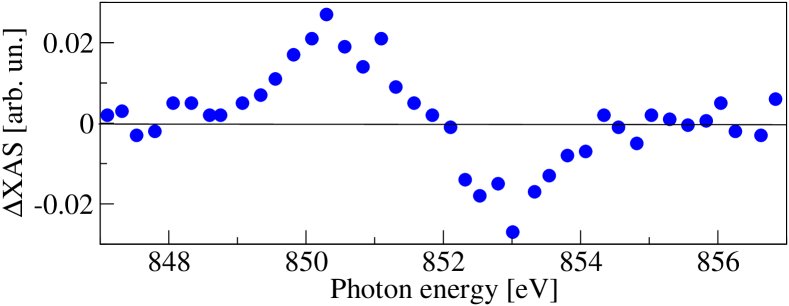
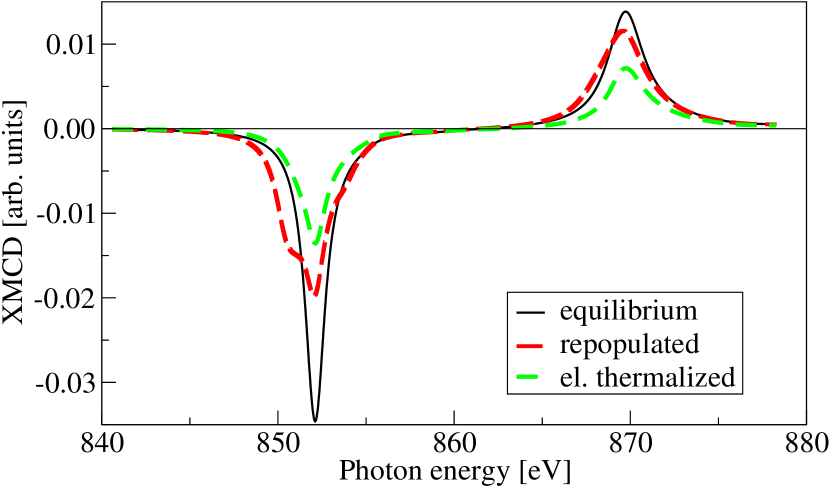
Fig. 2 shows the full XMCD spectrum computed with state-blocking or thermalization effects included. State-blocking for reduces strongly the height of the and peaks and increases the XMCD signal at the low-energy sides of both and peaks. Thermalization also reduces the XMCD peak at both edges, but does not create extra signal at the low-energy sides. Note that in both cases the change of the XMCD peak position is almost negligible when compared to the change in the XAS peak position (Fig. 1).
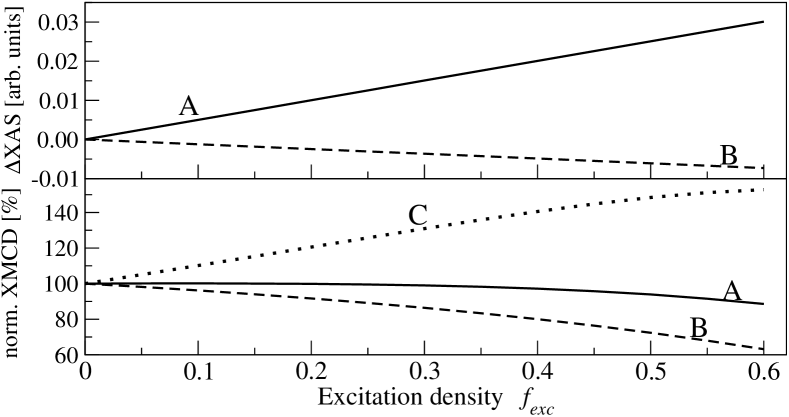
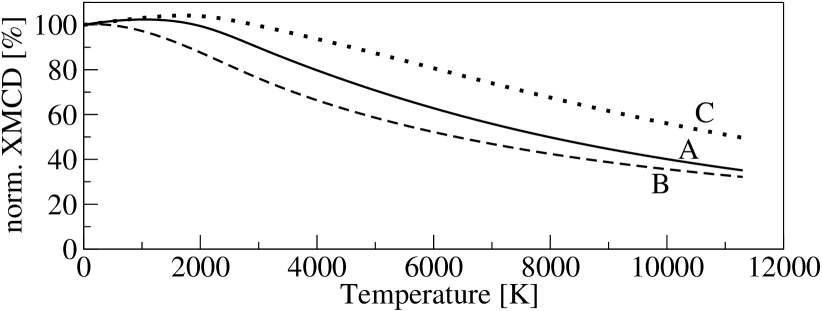
To provide a detailed analysis, we study the response at particular energies, denoted A and B in Fig. 1, which correspond to the XMCD maximum (B, at 852.15 eV) and to the XAS value equal to one half of the XAS maximum (A, at 851.52 eV in our model) in accordance with the experiment [11]. For later discussion we introduce a third energy C given by the maximum of the XAS difference curve (at 851.09 eV). The experiment [11] revealed a strong reduction of the XMCD signal at energy B. The computed changes of XAS and XMCD at energy positions A, B, and C depending on the excitation density and temperature are shown in Fig. 3. The XAS at A is growing with the excitation density , while the XMCD at B is decreasing, in agreement with the experiment. The change of these properties is roughly linear in the excitation density (examined up to the value ), as was suggested earlier [8]. In contrast to the state-blocking, electron thermalization leads to an XMCD reduction over the whole edge. This happens because electron equilibration involves both a magnetization reduction and some blocking of optical transitions due to the broad FD distribution. Noteworthy, it is possible to find such and that the calculated relative XMCD reduction at B matches the experimental value.
A complete XMCD spectrum allows to obtain the total spin and orbital momentum contributions to the magnetization via the XMCD sum rules [24, 25]. The LSDA spin and orbital moments calculated for Ni in the ground state are = and =. Applying the sum rules (with the usual neglect of the magnetic dipole term), we obtain = and =. Thus, the orbital moment is properly given, but the accuracy for the Ni spin moment is weaker; an error of up to 36% with respect to the exact value was reported previously [26]. Applying the sum rules to the electron distribution for , we obtain that changes from to and from to . This finding agrees (within the sum rules’ accuracy) with the fact that the electron’s spin is preserved in the pump laser excitation, but the orbital moment shrinks because transitions from to states are prevalent. The XMCD sum rules are therefore valid for the studied excited system with the same accuracy as for the ground state, but one must take care when the perturbation of the XMCD spectrum is not homogeneously distributed over the edges. Although the XMCD signal at the peak is reduced times in our simulation, the area of the whole edge is reduced only 5%, because of the compensating XMCD signal rise near energy C. Consequently, taking the XMCD peak at B as a measure for the reduction of the spin moment would unjustly suggest a significant demagnetization, which would not be observed when the whole spectral area is considered.
Also in the case of electron thermalization, we find–from an analogous comparison–that the sum rules remain valid. Replacing the spectral integral of the sum rules with the XMCD value at B is in this case a better approximation, as the XMCD signal over the whole edge is reduced. However the reduction is not homogeneous. If we consider, for example, a of 5000 K, a reduction of the XMCD at B of 42% is computed, but the reduction at C is only 12% (Fig. 3). This difference is due to a partial blocking of states that results from the high- FD function. A direct calculation of the moment in the thermalized state gives =0.39 (=0.024 ) which implies a reduction of the spin moment by 37%. An application of the integral sum rules gives a reduction by 33%, in reasonable agreement.
4 Discussion of the temporal evolution
In the case of state-blocking a linear increase of the XAS at A with is predicted, which is due to the shift of the peak to lower energy. A smaller increase of the XAS at A follows from electron thermalization with a FD function having a high (see Fig. 1). Conversely, the XMCD signal at its maximum (point B) is reduced for both cases of state-blocking and high electron temperature, but for the XMCD peak value the latter effect is slightly stronger, i.e. the XMCD peak maximum is reduced less by the state-blocking effect than by the corresponding high- state (Fig. 2). This observation allows us to predict that the crossover from the non-equilibrium, state-blocking state to the electron-thermalized state should be accompanied by a reverse of the initially increasing trend of the XAS (at A) and, contrary to it, an almost unchanged or slowly decreasing trend of the XMCD maximum at B. At larger times a slow increase of the XMCD at B is, however, expected, due to the electron-lattice equilibration, which acts as a competing factor.
The experiment [11] shows a linear rise of the XAS signal at A with time up to about 220 fs after the onset of the 70 fs pump pulse, after which the XAS starts to decrease. A different temporal behavior is observed for the XMCD at B: the XMCD signal reduces linearly with time up to 220 fs after the onset of the pulse, after which it remains roughly constant. This indeed confirms the behavior we predicted above for the crossover to electron thermalization. The here presented theory asserts therefore that for Ni in the studied experiment [11], state-blocking is prevalent up to about 150 fs after the 70 fs pulse, when the crossover to electron thermalization has occurred, which enforces a reduction of the XAS at A. We note that the here deduced relaxation time of 220 fs for the crossover to electron thermalization in Ni is consistent with earlier pump-probe magneto-optical measurements [8], whereas a moderately smaller relaxation time of 150 fs after the onset of the pulse was measured on CoPt3 films [13].
5 Conclusions
In Ref. [11] important conclusions regarding the spin and orbital moment evolution were drawn through application of the XMCD sum rules. It is essential to note, however, that the change of the spectral integral over the whole edge was estimated from the XMCD value at only one energy (at point B). From the presented calculations we conclude that the change of the spectral integral over the whole edge cannot be estimated from the XMCD value at only one energy (B) if state-blocking is present. It is therefore not possible to decide about the role of transfer of spin angular momentum to the lattice from the present experimental data [11], missing a complete femtosecond-resolved XMCD spectrum.
As we have found that the XMCD sum rules (in their integral form) are valid even in the laser excited state, a complete XMCD spectrum of laser-pumped Ni should thus provide reliable information on the evolution of spin and orbital moments. We demonstrate that state-blocking and high electron temperature effects lead to the following changes in the spectra: the shift of the XAS to lower energy, the shape of the XAS difference spectrum, the rise of the XAS at A, and the strong reduction of the XMCD peak at B in the first 220 fs after the onset of the pulse. This implies that the presence of non-equilibrium electron distributions can largely explain the experimental observations [11] without the suggested transfer of spin angular momentum to the lattice. Our calculations also predict the approximate time evolution of these changes related to the crossover to thermalization, which we estimate to occur at about 150 fs after ending of the pump pulse. We propose that other experimental data, especially those obtained for femtosecond-resolved XMCD at energies near position C, together with the presented theory, would allow to separate unambiguously the various contributions to the apparent XMCD and pave the way for a precise understanding of the nature of the femtosecond demagnetization as well as reveal the timescales crucial for the demagnetization process.
Acknowledgements.
We thank H. Dürr, C. Stamm and J. Rusz for valuable discussions. Support through the Swedish Research Council (VR), STINT, INTAS, the G. Gustafsson Foundation, the European Community’s Seventh Framework Programme (FP7/2007-2013) under grant agreement No. 214810, “FANTOMAS”, and the Swedish National Infrastructure for Computing (SNIC) is acknowledged.References
- [1] \NameKimel A. V., Kirilyuk A., Usachev P. A., Pisarev R. V., Balbashov A. M. Rasing T. \REVIEWNature4352005655.
- [2] \NameStanciu C. D., Hansteen F., Kimel A. V., Kirilyuk A., Tsukamoto A., Itoh A. Rasing T. \REVIEWPhys. Rev. Lett.992007047601.
- [3] \NameBerezovsky J., Mikkelsen M. H., Stoltz N. G., Coldren L. A. Awschalom D. D. \REVIEWScience3202008349.
- [4] \NameBeaurepaire E., Merle J.-C., Daunois A. Bigot J.-Y. \REVIEWPhys. Rev. Lett.7619964250.
- [5] \NameJu G., Vertikov A., Nurmikko A. V., Canady C., Xiao G., Farrow R. F. C. Cebollada A. \REVIEWPhys. Rev. B571998R700.
- [6] \NameKoopmans B., van Kampen M. de Jonge W. J. M. \REVIEWJ. Phys.: Condens. Matter152003S723.
- [7] \NameZhang G. P. Hübner W. \REVIEWPhys. Rev. Lett.8520003025.
- [8] \NameKoopmans B., van Kampen M., Kohlhepp J. T. de Jonge W. J. M. \REVIEWPhys. Rev. Lett.852000844.
- [9] \NameRegensburger H., Vollmer R. Kirschner J. \REVIEWPhys. Rev. B61200014716.
- [10] \NameKampfrath T., Ulbrich R. G., Leuenberger F., Münzenberg M., Sass B. Felsch W. \REVIEWPhys. Rev. B652002104429.
- [11] \NameStamm C., Kachel T., Pontius N., Mitzner R., Quast T., Holldack K., Khan S., Lupulescu C., Aziz E. F., Wietstruk M., Dürr H. A. Eberhardt W. \REVIEWNature Mater.62007740.
- [12] \NameGómez-Abal R. Hübner W. \REVIEWJ. Phys.: Condens. Matter152003S709.
- [13] \NameGuidoni L., Beaurepaire E. Bigot J.-Y. \REVIEWPhys. Rev. Lett.892002017401.
- [14] \NameBigot J.-Y., Guidoni L., Beaurepaire E. Saeta P. N. \REVIEWPhys. Rev. Lett.932004077401.
- [15] \NameHohlfeld J., Wellershoff S. S., Güdde J., Conrad U., Jähnke V. Matthias E. \REVIEWChemical Physics2512000237.
- [16] \NameDel Fatti N., Voisin C., Achermann M., Tzortzakis S., Christofilos D. Vallée F. \REVIEWPhys. Rev. B61200016956.
- [17] \NameKuneš J., Oppeneer P. M., Mertins H.-C., Schäfers F., Gaupp A., Gudat W. Novák P. \REVIEWPhys. Rev. B642001174417.
- [18] \NameKuneš J. Oppeneer P. M. \REVIEWPhys. Rev. B672003024431.
- [19] \NameBlaha P., Schwarz K., Madsen G. K. H., Kvasnicka D. Luitz J. \BookWIEN2k, An Augmented Plane Wave + Local Orbitals Program for Calculating Crystal Properties (Technische Universität Wien) 2001.
- [20] \NameEastman D. E., Himpsel F. J. Knapp J. A. \REVIEWPhys. Rev. Lett.44198095.
- [21] \NameGuillot C., Ballu Y., Paigné J., Lecante J., Jain K. P., Thiry P., Pinchaux R., Pétroff Y. Falicov L. M. \REVIEWPhys. Rev. Lett.3919771632.
- [22] \NameManghi F., Bellini V., Arcangeli C. \REVIEWPhys. Rev. B5619977149
- [23] \NameOppeneer P. M. Liebsch A. \REVIEWJ. Phys.: Condens. Matter1620045519.
- [24] \NameThole B. T., Carra P., Sette F. van der Laan G. \REVIEWPhys. Rev. Lett.6819921943.
- [25] \NameCarra P., Thole B. T., Altarelli M. Wang X. \REVIEWPhys. Rev. Lett.701993694.
- [26] \NameWu R. Freeman A. J. \REVIEWPhys. Rev. Lett.7319941994.