Optical conductivity from local anharmonic phonons
Abstract
Recently there has been paid much attention to phenomena caused by local anharmonic vibrations of the guest ions encapsulated in polyhedral cages of materials such as pyrochlore oxides, filled skutterdites and clathrates. We theoretically investigate the optical conductivity solely due to these so-called rattling phonons in a one-dimensional anharmonic potential model. The dipole interaction of the guest ions with electric fields induces excitations expressed as transitions among vibrational states with non-equally spaced energies, resulting in a natural line broadening and a shift of the peak frequency as anharmonic effects. In the case of a single well potential, a softening of the peak frequency and an asymmetric narrowing of the line width with decreasing temperature are understood as a shift of the spectral weight to lower level transitions. On the other hand, the case of a double minima potential leads to a multi-splitting of a spectral peak in the conductivity spectrum with decreasing temperature.
pacs:
63.20.Ry, 63.20.Pw, 78.20.BhI Introduction
Anharmonicity in lattice vibrations has been one of the old problems in condensed-matter physicsBorn1968 ; Madelung1978 . Anharmonic effects in acoustic phonons were treated by perturbation theoryChoquard1967 ; Madelung1978 , while those in local vibrations were investigated in impurities or disordered systems Stevenson1966 ; Newman1969 ; Barker1975 . It was pointed out that the effects of the anharmonicity in local vibrations appear in the characteristic temperature dependence of the vibrational frequency and of the line widthElliot1965 . Since an isolated irregular atom receives an anharmonic potential from the regular lattice, analysis have been made mostly on the anharmonic oscillation receiving effects of surrounding oscillation of the regular lattice.
Recently a revised interest on anharmonic phonons has arisen in relation to a material series of pyrochlore oxides Subramanian1983 ; Hanawa2001 , filled skutterditesJeitschko1977 ; Braun1980 ; Sales1997 and clathratesNolas1998 ; Sales2001 ; Bentien2004 ; Avila2006 ; Avila2008 . Those materials, which are usually electrical conductors like metals, semimetals or heavily-doped semiconductors, have a common feature that some numbers of atoms form a three-dimensional network of polyhedral cages, in each of which a guest ions is accommodated. When the cages are oversized, the guest ion vibrates with a large amplitude in an anharmonic potential. Such vibrations are named as the rattling phonons. To note, depending on kinds of guest ions, on-centering or off-centering vibrations occur even in the same cage structure.
There have been reported various anomalous phenomena in the above materials, some of which have been discussed in relation to those rattling phononsreviews . In applying some clathrate compounds to thermoelectric material devices, for example, the rattling phonons, in particular off-centered, are expected to suppress strongly the thermal conductivity by effectively scattering Debye-like acoustic phonons propagating through the cage network and carrying heat entropy Bentien2004 ; Avila2006 ; Avila2008 ; Nakayama2008 . An alternative example is found in the superconductivity in a -pyrochlore oxide KOs2O6. It was suggested that rattling vibrations of the K+ in the OsO6 octahedral cage were responsible for the strong-coupling superconductivity and also for an electron-mass enhancementBruhwiler2006 ; Hiroi2007 . It may be fair, however, to state that these interesting issues as for the question how rattling phonons interact with cage acoustic phonons and/or charge carriers are far from being well understoodreviews .
So far lattice vibrational modes including rattling phonons in the above cage materials have been studied rather extensively with use of spectroscopic measurements such as inelastic neutron and Raman scatteringsreviews . Some low-lying rattling modes are clarified to exhibit softening with decreasing temperatures. The softening phenomenon has been well recognized as one of the anharmonic effects from rattling phonons, which was discussed with a quasi-harmonic approximationDahm2007 . Beside these spectroscopies, an infrared-active optical measurements, particularly in the Terahertz range, would be, in principle, a powerful tool to clarify the charge dynamics in low-lying optical phonons near with available optical conductivity spectra.
Recently, time-domain terahertz spectroscopyMori2008a has been successfully applied for the first time to observe the rattling phonons around 1THz in a type-I clathrate Ba8Ga16Ge30 (BGG) Mori2008b . In this paper, we investigate systematically the optical conductivity spectra from the rattling phonons in an on-centered and off-centered potential, and apply the obtained theoretical classification of the spectra to analyse the experimental result of BGG. The detail of the experiment will be presented elsewhereMori2008b . We express the optical conductivity by level transitions among states in an anharmonic potentialFoster1993 . The present analysis shows that the most important effect of an anharmonic potential is the non-equal energy spacing of level transitions, resulting in an intrinsic and asymmetric spread of the excitation spectral, in contrast to the harmonic case of the equal energy spacing simply resulting in the Lorentzian spectral shape. Also there arise variety of level schemes for low-lying states depending on an on-centered or off-centered potential. Those features induce the natural broadening of the line width at higher temperature, softening of the peak frequencynote1 and multi-peak structures at low temperature in optical conductivity.
In the present paper, a one-dimensional model is used for simplicity. Essential effects from the anharmonicity are included. In the next section, the model and the expression of the optical conductivity are presented. In Sect.3 some of numerical results are presented. Comparison with the recent experimentMori2008b is discussed. Sect.4 is devoted to the conclusion.
II Formulation
As a model to describe the motion of a guest ion in the cage, we take the following one-dimensional anharmonic potential model, for simplicity,
| (2.1) |
where , and are the mass, momentum and spatial coordinate of the guest ion, respectively. We neglect effects of acoustic phonons and electrons.
The optical conductivity from the guest ion is obtained by considering the polarization induced by an applied oscillatory electric field ,
| (2.2) |
where is the charge of the guest ion. By use of the linear response theory, the polarization is obtained as
| (2.3) |
where indicates the thermal average and means the retarded function. By taking the Fourier transform, the polarizability defined by
| (2.4) |
is obtained as
| (2.5) |
where the density of the quest ion is taken into account and is defined by
| (2.6) |
Let us denote eigenstates and eigenvalues of the Hamiltonian by and , respectively,
| (2.7) |
Then is expressed as
| (2.8) |
with and . Here we have introduced a phenomenological parameter of the decay width . Since the optical conductivity and the polarizability are related to each other as
| (2.9) |
we have the complex optical conductivity as
| (2.10) | |||||
with
| (2.11) |
Hereafter, we use the notation , and , respectively, as the energy, angular frequency and frequency for the transition from the -state to the -state. The normalization for the conductivity is given by
| (2.12) |
with a length scale determined shortly. In the following analysis, we choose a suitable energy scale , which can be, for example, the energy corresponding to 1THz or a harmonic frequency evaluated from the quadratic term in the potential, or an observed phonon energy. The scaled parameters are defined as
| (2.13) |
and the length scale is given as
| (2.14) |
In the next section, we will calculate for cases of , and , and discuss characteristic features of the optical conductivity from the rattling phonon.
III Numerical Analysis
III.1 The case of
We can choose without loss of generality, In this case, is given by , the harmonic frequency. Let us estimate the magnitude of . In the band structure calculation for Ba8Ga16Ge30Madsen2005 , the coefficients and were evaluated as mRy and mRy, where is the Bohr radius. Then using the mass of the Ba-atom 137.35 a.u., we have the harmonic frequency THz and . The actually observed phonon frequency lowest lying in Ba8Ga16Ge30 is about 1THz and the parameters may vary about twice or so. Taking into account the above estimation and Eq. (2.13), we take the value of in the range of .
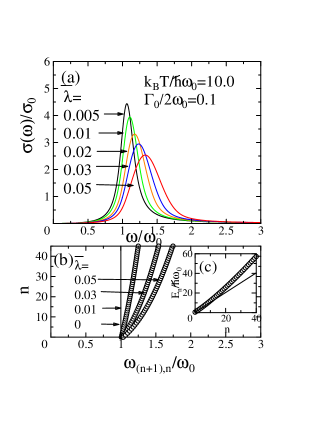
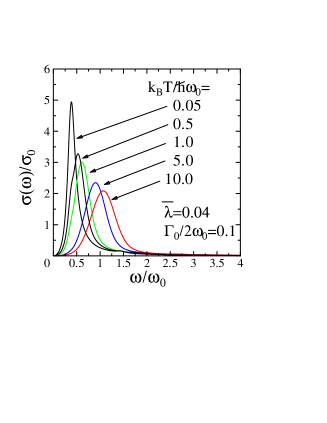
In Fig. 1 (a) we plot the optical conductivity for various at . Hereafter, we introduce a constant decay width by hand, in order to smooth the frequency dependence of the optical conductivity. How each level transition has a decay width depends on interactions with electrons or acoustic phonons. Details of such effects are not considered in this paper. Also in the following, denotes the real part of the complex conductivity. At , the phonon mode has the single angular frequency , and the line width is the decay width . As increases, both of the peak position and the line width increase. That is, the line width at higher temperature is determined by the anharmonic parameter . In Fig. 1 (b), we plot the excitation energy . This is obtained by calculating the energy eigenvalues numerically. One example of the behavior of energy eigenvalues is shown in Fig. 1(c) for . The label ”n” is identical with the boson number in the harmonic case of . The energy eigenvalues deviate from the linear behavior as but a perturbation calculation is not applicable, since becomes an order of one for . The calculation shows that the transition probability arises mostly from . As is seen in Fig. 1(b), the excitation energies increase as eigenvalues(i.e. ) increase due to the anharmonicity; the larger the , the more spreading excitation energies become. The non-equal energy spacing of the phononic level transitions leads to the intrinsic spread of the line width in the optical conductivity, as is seen in Fig. 1(a). It should be noted that excitations with larger () contribute at .
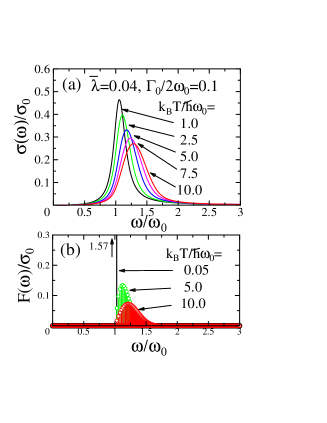
In Fig. 2(a), we plot the temperature dependence of the optical conductivity. The optical conductivity shows the softening of the peak position and the narrowing of the line width with decreasing temperature. At low temperature, only the first level transition contributes. As temperature increases, the transition involves higher energy levels, resulting in a shift of the effective peak position. Also the line width increases, since more level transitions contribute. In order to see the line-distribution without the smoothening by the width , we plot, in Fig. 2(b), the spectral weight in the optical conductivity given by
| (3.1) |
for and . Sharp lines arising from the non-equal spacing of the level transitions distribute rather densely in the present parameter values. Because of the Boltzmann factor and a factor from , the maximum position of the weight increases with temperature and decreases exponentially as the energy increases. At K, the main contribution arises from the transition between the ground state and the first excited state. The softening of the peak frequency and the sharpening of the line width with decreasing temperature are direct consequences derived solely from an inequivalence of the level spacing that is essential in the anharmonicity. Therefore measurements on the temperature dependence of the optical conductivity can provide a direct evidence for the anharmonicity.

In Fig. 3 the transition energy for the transition is shown, which gives the peak frequency at K. In the present parameter region, the curve is fitted by
| (3.2) |
which deviates above from the result of the perturbation, (dashed line).
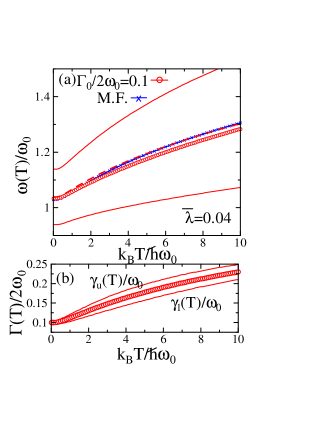
In Fig. 4 (a) we plot the temperature dependence of the peak frequency for (red circles) and, by red solid lines, upper and lower energies which give half values of the peak intensities. The red dashed line is for their averaged energy (say, mid-frequency). The blue diagonal-crosses indicate the result obtained from the following equation in the mean field theoryDahm2007 (The factor 3 is corrected.),
| (3.3) |
We see that the averaged value (red dashed line) well agree with the mean field results (blue diagonal-crosses). However, our result of the peak structure is asymmetric, reflecting the spectral weight, Eq. (3.1). We express the line width at temperature as
| (3.4) |
with () being the upper (lower) half width from the peak frequency, which is shown in Fig. 4 (b). The saturation of the line width is due to the decay width , which may originate from a phonon-electron interaction and a rattling phonon-acoustic phonon interaction neglected in this paper. However, at higher temperature, increases fairly larger than . Also the broadening in upper and lower frequency is asymmetric. The line broadening due to the anharmonicity leads to a non-Lorentzian spectral shape.
From the analysis of this subsection, we see that anharmonicity of the rattling phonon leads to softening of the phonon frequency and sharpening and asymmetric change of the line width with decreasing temperature.
III.2
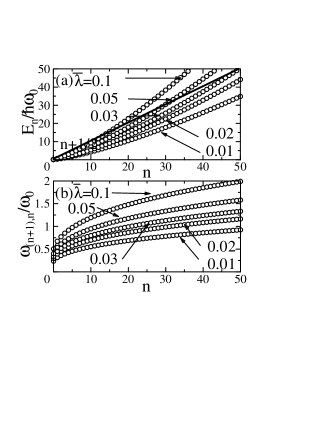
When (or ), the peak position and the line width are solely determined by . We choose as a characteristic energy of the system, for example, =1THz. In Figs. 5 (a) and (b), the energy eigenvalues and the excitation energy are plotted. The lower excitation energies are softened and, just as well as in the case of , the effectively contributing decreases with decreasing temperatures, resulting in the characteristic behavior, softening and sharpening, of the optical conductivity as is shown in Figs. 6 and 7. Note that the lowest excitation energy is softened up to about a half of the characteristic energy because of the shallow shape of the potential bottom.
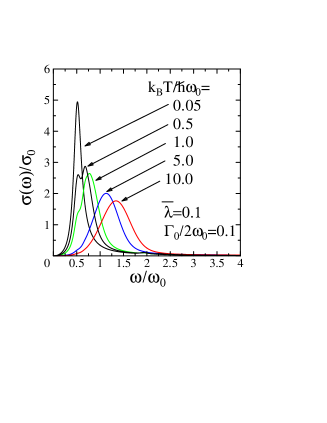
In the case of (Fig. 6), the difference of the neighboring excitation energies is less than , so that the optical conductivity shows a smooth softening, though the shift is enlarged and some shoulder is seen at low temperature (). Such a shoulder structure is smoothed for a smaller . When becomes large, the difference of the lower excitation energies exceeds , and as in Fig. 7 the optical conductivity shows a double peak structure as temperature decreased. The upper peak is reduced as temperature is further lowered. The broadening of the line width at higher temperature is enhanced as increases.
III.3 The case of
For negative , the anharmonic potential has double minima. We investigate the temperature dependence of the optical conductivity for by changing . Depending on the depth of the double minima, various patterns of temperature-dependent optical conductivity are obtained. We choose as a characteristic energy of the system, for example, =1THz.
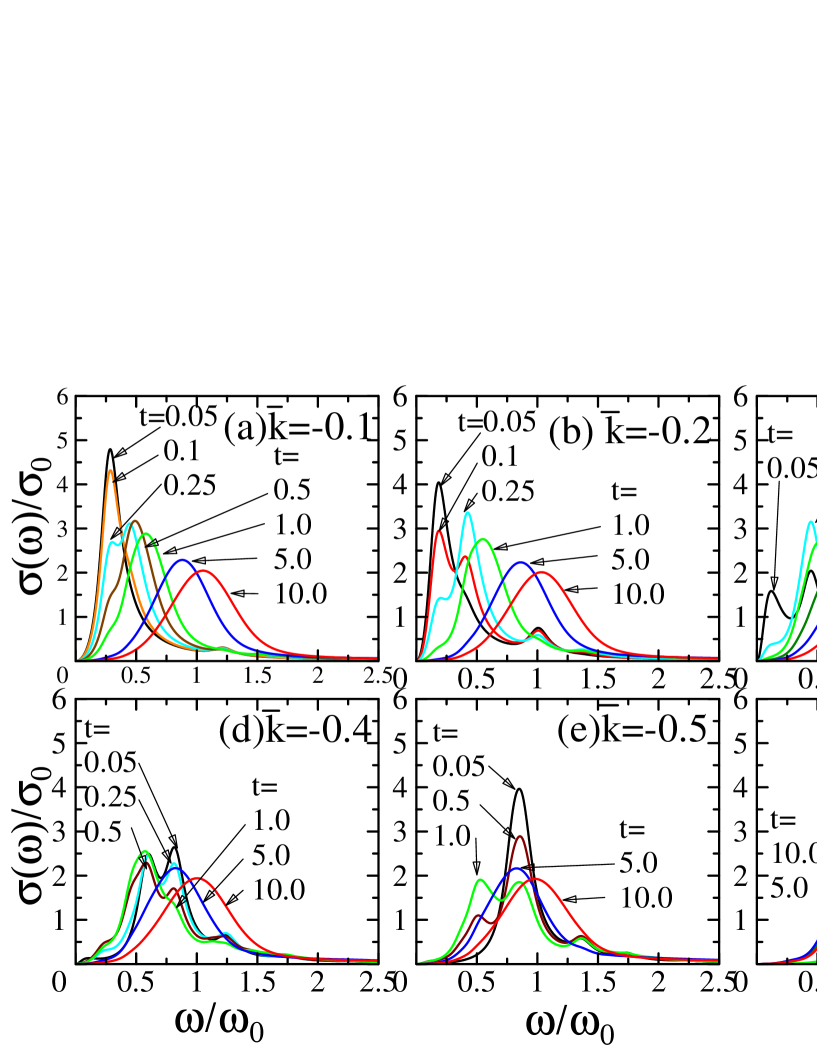
In Fig. 8, we show the temperature dependence of the optical conductivity for various . The softening of the peak position is seen in Figs. 8(a)-(c), but in Figs. 8(d)-(f) the softening of the peak frequency is followed by the hardening, with decreasing temperature.
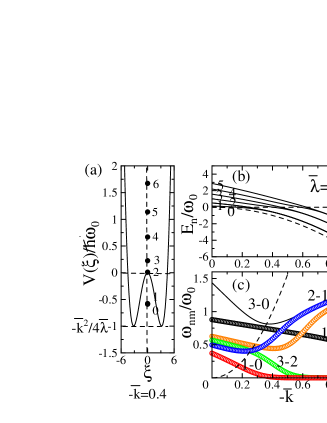
Low temperature behaviors have various variety, especially there appear structures with double or triple peaks, though it depends on the magnitude of the width . This can be understood from the low energy level transition in the double well potential. In Fig. 9(a), one example of the potential with is illustrated together with the eigenenergy levels. Low energy levels are much modified by the depth of the potential well. In Fig. 9(b) the -dependence of for low energy levels are plotted. Dotted lines are the potential double minima with the value and the local maximum , respectively. When increases, the levels , , , successively degenerate forming low-lying tunneling modes. In Fig. 9(c) the transition energies are plotted among low-lying eigenstates. The dotted line is for the depth of the potential well. Transition energies and show successively softening as increases, while the neighboring excitations , increase and become larger than excitation energies among higher levels ( in Fig. 9(c)). The upturn of the excitation energies of is correlated with the depth of the potential well. In the following we discuss more details of low temperature behaviors in Fig. 8.
Figs. 8(a) and (b) are for shallow double wells. Transition energy of is softened and it becomes smaller than due to the effect of the double well. Further, is larger than , so that there appears two peaks at low temperature and the higher peak of diminishes as K. The peak around which remains even at K corresponds to the transition .
Fig. 8(c) is for . The states 0 and 1 become very close but still have finite difference. We can identify lower peak as , and . The peak for is reduced with decreasing temperature (See also Fig. 9(c)).
Fig. 8(d) is for . The states 0 and 1 are almost degenerate, and this soft mode does not appear in the optical conductivity because of the factor in Eq. (2.10). The state 2 is inside the double well and the state 3 is above the maximum at . Then is larger than . We can identify the peaks in Fig. 8(d) as , and from the low energy side. Note that the intensity of the peak increases and decreases as temperature decreases.
In Fig. 8(e), is further reduced as . The state 2 and 3 start to degenerate and becomes lower than . We can identify the peaks in Fig. 8(e) from the low energy side as and (,).
In Fig. 8(f), the state 2 and 3 are completely degenerate and is the main transition at low temperature. Since this energy is much larger than energies for higher level transition, the peak position first decrease at higher temperature and then increase at low temperature.
When is further reduced and the double minima become deep enough, the hardening of the peak frequency is obtained rather than softening as was discussed in ref. Foster1993 .
In this way, we have various patterns depending on the strength of the double well
III.4 Comparison with the experiment
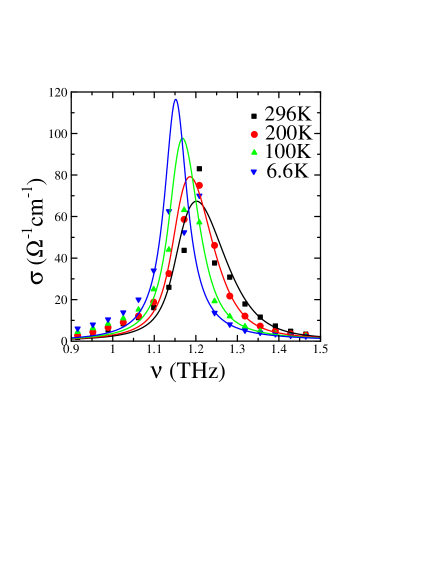
We have performed the time-domain THz spectroscopy and obtained the optical conductivityMori2008b in a type-I clathrate Ba8Ga16Ge30Sales2001 ; Bentien2004 ; Avila2006 ; Madsen2005 . The details of the experimental method and analysis will be presented in a separated paperMori2008b . The obtained temperature-dependence of the phonon spectral for the lowest mode(THz) is shown by colored symbols in Fig. 10. No multi-peak structure is observed. Then from the patterns presented in this paper, we conclude and we take .
We adjust , , and to fit overall behaviors and specially the higher frequency region (1.251.40 THz) of the spectral line. We choose THz, , THz, and . Theoretical results are presented by solid lines in Fig. 10. The agreement between the experimental and theoretical results in temperature-dependence is very good.
(a) Peak frequency
(b) Line width
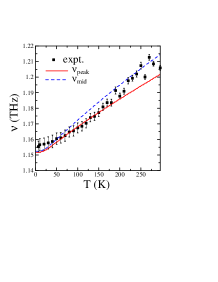
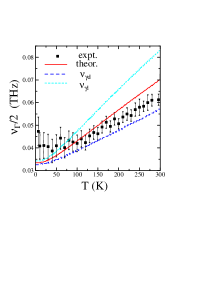
The temperature dependence of the peak frequency and the line width are estimated from the experimental data by the Lorentzian fit and are plotted by the solid rectangulars in Fig. 11(a) and (b), respectively. Theoretical results are plotted by solid and dashed lines. In Fig. 11(a), the red solid line is for the peak frequency and the green dashed line is for the mid-frequency . In Fig. 11(b), the red solid, blue dashed and light blue short-dashed lines are frequencies , and corresponding to the half width, the lower and upper half width, respectively. The experimental peak frequency situates between the theoretical peak and mid-frequency. Also the half-width is between the theoretical half-width and lower half-width. Since the Lorentzian fit is apt to lead a higher peak frequency and a narrower line width in an asymmetric line shape, the agreement between the experimental and theoretical results is reasonably good. The present comparison shows that the temperature-dependence of the rattling phonon in Ba8Ga16Ge30 is well described by the anharmonicity of the potential without considering details of effects from other interactions.
IV Conclusion
In this paper we have investigated theoretically the temperature dependence of the optical conductivity from the rattling phonon. The guest ion feels an anharmonic potential from the cage, and the anharmonic effect appears characteristically in the temperature dependence, that is, the softening of the peak frequency and sharpening of the line width with decreasing temperature.
In the case of the positive quadratic term, one can expect the quadratic coefficient is roughly determined from the saturated peak frequency at low temperature and the quartic term is determined from the line width and shift of the peak frequency.
In the case of the negative quadratic term, various patterns of the optical conductivity are expected depending on the strength of the double minima in the potential. Multi-peak structures appear at low temperature and increase and decrease of the peak frequency with temperature are obtained.
We have shown that measurements on the temperature dependence of the optical conductivity can provide a direct evidence for the anharmonicity.
Acknowledgements
We thank Drs. M. A. Avila, J. P. Carbotte, M. Dressel, H. Hasegawa, M. Lang, H. Matsui, T. Nakayama, N. Ogita, K. Suekuni, T. Takabatake, Y. Takasu, K. Tanigaki, M. Udagawa, K. Ueda, W. Weber, A. Yamakage, A. Yoshihara, M. Yoshizawa and T. Koyama for valuable discussions. Two of us (T. M., K. I.) are supportedfinancially by the Global COE program “Materials Integrations”, Tohoku University. This work has been supported by Grants-in-Aid for Scientific Research (A)(15201019) and the priority area “Nanospace” from MEXT, Japan.
References
- (1) M. Born and K. Huang, Dynamical theory of crystal lattices, (Oxford at the Clarendon Press,London,1968).
- (2) O. Madelung, Introduction to solid-state theory, (Springer-Verlag, Berlin Heidelberg New York, 1978).
- (3) P. Choquard, The anharmonic cryatal, (W. A. Benjamin, Inc., New York, Amsterdam,1967).
- (4) R. W. H. Stevenson, Phonons in perfect lattices and in lattices with point inperfections, (Oliver & Boyd, Edinburgh and London, 1966)
- (5) B. C. Newman, Adv. Phys. 18, 545 (1969).
- (6) A. S. Barker Jr. and A. J. Sievers, Rev. Mod. Phys. 47, Suppl., s1 (1975).
- (7) R. J. Elliot, W. Hayes, G. D. Jones, H. F. Macdonald and C. T. Sennett, Proc. R. Soc. London 289A, 1 (1965).
- (8) M. A. Subramanian, G. Aravamudan and G. V. S. Rao, Prog. Solid State Chem. 15, 55 (1983).
- (9) M. Hanawa, Y. Muraoka, T. Tayama, T. Sakakibara, J. Yamaura and Z. Hiroi, Phys. Rev. Lett. 87, 187001 (2001).
- (10) W. Jeitschko and D. J. Braun, Acta Crystallogr., Sect. B: Struct. Crystallogr. Cryst. Chem. 33, 3401 (1977).
- (11) D. J. Braun and W. Jeitschko, J. Less-Common Met., 72, 147 (1980).
- (12) B. C. Sales, D. Mandrus, B. C. Chakoumakos, V. Keppens and J. R. Thompson, Phys. Rev. B 56, 15081 (1997).
- (13) G. S. Nolas, J. L. Cohn, G. A. Slack and S. B. Schujman, Appl. Phys. Lett. 73, 178 (1998).
- (14) B. C. Sales, B. C. Chakoumakos, R. Jin, J. R. Thompson and D. Mandrus, Phys. Rev. B 63, 245113 (2001).
- (15) A. Bentien, M. Christensen, J. D. Bryan, A. Sanchez, S. Paschen, F. Steglich, G. D. Stucky and B. B. Iversen, Phys. Rev. B 69, 045107 (2004).
- (16) M. A. Avila, K. Suekuni, K. Umeo, H. Fukuoka, S. Yamanaka and T. Takabatake, Phys. Rev. B 74, 125109 (2006).
- (17) M. Avila, K. Suekini, K. Umeno, H. Fukuoka, S. Yamanaka and Y. Takabatake, Appl. Phys. Lett. 92, 041901 (2008).
- (18) S. Yonezawa, Y. Muraoka, Y. Matsushita and Z. Hiroi, J. Phys. Copndens. Matter 16, L3 (2004).
- (19) For recent reviews, see the special issue, J. Phys. Soc. Japan, 77 Supplement A (2008)
- (20) T. Nakayama and E. Kanashita, Europhysics Letters 84, 66001 (2008).
- (21) Z. Hiroi, S. Yonezawa, J. Yamaura, T. Muramatsu and Y. Muraoka, J. Phys. Soc. Jpn. 74, 1682 (2005).
- (22) M. Bruhwiler, S.M. Kazakov, J. Karpinski and B. Batlogg, Phys. Rev. B 73, 094518 (2006).
- (23) Z. Hiroi, S. Yonezawa, Y. Nagao and J. Yamaura, Phys. Rev. B 76, 014523 (2007).
- (24) J. Yamaura, S. Yonezawa, Y. Muraoka and Z. Hiroi, J. Solid State Chem. 179, 336 (2006).
- (25) T. Goto, Y. Nemoto, K. Sakai, T. Yamaguchi, M. Akatsu, T. Yanagisawa, H. Hazama, K. Onuki, H. Sugawara and H. Sato, Phys. Rev. B 69, 180511(R) (2004).
- (26) M. Yoshida, K. Arai, R. Kaido, M. Takigawa, S. Yonezawa, Y. Muraoka, and Z. Hiroi, Phys. Rev. Lett. 98, 197002 (2007).
- (27) Thomas Dahm and Kazuo Ueda, Phys. Rev. Lett. 99, 187003 (2007).
- (28) T. Mori, E. J. Nicol, S. Shiizuka, K. Kuniyasu, T. Nojima, N. Toyota and J. P. Carbotte, Phys. Rev. B 77, 174515 (2008).
- (29) T. Mori, S. Goshima, K. Iwamoto, S. Kushibiki, H. Matsumoto, N. Toyota, K. Suekuni, A. M. Avila, T. Takabatake, T. Hasegawa and M. Udagawa, preprint, arXiv:0905.3610v1 (2008), to be published in Phys. Rev.B.
- (30) Such an approacn is also found in the analysis of the Ramman scattering, C. M. Foster, M. Grimsditch, Z. Li and V. G. Karpov, Phys. Rev. Lett. 71, 1258 (1993)
- (31) In ref. Elliot1965 , the hardening of the local mode with decreasing temperature was indicated because of the effect from the band phonon, and in ref. Foster1993 , a deep double minumum potential was considered, leading also the hardening of the local mode with decreasing temperature.”
- (32) G. K. H. Madsen and G. Santi, Phys. Rev. B 72, 220301(R) (2005).
- (33) (private communication) A preliminary experiment of the optical conductivity for Ba8Ga16Sn30 were performed, and the rattling phonon around 0.6THz has been observed. The result shows a different behavior from that of Ba8Ga16Ge30; though the softening is also observed, the line width becomes wider in low temperature, showing some indication of a double-peak structure (T. Mori, S. Goshima, K. Iwamoto, H. Matsumoto, N. Yoyota, K. Suekuni, M. A. Avella and T. Takabatake, Reports (22pWF-3 and 22pWF-4) in the Autum Meeting, the Physical Society of Japan, Sept. 20-23,2008). An improvement of the signal-noise ratio in the low frequecy region is in progress.