Low-Metallicity Protostars and the Maximum Stellar Mass
Resulting from Radiative Feedback
Abstract
The final mass of a newborn star is set at the epoch when the mass accretion onto the star is terminated. We study the evolution of accreting protostars and the limits of accretion in low metallicity environments. Accretion rates onto protostars are estimated via the temperature evolution of prestellar cores with different metallicities. The derived rates increase with decreasing metallicity, from at to at . With the derived accretion rates, the protostellar evolution is numerically calculated. We find that, at lower metallicity, the protostar has a larger radius and reaches the zero-age main-sequence (ZAMS) at higher stellar mass. Using this protostellar evolution, we evaluate the upper stellar mass limit where the mass accretion is hindered by radiative feedback. We consider the effects of radiation pressure exerted on the accreting envelope, and expansion of the H II region. The mass accretion is finally terminated by radiation pressure on dust grains in the envelope for and by the expanding H II region for lower metallicty. The mass limit from these effects increases with decreasing metallicity from at to at . The termination of accretion occurs after the central star arrives at the ZAMS at all metallicities, which allows us to neglect protostellar evolution effects in discussing the upper mass limit by stellar feedback. The fragmentation induced by line cooling in low-metallicity clouds yields prestellar cores with masses large enough that the final stellar mass is set by the feedback effects.
Subject headings:
accretion – stars: early-type – stars: evolution – stars: formation – stars: pre-main-sequence1. Introduction
What determines the mass of a newborn star? Our knowledge on this fundamental question in astrophysics is still limited. Observationally, the stellar initial mass function (IMF) is a power law with the Salpeter slope on the high-mass side and becomes flatter below a break at on the lower-mass side. Towards even lower mass (), the number of stars appears to decline (e.g., Muench et al. 2002). That is, the characteristic mass in the solar neighborhood is .
Recently, the mass distribution of dense cores in a star-forming region was found to have a similar shape to the stellar IMF, with a mass offset about a factor of three (Alves et al. 2007). Also, the typical mass of the cores is approximately the Jeans mass :
| (1) |
where we used the typical number density and temperature of the cores K. These facts indicate that the characteristic stellar mass is set already at the formation stage of dense cores through gravitational fragmentation. The factor of three reduction of the stellar mass from the core mass can be a result of some stellar feedback, e.g., protostellar outflows, which reduce the amount of material in the core, or binary/multiple formation. Theoretical estimations support such an efficiency for the low-mass cores (e.g., Matzner & McKee 2000).
Even though the characteristic stellar mass is determined by the gravitational (or turbulent) fragmentation process, formation of the most massive stars will be limited by the feedback from the protostar, as inferred from the following consideration. A small protostar, which forms at the center of the core subsequent to its gravitational collapse, grows in mass by accretion from the leftover core material, i.e., envelope. Since a massive protostar becomes so luminous during accretion, radiation pressure on dust grains easily disrupts the accretion envelope (Larson & Starrfield 1971; Kahn 1974; Wolfire & Cassinelli 1987). Under a typical accretion rate, i.e., a Jeans mass of gas falling on the protostar in a free-fall time ,
| (2) |
where is the sound speed in the natal core and is the gravitational constant, the upper mass limit by radiative pressure falls on about .
Although rare, stars more massive than this limit do exist in the Milky Way. How such stars formed is still debated. Accretion through a circumstellar disk can somewhat alleviate the radiative feedback. Besides, it appears that massive star formation requires a non-standard environment. For example, faster accretion than the standard or stellar mergers are sometimes invoked. In fact, observations tell us that accretion rates on massive protostars are quite high, (e.g., Zhang et al. 2005; Keto & Wood 2006; Grave & Kumar 2009), and the natal dense cores are unusually massive (e.g., Saito et al. 2006; Motte et al. 2007). However, as a guide, the upper mass limit within the standard accretion scenario is still important.
Metallicity governs the thermal balance in prestellar cores, thereby affecting the core temperature and the protostellar accretion rate through equation (2). The accretion rate in turn alters the protostellar evolution. Metals also act as catalysts in the CN cycle, modifying the stellar structure. In addition, lowering the dust opacity is expected to reduce the strength of the radiative feedback. As a first step, we here aim to calculate the evolution of accreting protostars and evaluate the mass limit where the accretion is prohibited by the stellar radiative feedback as a function of metallicity under the standard accretion rates and spherical symmetry. We consider the effects of radiation pressure exerted on the accretion envelope, as well as expansion of an H II region.
The organization of this paper is as follows. In § 2, we calculate the evolution of protostars at various metallicities. Next in § 3, we examine the radiative feedback effects. We also consider the limit of mass accreted over the main sequence lifetime. The final stellar mass is eventually derived as a function of the metallicity. In § 4, we also compare the obtained final stellar masses with the typical core masses at each metallicity. § 5 is devoted to conclusions.
2. Protostellar Evolution with Various Metallicities
2.1. Accretion Rates onto Protostars
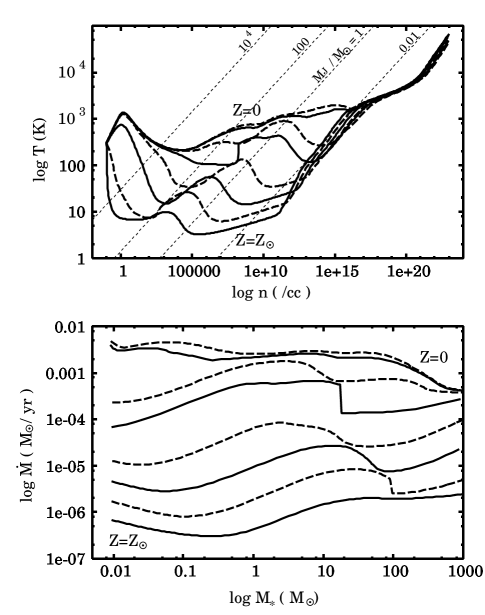
The accretion rate onto the protostar is determined by the prestellar temperature (eq. 2), which depends on metallicity. The temperature evolution during the prestellar collapse for various metallicities has been studied by Omukai et al. (2005) by using a one-zone model with detailed chemical and radiative processes. The prestellar core is assumed to undergo run-away collapse, i.e., its central flat part has a radius about the Jeans length and the central density increases at a free-fall timescale. Note that its radius and mass generally decreases with increasing density and thus most of the material originally in the core is left behind after some moment. We adopt the result by Omukai et al. (2005) in calculating the accretion rate, and their Figure 1 is reproduced in the upper panel of Figure 1. In general, prestellar temperatures are higher for lower metallicity.
The thermal evolution track is converted to the radial density or temperature profile of the envelope ( or ), where is the Jeans length. When materials within a radius have accreted on the protostar, the protostellar mass is , where is the Jeans mass with at radius . The accretion rate to this protostar is , where is the sound speed at radius . We derive accretion rates as a function of the instantaneous protostellar mass by converting the thermal evolution track to . The lower panel of Figure 1 shows those accretion rates. The higher accretion rates at lower metallicities reflect the higher temperatures in the envelopes.
Here, we have adopted the standard accretion rate . However, the accretion rate can vary according to the way of prestellar collapse. For example, in a dynamical runaway collapse, the Larson-Penston (LP) solution, the accretion rate reaches as high as , while the standard rate is almost exact for the static collapse of the singular isothermal sphere, the Shu solution. In realistic hydrodynamical calculations, the prestellar collapse asymptotically approaches the LP solution. The accretion rate is initially as high as times the standard rate and decreases gradually until it reaches the standard rate (e.g., Larson 2003). To accommodate possible such variations, we also examine the evolution with the accretion rate ten times higher than the standard value.
2.2. Result of Protostellar Evolution
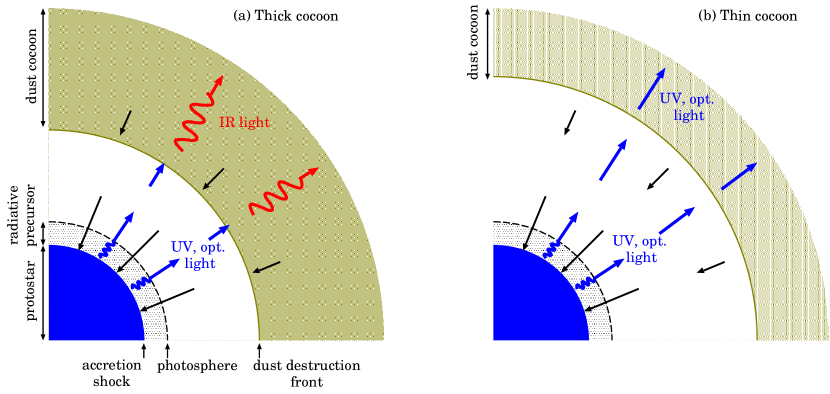
Next, we calculate the protostellar evolution with the derived accretion rates at each metallicity. Stellar feedback effects, which possibly alter the accretion rates, are separately examined in § 3.1 with the calculated evolution. Details of our numerical method are summarized in our previous papers (e.g., Hosokawa & Omukai 2009 and references therein). We explain a brief outline of the method and some improvements. Figure 2 schematically depicts the structure of a protostar and accretion envelope. Dust grains in the accretion envelope evaporate at a dust destruction front, where their temperature reaches about 2000 K. The envelope is divided into inner gas envelope and outer dust cocoon, whose boundary is the dust destruction front. We numerically solve the structure of an accreting protostar and gas envelope. The basic equations for the protostar are the stellar structure equations with mass accretion (e.g., Stahler, Shu & Taam 1980, Palla & Stahler 1991). We adopt the free-fall flow for the optically thin gas envelope. When the flow becomes opaque before reaching the stellar surface, we solve the structure of the opaque part, called a radiative precursor. The flow finally hits the stellar surface and forms an accretion shock front. The whole structure of the protostar and gas envelope is consistently determined to satisfy the shock jump conditions. An evolutionary calculation begins with a small initial protostar constructed according to Stahler, Shu & Taam (1980). We construct sequence of models with increasing stellar mass by accretion, until the protostar reaches the zero-age main-sequence (ZAMS) stage. Nuclear burning reactions of deuterium, hydrogen, and helium are included in our calculations. Further evolution in the post main-sequence stage is out of scope of this paper. In § 3.2, we roughly estimate when the MS stage is over with mass accretion. In this paper, we use the tabulated equation of state generated following Pols et al. (1995). Opacity tables at are also generated by logarithmic linear interpolation between the tables at and .
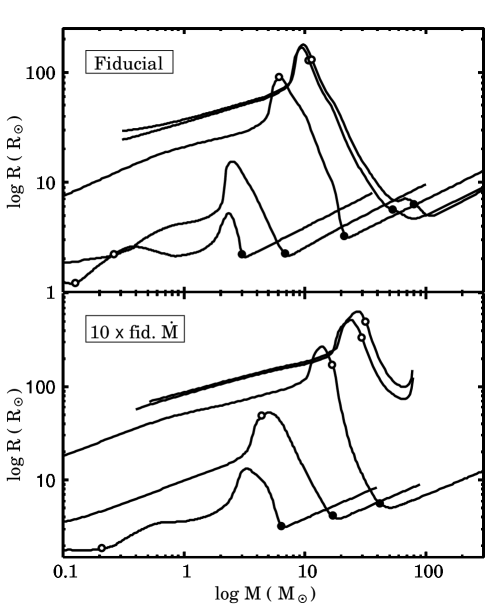
Figure 3 presents the calculated protostellar evolution at each metallicity. The evolution at agrees with previous calculations by Omukai & Palla (2001, 2003). There are four evolutionary stages with the fiducial accretion rates (upper panel): (i) adiabatic accretion (), (ii) swelling (), (iii) Kelvin-Helmholtz (KH) contraction (), and (iv) accretion to ZAMS star (). A key quantity to understand varieties of the evolution is a ratio between two timescales: the accretion timescale,
| (3) |
and the KH timescale,
| (4) |
The two timescales and can be regarded as evolutionary and thermal-adjustment timescales of the protostar. The protostar gains materials with high entropy generated at the accretion shock front on . Meanwhile, radiation diffuses outward and reduce the stellar entropy on . In the early phase, is much shorter than . The entropy taken into the star adiabatically accumulates in the stellar interior (adiabatic accretion). This stage is over because decreases ( increases) as the stellar mass increases. As approaches , the interior entropy is gradually transferred outward by radiation. A part of transferred entropy is received by the outer layer near the stellar surface. This causes the swelling of the star. Finally, becomes longer than . The star loses energy by radiation, and contracts hydrostatically (KH contraction). The central temperature increases with the KH contraction. When hydrogen burning is ignited, the protostar reaches the ZAMS stage. The above four evolutionary stages can be applied for other cases. The protostellar radius gradually increases in the early stage and then experiences the swelling. The protostar contracts in the next stage and finally arrives at the ZAMS. In all cases, the timescale balance switches from to at the swelling. However, Figure 3 also presents some different aspects of the evolution with different metallicities. The following three evolutionary tendencies result from the lower accretion rates at higher metallicities (see also Hosokawa & Omukai 2009).
(i) The protostellar radius is larger for lower metallicity. For , the radius exceeds at , while only a few for . This reflects higher entropy content in the star for higher accretion rate (see e.g., Hosokawa & Omukai 2009) as the radius is related with entropy by
| (5) |
Without enough time after the shock for accreted matter to cool radiatively before burying into opaque interior, the interior entropy is higher for higher accretion rate. (ii) The protostellar mass is higher at the onset of ZAMS phase for lower metallicity. The star arrives on the ZAMS at for , and at a few for (also see Fig.4). Since the stellar radius is larger for lower metallicity (e.g., lower accretion rate), the interior temperature is higher according to the relation,
| (6) |
Thus, higher is needed for ignition of hydrogen burning at K. (iii) Signatures of deuterium burning appear only at metallicity . At , the protostar becomes almost fully convective by deuterium burning at . The linear increase of the radius at is due to this effect. After that, the star gradually returns to be radiative by the swelling at . This is in contrast to the metal-poor cases. At , deuterium burning begins later at and hardly affects the evolution. The protostar remains radiative until its arrival to the ZAMS. These variations are also due to different evolution of the stellar inner temperature following equation (6).
Apart from different accretion rates, metallicity still influences the protostellar evolution. For example, the accreting MS star has smaller radius at the lower metallicity. This is due to different initial abundances of C and N atoms. Massive MS stars is supported against gravity with hydrogen burning via CN-cycle reactions. With lower CN abundance, higher temperature is required to supply enough to support the star, thus leading to smaller MS radius.
The lower panel of Figure 3 shows the protostellar evolution with accretion rate ten times higher than the fiducial value. The mass-radius relation varies with metallicity in the same manner as in the fiducial cases. Compared to the fiducial case at the same metallicity, a protostar has larger radius and arrives to the ZAMS at higher stellar mass, which is consistent with the dependence on accretion rates discussed above. Clear differences are found only for and . The protostar turns to inflate during the KH contraction in these cases. We separately focus on these cases in § 3.1.1 below.
3. Limits of Mass Accretion

3.1. Radiative Feedback Effects
Protostellar luminosity increases with growth of the star by accretion. Radiative feedback effects will eventually terminate the accretion. Below we examine the effects of radiation pressure exerted on a radiative precursor and dust cocoon, as well as of the expansion of an H II region. Our calculations have already included radiation pressure on the radiative precursor. We examine the other effects by separate analytic treatments and evaluate when these effects limit the accretion as a function of metallicity.
3.1.1 Radiation Pressure on Radiative Precursor
A protostar growing with very high accretion rate exerts strong radiation pressure on a radiative precursor, which is a optically thick part of the gas envelope. This effect is found in the calculated protostellar evolution with for (the lower panel of Fig. 3). In these cases, at the KH contraction turns to the abrupt expansion (also see Omukai & Palla 2003). The expansion occurs because radiation pressure decelerates the accreting flow before reaching the stellar surface. The stellar surface pressure, which balances the ram pressure by the flow, becomes too low to maintain the hydrostatic structure of the star. The expansion occurs when the total stellar luminosity approaches the Eddington limit , where is the Thomson scattering opacity. Although the luminosity from stellar interior remains below the Eddington limit, the total luminosity from the protostar has an extra contribution from the accretion shock:
| (7) |
Note that the internal to accretion luminosity ratio is equal to the timescale ratio . Since , becomes very high and reaches the Eddington limit for a high enough value of during the KH contraction, where the radius approaches the ZAMS value. This happens for the accretion rate exceeding the critical value for the case of and depending on metallicity only weakly (Omukai & Palla 2003; Hosokawa & Omukai 2009). This is indeed the case for with . In such cases, the protostars cannot keep accreting at its original rate after the abrupt expansion. If the accretion terminates at this moment, the final stellar mass will be (Fig. 5).
3.1.2 Radiation Pressure on Dust Cocoon
We here estimate the effect of radiation pressure on the dust cocoon. First, we consider how the radiation propagates outward in the accretion envelope. Most of the stellar radiation is initially emitted in UV and optical wavelengths. The stellar radiation travels freely between the photosphere and dust destruction front. Subsequent outward propagation in the dust cocoon depends on whether the cocoon is optically thick or thin for the stellar UV/optical light. If the cocoon is optically thick, most of the direct light is absorbed near the dust destruction front and is re-emitted in infrared wavelengths, then propagates outward diffusively. This is the case for the present-day protostars still embedded in their natal dense cores, which are observed as bright infrared sources. With lower abundance of dust grains, however, the cocoon becomes transparent even for the stellar UV/optical light. In this case, the direct stellar light escapes from the cocoon without absorption and re-emission. Figure 2 schematically shows the structure of the flow for these two cases. The optical depth of the cocoon is roughly estimated as
| (8) |
where is dust opacity for optical and UV light, and the suffix “d” denotes physical quantities at the dust destruction front. We regard the cocoon as optically thin (thick) if . The optical depth can be evaluated as follows. The position of the dust destruction front is
| (9) |
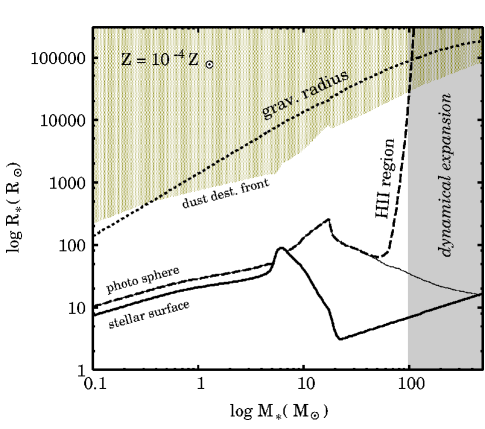
(Wolfire & Cassinelli 1987). The upper panel of Figure 6 shows evolution of the dust destruction front at , , and for the fiducial accretion rates. The front moves outward with increasing stellar mass as the total luminosity increases. We adopt a typical dust opacity in the optical range (e.g., McKee & Ostriker 2007),
| (10) |
For a free-falling flow, the density at is
| (11) |
We derive by substituting equations (9) and (11) into (8). Hence the optical depth decreases with the increase of stellar mass and luminosity. Even if the cocoon is initially optically thick, it becomes optically thin at some moment in the evolution. Evolution of the optical depth shown in lower panel of Figure 6 demonstrates this transition. At , for example, the cocoon becomes transparent for the direct light at . Note that the optical depth does not linearly scale with , owing to another dependence on . Figures 4 and 5 summarize the evolution of the dust cocoon for all cases.
Next, we consider the condition for the flow to overcome the radiation pressure for cases where the cocoon is optically thick or thin, respectively. In the optically thick case, most of the direct radiation is absorbed in a thin layer near the dust destruction front and isotropically re-emitted subsequently in infrared wavelengths. Hence the absorbing layer receives outward momentum flux of . For the accretion to proceed, the inward momentum flux of the flow must exceed this outward flux (Wolfire & Cassinelli 1987),
| (12) |
where is the free-fall infall velocity,
| (13) |
Using the continuity equation , equation (12) leads to a condition for accretion rates,
| (14) |
Additionally, the flow in the cocoon must overcome the radiation pressure by the infrared re-emission. This condition can be stated as that the stellar total luminosity be less than the Eddington limit defined with dust opacity for infrared light :
| (15) |
Otherwise, radiation pressure decelerates the accretion flow before reaching the dust destruction front. The infrared opacity in the local star-forming regions takes its maximum at K (e.g., Pollack et al. 1994). We adopt the Rosseland mean opacity at this maximum as the infrared opacity
| (16) |
On the other hand, for an optically thin cocoon, the stellar radiation is not converted to infrared radiation by absorption and re-emission. The only condition is that the total stellar luminosity be less than the Eddington limit for the opacity at the UV/optical light ,
| (17) |
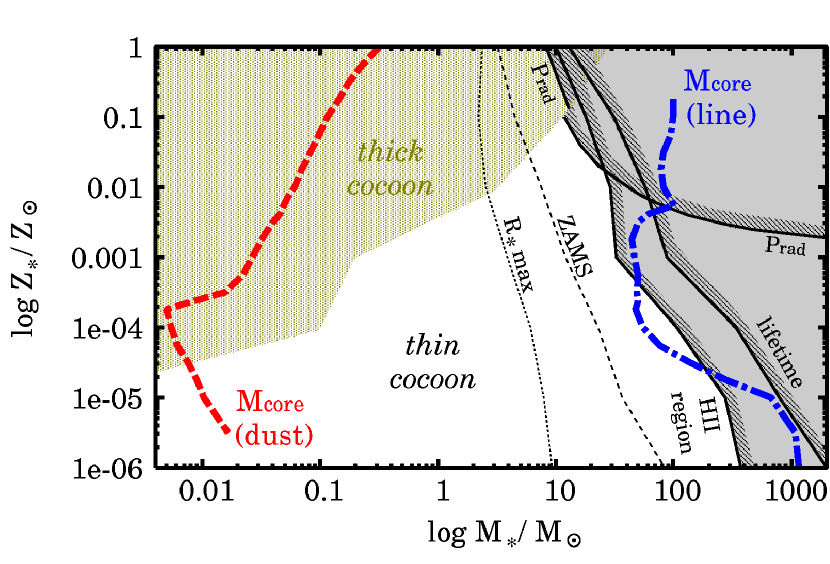
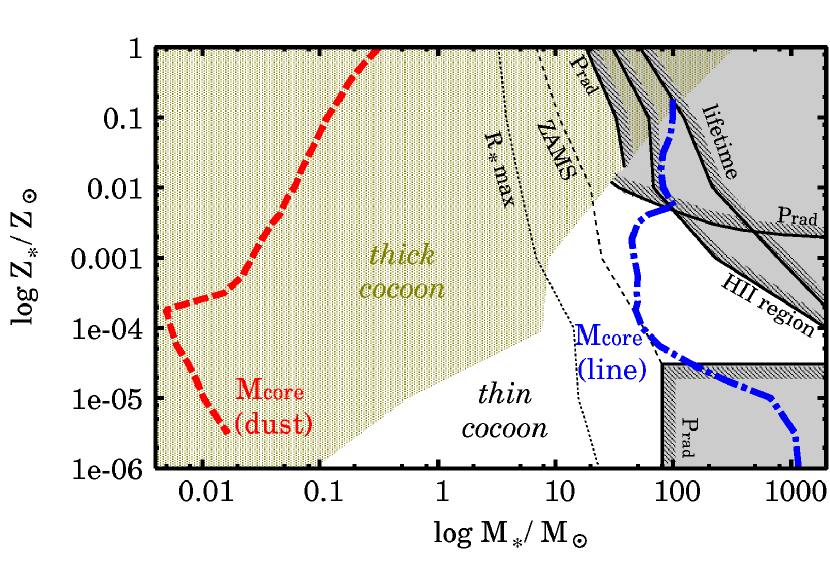
Figures 4 and 5 show the limit when the radiation pressure becomes so strong to violate the above conditions. For with the fiducial accretion rate, for example, the flow is optically thick until . For an optically thick flow, equation (14) usually put the stricter condition than equation (15), and the upper limit falls on for (Figure 4). At , the optically thick/thin transition of the flow occurs at and the accretion continues until , where the condition (17) is violated. Both figures show that the limiting mass increases with decreasing the metallicity. Radiation pressure on the dust cocoon does not limit mass accretion at .
3.1.3 Expansion of an H II Region
The stellar UV luminosity increases with its mass. Strong UV photons ionize gas near the star and an H II region develops inside the accreting envelope. For the free-falling flow with accretion rate , the radius of the H II region can be expressed as a function of the UV photon number luminosity :
| (18) |
where is radius of the photosphere and the critical UV luminosity is defined as,
| (19) |
where is the recombination efficiency and is mass per hydrogen atom. As long as , the HII region is confined near the stellar surface. Once the stellar UV luminosity exceeds , the HII region grows exponentially and soon encloses all materials in the natal core. Figure 7 presents the evolution of the protostar and its H II region for with the fiducial accretion rate. In this case, the photosphere locates beyond the accretion shock front at the stellar surface except short duration around . The UV photon number luminosity is calculated by
| (20) |
where is the Lyman-limit frequency, is Planck constant, and is Planck function with the effective temperature . Figure 7 shows that the H II region begins to expand exponentially at .
The evolution of the HII region and the accretion flow experiences the following two stages, depending on the ratio of the radius of the HII region and the gravitational radius of an ionized gas,
| (21) |
where is the sound speed of ionized gas and is a correction factor taking account of repulsive force by radiation pressure. When , the accreting flow supersonically passes through the ionization front. Although the temperature and pressure jump up behind the ionization front, this hardly influences the flow dynamics. The heated gas inside the H II region is also gravitationally bound to the central protostar. Once exceeds , the accreting flow becomes subsonic and dynamical expansion of the H II region disrupts the accreting envelope. The gas inside the H II region begins to move outward owing to the pressure excess of the ionized gas. A shock front emerges ahead the ionization front, and sweep up materials into a shell around the H II region.
Strictly speaking, the density distribution of the flow deviate from the free-fall one even without rotation. Radiation pressure via photoionization decelerates the flow and increases the density. Omukai & Inutsuka (2002) showed that this effect can significantly delay the dynamical expansion of an H II region around the first star (). However, McKee & Tan (2008) argued that relaxing the spherical symmetry reduces this effect. In the rotating core collapse, density in the polar region decreases by a large factor by the epoch when an H II region forms. As a result, radius of the H II region reaches before the trapping effect becomes important (see § 5.2 of Mckee & Tan 2008 for detail). The trapping effect becomes even weaker for lower accretion rates, i.e., for higher metallicity. In this paper, although we treat the spherically symmetric flow in estimating the radiation feedback, small asphericity is assumed to exist to alleviate the trapping effect by the photoionization.
Figure 6 shows that the dynamical expansion occurs at at . The stellar mass limit by the HII region expansion is summarized in Figures 4 and 5 as a function of metallicity. With the fiducial accretion rates, the expansion of an H II region is the primary feedback effect disrupting the accreting envelope for . The mass limit increases from to with decreasing metallicity. This is because higher accretion rate can quench the H II region of the more massive star. With ten-times the fiducial accretion rate, the mass limit exceeds for . In these cases, not the expansion of an HII region, but the radiation pressure on the radiative precursor limits mass accretion for (§ 3.1.1).
The mass limit by the H II region expansion is for with the fiducial accretion rates. This happens to be comparable to that by McKee & Tan (2008), . However, they consider mass accretion via an accretion disk formed by rotating core collapse. The breakout of an H II region beyond occurs earlier at . Photoevaporation of the accretion disk finally quenches mass accretion. The same process can work in halting the accretion also for finite metallicities, and should be explored in future work.
3.2. Mass Limit by Stellar Lifetime
We have shown that mass accretion to a protostar is limited by radiative feedback effects, i.e., radiation pressure exerted on a dust cocoon for , and expansion of an H II region for lower metallicity. Figures 4 and 5 show that these limits are reached after the protostar arrives at the ZAMS. For very high feedback limits, accreting stars might end their lives before reaching such limits. The maximum mass of the star can gain in its lifetime is roughly given by
| (22) |
where is the lifetime of a ZAMS star of . This limit is also presented in Figures 4 and 5. Here, we adopt of primordial stars from Marigo et al. (2001) for and from Schaerer (2002) for , as their dependence on metallicity is weak. We see that the limit by the lifetime is less stringent than those by the radiative feedback effects. Hence the final stellar mass will be set by the feedback effects, as long as the prestellar core is massive enough.
4. Characteristic Core Mass Scales
The mass limit derive above is reached only in the case that the mass reservoir, i.e., the mass of the natal core, is sufficient. Here, we discuss the characteristic mass of the prestellar cores and compare them with the mass limits by the feedback. The cores are formed as a result of fragmentation of a more massive cloud. According to analytical (Schneider et al. 2002; Larson 2005) and numerical (Bromm, Coppi & Larson 2002; Jappsen et al. 2005; Clark, Glover & Klessen 2008; Smith et al. 2009) arguments, fragmentations likely occur around temperature minima of thermal evolution tracks (see Figure 1), and cores of about the Jeans mass are produced. This figure shows that the tracks at experiences two local temperature minima, i.e., one at lower density , where , and the other at higher density , where . The former is induced by the line cooling, i.e, cooling by the H2 lines for , and the metal fine-structure lines for higher metallicity, while the latter is by the dust cooling. In clouds with extremely low-metallicity, dust-induced minimum disappears, thus only high-mass fragmentation is allowed. On the other hand, at , two minima almost merges and result in a single characteristic mass-scale. The typical core mass in the cases with two fragmentation epochs is not clear yet. We speculate that massive and small cores corresponding to two fragmentation epochs exist simultaneously, and their number ratio depends on the efficiency of dust-induced fragmentation.
Those characteristic core mass-scales are also shown in Figure 4 and 5 for comparison with the stellar mass limits by the feedback. The characteristic core masses by the dust-induced fragmentation is much smaller than the stellar mass limits. In such cores, the final stellar masses are bounded by the amount of mass reservoir rather than the stellar feedback. On the other hand, the typical core masses by the line-induced fragmentation are comparable to the mass limit by the radiative effects. In such massive prestellar cores, therefore, the final stellar masses should be limited by the radiative effects and very massive stars can be formed in low-metallicity environments.
5. Summary
We studied protostellar evolution as a function of the metallicity, using the results to evaluate the significance of radiative feedback effects. For metallicities between zero and Solar, we showed how the feedback terminates the mass accretion and determines the final stellar mass. Our results are summarized as follows:
First, we estimated accretion rates onto a protostar from the thermal evolution of a prestellar core at each metallicity. The accretion rates are higher at the lower metallicity, ranging from at to at . This is because the core temperature is higher at the lower metallicity.
Next, we numerically calculated the protostellar evolution with the derived accretion rates at each metallicity. The calculated evolution depends on the metallicity. For lower metallicity, a protostar has larger radius and arrives at the ZAMS at higher stellar mass. These variations reflect the difference in the accretion rates.
We also examined radiative feedback effects that may halt the mass accretion onto a protostar, i.e., radiation pressure on a radiative precursor and dust cocoon, and expansion of an H II region. The radiation pressure exerted on the dust cocoon limits mass accretion for . The upper mass limit increases with decreasing metallicity. At low metallicity, the high accretion rate and low dust opacity enable the accreting flow to overcome the radiation pressure barrier. For , the expansion of an H II region instead will disrupt the accretion envelope. The mass limit resulting from the H II region expansion also increases with decreasing metallicity because higher density in the flow hinders the development of the HII region. These feedback effects become significant after the protostar reaches the ZAMS, but before the stellar lifetime is over. With the accretion rates ten times higher than the fiducial values, radiation pressure on the radiative precursor limits the steady mass accretion at for .
Cores of two typical mass-scales are produced by fragmentation over wide ranges in metallicity. One scale comes from line cooling (), and the other from dust cooling (). The mass limit due to the radiative feedback effects is far higher than the typical masses with dust cooling, and comparable to those with line cooling. In massive cores formed by line-induced fragmentation, the radiative feedback effects terminate mass accretion and set the final stellar masses.
References
- (1) Alves, J., Lombardi, M., & Lada, C. J., 2007, A&A, 462, L17
- Bromm, Coppi & Larson (2002) Bromm, V., Coppi, P.S. & Larson, R.B., 2002, ApJ, 564, 23
- Clark, Glover & Klessen (2008) Clark, P.C., Glover, S.C.O. & Klessen, R.S., 2008, ApJ, 672, 757
- Grave & Kumar (2009) Grave, J.M.C. & Kumar, M.S.N., 2009, A&A, 498, 147
- Hosokawa & Omukai (2009) Hosokawa, T. & Omukai, K., 2009, ApJ, 691, 823
- Jappsen et al. (2005) Jappsen, A.K., Klessen, R.S., Larson, R.B., Li, Y. & Mac Low, M.M., 2005, A&A, 435, 611
- Kahn (1974) Kahn, F.D., 1974, A&A, 37, 149
- Keto & Wood (2006) Keto, E. & Wood, K., 2006, ApJ, 637, 850
- Larson & Starrfield (1971) Larson, R.B. & Starrfield, S. 1971, A&A, 13, 190
- Larson (2003) Larson, R.B., 2003, Rep. Prog. Phys., 66, 1651
- Larson (2005) Larson, R.B., 2005, MNRAS, 359, 211
- Matzner & McKee (2000) Matzner, D.D. & McKee, C.F., 2000, ApJ, 545, 364
- Marigo et al. (2001) Marigo, P., Girardi, L., Chiosi, C. & Wood, P.R., 2001, A&A, 371, 152
- McKee & Tan (2008) McKee, C. & Tan, J.C., 2008, ApJ, 681, 771
- McKee & Ostriker (2007) McKee, C.F. & Ostriker, E.C., 2007, ARA&A, 45, 565
- Muench et al. (2002) Muench, A.A., Lada, E.A., Lada, C.J. & Alves, J., 2002, ApJ, 573, 366
- Motte et al. (2007) Motte,F., Bontemps,S., Schilke,P., Schneider,N., Menten,K.M. & Broguiere,D., 2007, A&A, 476, 1243
- Omukai & Nishi (1998) Omukai, K. & Nishi, R., 1998, ApJ, 508, 141
- Omukai (2000) Omukai, K., 2000, ApJ, 534, 809
- Omukai & Palla (2001) Omukai, K. & Palla, F., 2001, ApJ, 561, 550L
- Omukai & Inutsuka (2002) Omukai, K. & Inutsuka, S., 2002, MNRAS, 332, 59
- Omukai & Palla (2003) Omukai, K. & Palla, F., 2003, ApJ, 589, 677
- Omukai et al. (2005) Omukai, K., Tsuribe, T., Schneider, R. & Ferrara, A., 2005, 626, 627
- Palla & Stahler (1991) Palla, F. & Stahler, S.W., 1991, ApJ, 375, 288
- Palla, Salpeter & Stahler (1983) Palla, F., Salpeter, E.E. & Stahler, S.W., 1983, ApJ, 271, 632
- Pollack et al. (1994) Pollack, J.B., Hollenbach, D., Beckwith, S., Simonelli, D.P., Roush, T., Fong, W., 1994, ApJ, 421, 615
- Pols et al. (1995) Pols, O.R., Tout, C.A., Eggleton, P.P. & Han, Z., 1995, MNRAS, 274, 964
- Saito et al. (2006) Saito, H., Saito, M., Moriguchi, Y. & Fukui, Y., 2006, PASJ, 58, 343
- Schaerer (2002) Schaerer, D., 2002, A&A, 382, 28
- Schneider et al. (2002) Schneider, R., Ferrara, A., Natarajan, P. & Omukai, K., 2002, ApJ, 571, 30
- Smith et al. (2009) Smith, B.D., Turk, M.J., Sigurdsson, S., O’Shea, B.W. & Norman, M.L., 2009, ApJ, 691, 441
- Stahler, Palla & Salpeter (1986) Stahler, S.W., Palla, F. & Salpeter, E.E., 1986, ApJ, 302, 590
- Stahler, Shu & Taam (1980) Stahler, S.W., Shu, F.H. & Taam, R.E., 1980, ApJ, 242, 226
- Wolfire & Cassinelli (1987) Wolfire, M.G. & Cassinelli, J.P., 1987, ApJ, 319, 850
- Zhang et al. (2005) Zhang, Q., Hunter, T.R., Brand, J., Sridharan, T.K., Cesaroni, R., Molinari, S., Wang, J. & Kramer, M., 2005, ApJ, 625, 864