A Mid-Infrared Counterpart to the Magnetar 1E 2259+586
Abstract
We report the discovery of a counterpart to the anomalous X-ray pulsar (magnetar) 1E 2259+586 with the Spitzer Space Telescope. The mid-infrared flux density is at and 20 (at 95% confidence) at , or % of the 2–10 keV X-ray flux (corrected for extinction). Combining our Spitzer measurements with previously published near-infrared data, we show that the overall infrared emission from 1E 2259+586 is qualitatively similar to that from the magnetar 4U 0142+61. Therefore, the passive X-ray-heated dust disk model originally developed for 4U 0142+61 might also apply to 1E 2259+586. However, the IR data from this source can also be fitted by a simple power-law spectrum as might be expected from magnetospheric emission.
Subject headings:
infrared: stars — pulsars: individual: 1E 2259+586 — stars: neutron — supernovae: general1. Introduction
The notion of supernova fallback, where some of the ejecta from a core-collapse supernova ends up captured by the newly formed neutron star (Chevalier, 1989) and may have sufficient angular momentum to form a disk (Lin, Woosley, & Bodenheimer, 1991), has been a general prediction of supernova models (e.g., Woosley & Weaver, 1995). Fallback can have profound effects on the final state of the neutron star, forming disks that can give rise to planets (Phinney & Hansen, 1993; Podsiadlowski, 1993), and possibly even causing the neutron star to collapse into a black hole. Fallback disks should manifest as a thermal infrared excess (Perna, Hernquist, & Narayan, 2000), but previous searches for such excesses around neutron stars were unsuccessful (Löhmer et al., 2004, and references therein).
Several years ago, though, we discovered the mid-infrared (mid-IR; here, and ) counterpart to the magnetar 4U 0142+61 (Wang, Chakrabarty, & Kaplan, 2006, hereafter WCK06). The combined optical/IR spectrum of this magnetar suggests that the optical and IR data arise from two different spectral components. While the optical component is demonstrably of magnetospheric origin (Kern & Martin, 2002), we showed that the IR component may arise from a passive (i.e., not accreting, but see Ertan et al. 2007), dust disk irradiated by X-rays from the magnetar (WCK06; Wang, Chakrabarty, & Kaplan 2008b). The inferred spectral shape, while not well constrained, is remarkably similar to those of protoplanetary disks around young stars (Beckwith et al., 1990). The disk’s survival lifetime ( yr) significantly exceeds the pulsar’s spin-down age111While spin-down is not an accurate measure for the age of a magnetar (Woods & Thompson, 2006), no independent age estimate is available for 4U 0142+61 and this age is consistent (if not somewhat longer than) typical ages of other magnetars. ( yr), consistent with a supernova fallback origin.
This dust disk model, while intriguing, is not definitive. In particular, we have yet to firmly establish whether the mid-IR flux in 4U 0142+61 comes from a disk or from the magnetosphere (via any of a number of mechanisms, e.g., Eichler, Gedalin, & Lyubarsky 2002; Ertan & Cheng 2004; Lu & Zhang 2004; Heyl & Hernquist 2005; Beloborodov & Thompson 2007). Variability at a single wavelength or across wavelengths can be a powerful discriminant, depending on the timescale. This was illustrated by Kern & Martin (2002), who found that the pulsed fraction in the optical exceeded that in soft X-rays, making it impossible for the optical to result from reprocessed X-rays (also see Dhillon et al. 2005). In the infrared the situation is less clear. The significant variability seen by Durant & van Kerkwijk (2006c) at with no related change in soft X-rays provides a stiff test for a disk model, but is not definitive (see Wang & Kaspi 2008). The unknown behavior at higher energies, the complicated behavior across the optical/near-infrared (near-IR), and the lack of pulsations at (% pulsed at 90% confidence; Morii et al., 2009) all complicate the matter.
As we attempt to determine the origin of the mid-IR emission, we must equally attempt to understand how ubiquitous mid-IR counterparts to young neutron stars are. Suggestively, all four of the magnetars with confirmed quiescent near-IR counterparts have the same near-IR/X-ray flux ratio of (Durant & van Kerkwijk, 2005, 2006d). In the disk scenario, this ratio should be determined largely by geometry, so mid-IR observations of other magnetars down to this fractional level may help establish whether disks are present, but similar behavior might also be expected from magnetospheric emission. Shallow mid-IR searches of three other magnetars were not very constraining (Wang, Kaspi, & Higdon, 2007), but deep a upper limit for 1E 1048.15937 following an X-ray flare concluded that it did not have a mid-IR counterpart similar to that of 4U 0142+61 despite its similar near-IR/X-ray flux ratio, thus casting some doubt on the disk interpretation (Wang et al., 2008a). Here, we present the results of a deep search with the Spitzer Space Telescope for a mid-IR counterpart to the magnetar 1E 2259+586.
1E 2259+586 (catalog 1E 2259+58.6) was identified as an X-ray point source with coherent s pulsations in the center of the supernova remnant (SNR) CTB 109 (Fahlman & Gregory, 1981). The association leads to a distance of kpc based on interactions between the SNR and H II regions with measured distances (Kothes, Uyaniker, & Yar, 2002), although Durant & van Kerkwijk (2006a) determined a distance to 1E 2259+586 of kpc using the “red clump” method. Durant & van Kerkwijk (2006b) found the column density to 1E 2259+586 to be , corresponding to a visual extinction of mag, from fitting of X-ray absorption edges (consistent with earlier measurements; Patel et al. 2001). The near-IR (-band, or ) counterpart to 1E 2259+586 was identified by Hulleman et al. (2001). Uniquely among magnetars, the near-IR flux was observed to vary in concert with the X-ray flux, with both declining following a major series of X-ray bursts (Tam et al., 2004). This led to the suggestion of X-ray heating of a disk (as in Matsuoka et al., 1984, for a low-mass X-ray binary), making this source an especially attractive target for mid-IR searches.
2. Observations and Reduction
2.1. IRAC Data
Our primary data (catalog ADS/Sa.Spitzer#23351296) were observations of 1E 2259+586 with the Infrared Array Camera (IRAC; Fazio et al. 2004) onboard the Spitzer Space Telescope (Werner et al., 2004) on 2007 August 8. We observed 1E 2259+586 using two of the four possible IRAC channels: and (IRAC channels 2 and 4). The observation consisted of 50 dithered exposures of s for a total integration of minutes.
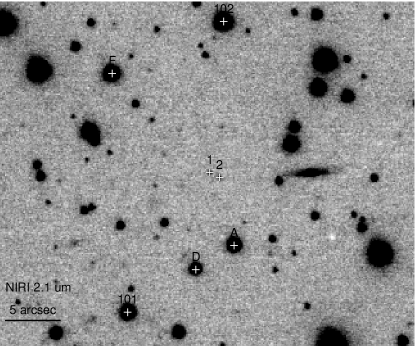
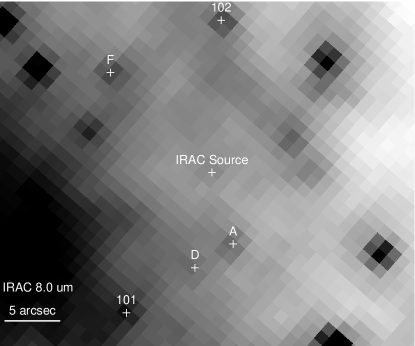
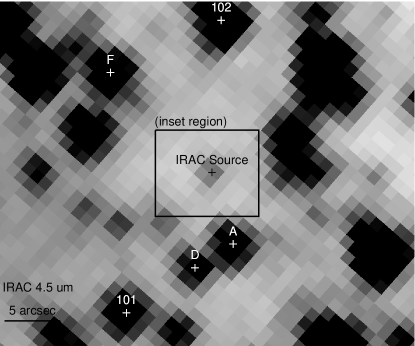
We started with the Basic Calibrated Data (BCD, from pipeline version S16.1.0), discarding the first exposure at each wavelength as recommended. We then processed the BCD images though an artifact mitigation pipeline222See http://spider.ipac.caltech.edu/staff/carey/irac_artifacts/. (2005 October 13 version). With the MOPEX (MOsaicker and Point source EXtractor, ver. 16.3.7) pipeline, we mosaiced the individual exposures together by interpolating the data onto a common grid and rejecting radiation hits. The final images are shown in Figure 1.
2.2. Gemini Data
Our analysis requires precise relative astrometry, and the angular resolution of the IRAC images results in many blended objects. To aid in interpreting our mid-IR data and in particular to serve as an improved astrometric reference, we analyzed an archival near-IR (-band, or ) observation taken with the Near-Infrared Imager (NIRI; Hodapp et al. 2003) on the 8 m Gemini North telescope at Mauna Kea, Hawaii. The data consist of 50 exposures with the /6 camera taken on 2003 May 27 (and previously published by Tam et al. 2004), each with s integrations, for a total exposure of minutes. We used an IRAF package available from the NIRI Web site333See http://www.us-gemini.noao.edu/sciops/instruments/niri/NIRIIndex.html. to reduce the data. We proceeded through the steps of this package, flatfielding the data, subtracting the sky, shifting the images, and adding them together. We referenced the astrometry of the final image to the Two Micron All Sky Survey (2MASS; Skrutskie et al. 2006), finding 57 stars that were not saturated or badly blended, and getting rms residuals of in each coordinate. This image is also shown in Figure 1.
3. Analysis
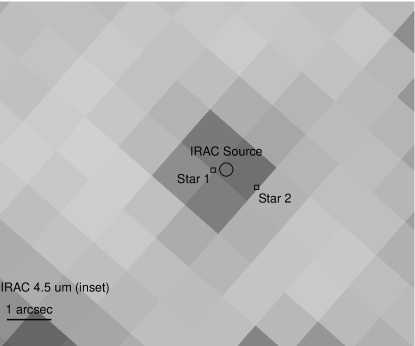
We searched the IRAC images in Figure 1 for a counterpart to 1E 2259+586 by looking for a point source at the position corresponding to star 1 (which is 1E 2259+586; Hulleman et al. 2001) in the NIRI image. At this position, we see a faint point source in the IRAC image (hereafter the “IRAC source”). However, one must be careful, as the position of star 2 only differs from that of the magnetar by ; this is 1 IRAC pixel width, and only half of the angular resolution of the image ( FWHM).
We performed photometry on the IRAC image to find the positions and flux densities of all of the point sources. We used the APEX (Astronomical Point Source EXtraction, part of MOPEX) software to identify and perform point-response function (PRF) fitting for the photometry using the routine apex_1frame.pl with the Spitzer-supplied PRF. The PRF is the traditional point-spread function (PSF) convolved with the pixel-response function to determine how a source actually appears in the data444The distinction between the PSF and PRF is important for undersampled or critically sampled data like those here; see http://ssc.spitzer.caltech.edu/irac/psf.html.. Part of this analysis identified blended objects using simultaneous PRF fitting, but the IRAC counterpart was consistent with a single point source (the per degree of freedom for the PRF fit was , consistent with other point sources in the field which have reduced of 0.1–3) with flux density at . The uncertainty here includes the standard term from the PRF fitting but is dominated by substantial contributions from difficulty in robustly measuring the background and identifying which pixels make up the source. At there is no detection, and we estimate a limit of (95% confidence, limited largely by the varying diffuse background) based on the APEX detections in that region.
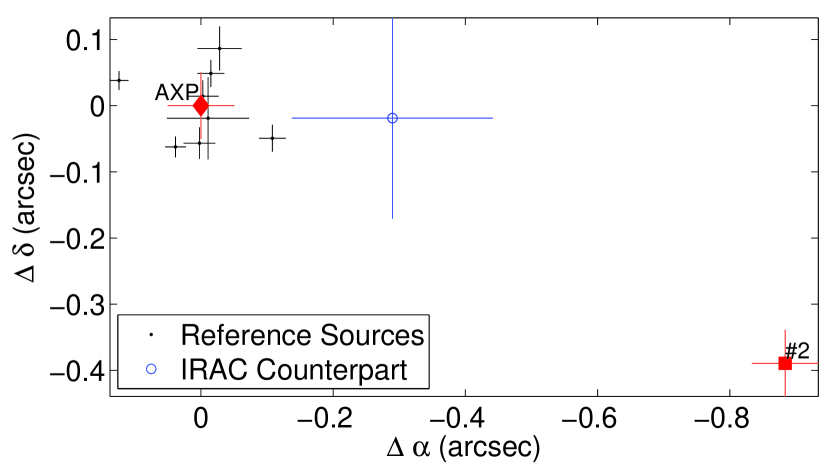
In determining whether the IRAC source is indeed the counterpart to star 1, we considered three issues. First, we were concerned with whether the position of the IRAC source is consistent with that of star 1 or 2. We took the astrometry (using both APEX and standard centroiding; both gave consistent results) of the eight reference sources (some of which are labeled in Figure 1), along with the NIRI astrometry of those objects and stars 1 and 2. We used the reference stars to refine the astrometry of the IRAC image relative to the NIRI image (we did not use a proper reference frame as an intermediary, as this would have introduced additional uncertainties). Fitting only for an offset (the position angles of both observations were referenced independently to 2MASS), we found a small shift () with an rms of . With this shift, the position of the IRAC source differs from that of star 1 by , and from that of star 2 by (see Figure 2). There is an intrinsic centroiding uncertainty for the IRAC source (the potential counterpart) of in each coordinate (90% confidence radius of ). Given this, the IRAC source is largely consistent with the position of star 1 (the probability of chance alignment is 78%) and is inconsistent with the position of star 2 (the probability of chance alignment is 99.998%). The situation is also illustrated in the bottom right panel of Figure 1, which shows the extent of the PRF of the IRAC counterpart, the measured centroid, as well as the positions of stars 1 and 2 in the same reference frame.
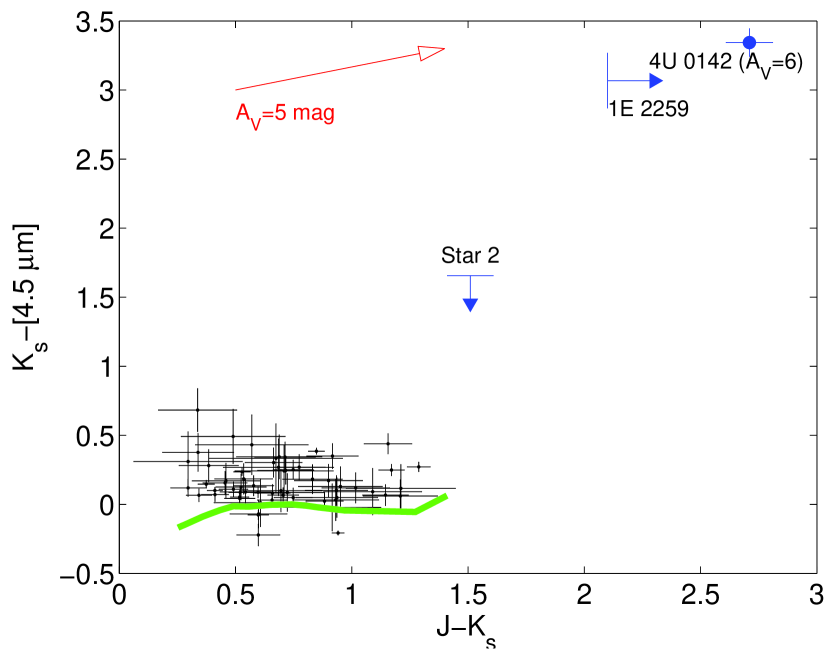
Second, we compared the IR colors of the IRAC source to all of the other objects in the field. We show a color-color diagram in Figure 3. For the IRAC source, we used the near-IR (- and -band) photometry of star 1 given by Hulleman et al. (2001); for star 2, we also used the photometry from Hulleman et al. (2001); for the field stars, we used 2MASS for the near-IR. Assuming, as deduced from the above astrometry, that the IRAC source is associated with star 1 and not with star 2, we see that star 2 is consistent with the bulk of the field population, i.e., reddened main-sequence stars. On the other hand, the IRAC source is significantly redder in both and and clearly stands out from the population. It is quite close in colors to 4U 0142+61, for the same extinction. Uncertainties in the visual extinctions of both 1E 2259+586 and 4U 0142+61 amount to mag (Durant & van Kerkwijk, 2006b) and do not change the general agreement because of the small extinctions at near- and mid-IR bands (, , ; also see Figure 4)).
Finally, we examined the spectral energy distributions (SEDs) of the IRAC source and star 2 (Figure 4). First, we estimated the spectral type of star 2. With only two data points (, ) we could not discriminate between later stellar type and higher reddening (the - and -band upper limits from Hulleman, van Kerkwijk, & Kulkarni 2000 were not constraining), but we find reasonable solutions for K/M dwarf stars with a few magnitudes of extinction and distances of a few kpc (based on Cox 2000). For stars of those spectral types, we would expect the SED to peak in the near-IR region and decline in the IRAC bands, with typical flux densities of expected. Even brown dwarfs, which can be redder in , have (Patten et al., 2006). There are classes of objects such as young stellar objects or massive stars with dusty winds that could produce such red colors (e.g., Uzpen et al., 2007; Muench et al., 2007), but they are relatively rare (although this is a complicated region with many objects along the line of sight; Kothes et al. 2002), often brighter than star 2 (spectral types earlier than about F0V would have to be well outside the Galaxy to have the observed magnitude), and would likely have been identified at this position in other wavelengths (X-ray, near-IR, molecular line, or continuum radio, etc.; see Kothes et al. 2002; Sasaki et al. 2004) but were not. In contrast, the flux density of the IRAC source is a factor of 3 higher than the -band flux densities of star 1 or 2, and an order of magnitude higher than the expectation for a normal star at .
Taken together with the astrometry, this is strong support for not associating the IRAC source with star 2, but instead with star 1. It is extremely unlikely that the IRAC source is associated with neither object, as probability of chance coincidence with star 1 is only 0.3%, and this would also imply even more extreme colors (Figure 3) that would be clearly non-stellar. Even with several tens of magnitudes of extinction it would be difficult to move the IRAC source onto the stellar locus, and examining the NIRI image we see no other sources with . From Durant & van Kerkwijk (2006a), an extinction of only mag is reached at kpc, and the molecular gas maps of Colden555See http://asc.harvard.edu/toolkit/colden.jsp. find a maximum extinction of mag, so having very high extinction outside of very local extinctions seems unlikely. We therefore conclude that the IRAC source is indeed the mid-IR counterpart to star 1/1E 2259+586.
4. Discussion
We have found a counterpart to the magnetar 1E 2259+586, with flux density and a limit of at . The absorption-corrected mid-IR/X-ray666The unabsorbed X-ray flux of 1E 2259+586 is (Patel et al., 2001), although this is only over the 2–10 keV range and does not include softer emission which is uncertain due to the moderate absorption. flux ratio for this source is , very similar to the ratio for 4U 0142+61, so the common X-ray to flux ratios (Durant & van Kerkwijk, 2005) seem to extend further into the infrared. We note, though, that one must be careful with any model or interpretation for the IR emission since the flux density of 1E 2259+586 (and of 4U 0142+61 for that matter; Hulleman, van Kerkwijk, & Kulkarni 2004; Durant & van Kerkwijk 2006c) is known to vary. The flux density we plot in Figure 4 is the faintest measured and is assumed to be close to the baseline level (Tam et al., 2004) and should not be affected by flares, but it was measured two years before the IRAC observations. For 1E 2259+586, the IR variability had been seen along with X-ray flaring (Kaspi & Gavriil, 2002; Kaspi et al., 2003) in the past. Since then, though, no transient X-ray behavior for 1E 2259+586 was reported and the X-ray flux is now near the quiescent level (although with a slightly different spectrum; Zhu et al. 2008), so our assumption of a baseline flux seems safe, but X-ray monitoring is not very regular and there could potentially be IR variability independent of X-ray activity.
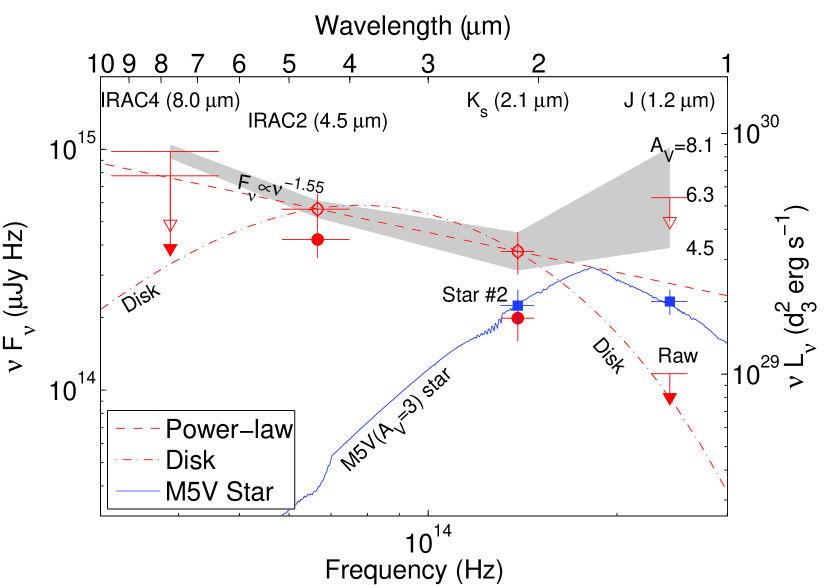
With the limited data we have, a wide range of model fits are possible. Here we discuss two general categories: a power law and an irradiated disk model. A simple power law () can fit the two detected IR flux points and is also below the upper limits at and (Figure 4). Such a power law spectrum could arise from the pulsar magnetosphere (as for Crab pulsar; see Temim et al., 2006), which could also possibly produce correlated X-ray and infrared flux changes, although this has not been studied in detail. However, unlike the Crab pulsar, this power-law rises further into the mid-IR band, and it would be interesting to obtain longer-wavelength data on 1E 2259+586 to see if the SED keeps rising past , but source confusion makes this very difficult. The rising spectrum is problematic for some detailed magnetospheric models (like those of Ertan & Cheng 2004 and Heyl & Hernquist 2005), but a generic magnetospheric origin is certainly possible.
However, as with 4U 0142+61 (WCK06), we can also fit the 1E 2259+586 data with an irradiated passive disk model (also see Vrtilek et al. 1990; Perna et al. 2000; other spectral shapes are also possible, but the fits are too unconstrained and without specific motivation we will not address them). Without more data, we cannot make conclusions about the presence or absence of a disk, and indeed other observations suggest that a disk interpretation is problematic (Wang et al., 2008a). However, it is still possible, and we find it worthwhile to expand on the discussion of WCK06 and further explore the implications such a disk would have, noting in particular where 1E 2259+586 differs from 4U 0142+61.
This model fit is qualitatively similar to what we obtained in WCK06 for 4U 0142+61, with a small inner radius and an outer radius a factor of a few to 10 larger. The details of both fits depend on assumptions about the distances, extinctions, and inclinations, but the rough shapes of the SEDs going from the near- to mid-IR are similar, with a factor of 3 in flux density increase from to , after correcting for extinction (unlike what Wang et al. 2008a found for 1E 1048.15937). The inner radius is constrained by the need to have the -band measurement lie below the measurement, while the outer radius is less constrained by the upper limit. Note that the nominal inner radius of (for a distance of 3 kpc and an inclination of ) is smaller than the light cylinder radius () which would imply interaction between the disk and the magnetar’s spin (e.g., Chatterjee et al., 2000)—possibly contradicted by its observed steady spin-down (Gavriil & Kaspi, 2002). This could either point to an inconsistency in our model, or simply that we must choose the other model parameters (distance, inclination, etc.) such that the inner radius is ; as an example, a larger distance such as that determined by Durant & van Kerkwijk (2006a) has an inner radius777As mentioned in WCK06, the inner radius discussed here is just that to which dust can penetrate. Gas could extend further inward, so that even with the inner dust radius larger than the light cylinder radius interactions could still occur. more than twice the light cylinder radius.
The binding energy of the putative disk, following WCK06 to estimate the disk mass, is for the upper end of the mass estimate. This is large enough that we do not have to worry that such a disk would have been unbound by the large X-ray bursts (a total fluence of , or total isotropic energy of ) found by Kaspi et al. (2003), and the physical state and structure of the disk may not be altered dramatically, as this energy is equivalent to only s of normal X-ray activity. Even a disk several order of magnitude lower in mass would remain bound. Only a truly giant flare, such as those seen from several soft -ray repeaters (Woods & Thompson, 2006), would be energetic enough to disrupt a disk like this, although the details of that process are difficult (also see Wachter et al. 2008), but we stress that our mass estimate is an upper limit, and at the low end of the allowed mass range the disk would not be bound. Again, this could indicate either a problem with the disk model, or that objects with disks cannot have had large flares.
Among magnetars, the correlated near-IR and X-ray variability found by Tam et al. (2004) for 1E 2259+586 is unique. Such a correlation is a natural (but not necessarily unique) consequence of the disk model: a change in the X-ray flux would produce an accompanying change in the infrared flux from the disk, and while the total reprocessed flux is a constant fraction of the X-ray flux, the IR flux at a given wavelength can change faster or slower as annuli of a given temperature move and change area (cf. van Paradijs & McClintock, 1994). We find that the flux increases seen by Tam et al. (2004), which were of comparable amplitude to the X-ray flux increases, are roughly consistent with a disk like that considered here, although this assumes that 100% of the flux comes from the disk and ignores the possibility of physical changes to the disk such as movement of the inner radius following the flux changes. However, correlated changes were not seen in 4U 0142+61 (Durant & van Kerkwijk, 2006c), who instead saw relatively rapid, significant changes at without any changes in X-rays. Any model must be able to accommodate this wide range in behavior (see Wang & Kaspi 2008). Additional observations at longer wavelengths where the decomposition is less ambiguous could again provide important constraints.
References
- Beckwith et al. (1990) Beckwith, S. V. W., Sargent, A. I., Chini, R. S., & Guesten, R. 1990, AJ, 99, 924
- Beloborodov & Thompson (2007) Beloborodov, A. M. & Thompson, C. 2007, ApJ, 657, 967
- Chatterjee et al. (2000) Chatterjee, P., Hernquist, L., & Narayan, R. 2000, ApJ, 534, 373
- Chevalier (1989) Chevalier, R. A. 1989, ApJ, 346, 847
- Cox (2000) Cox, A. N. 2000, Allen’s Astrophysical Quantities, 4th edn. (New York: AIP Press/Springer)
- Dhillon et al. (2005) Dhillon, V. S., Marsh, T. R., Hulleman, F., van Kerkwijk, M. H., Shearer, A., Littlefair, S. P., Gavriil, F. P., & Kaspi, V. M. 2005, MNRAS, 363, 609
- Durant & van Kerkwijk (2005) Durant, M. & van Kerkwijk, M. H. 2005, ApJ, 627, 376
- Durant & van Kerkwijk (2006a) —. 2006a, ApJ, 650, 1070
- Durant & van Kerkwijk (2006b) —. 2006b, ApJ, 650, 1082
- Durant & van Kerkwijk (2006c) —. 2006c, ApJ, 652, 576
- Durant & van Kerkwijk (2006d) —. 2006d, ApJ, 648, 534
- Eichler et al. (2002) Eichler, D., Gedalin, M., & Lyubarsky, Y. 2002, ApJ, 578, L121
- Ertan & Cheng (2004) Ertan, Ü. & Cheng, K. S. 2004, ApJ, 605, 840
- Ertan et al. (2007) Ertan, Ü., Erkut, M. H., Ekşi, K. Y., & Alpar, M. A. 2007, ApJ, 657, 441
- Fahlman & Gregory (1981) Fahlman, G. G. & Gregory, P. C. 1981, Nature, 293, 202
- Fazio et al. (2004) Fazio, G. G. et al. 2004, ApJS, 154, 10
- Gavriil & Kaspi (2002) Gavriil, F. P. & Kaspi, V. M. 2002, ApJ, 567, 1067
- Heyl & Hernquist (2005) Heyl, J. S. & Hernquist, L. 2005, MNRAS, 362, 777
- Hodapp et al. (2003) Hodapp, K. W., et al. 2003, PASP, 115, 1388
- Hulleman et al. (2001) Hulleman, F., Tennant, A. F., van Kerkwijk, M. H., Kulkarni, S. R., Kouveliotou, C., & Patel, S. K. 2001, ApJ, 563, L49
- Hulleman et al. (2000) Hulleman, F., van Kerkwijk, M. H., & Kulkarni, S. R. 2000, Nature, 408, 689
- Hulleman et al. (2004) —. 2004, A&A, 416, 1037
- Indebetouw et al. (2005) Indebetouw, R., et al. 2005, ApJ, 619, 931
- Kaspi & Gavriil (2002) Kaspi, V. M. & Gavriil, F. P. 2002, IAU Circ., 7924, 3
- Kaspi et al. (2003) Kaspi, V. M., Gavriil, F. P., Woods, P. M., Jensen, J. B., Roberts, M. S. E., & Chakrabarty, D. 2003, ApJ, 588, L93
- Kern & Martin (2002) Kern, B. & Martin, C. 2002, Nature, 417, 527
- Kothes et al. (2002) Kothes, R., Uyaniker, B., & Yar, A. 2002, ApJ, 576, 169
- Kurucz (1993) Kurucz, R. 1993, ATLAS9 Stellar Atmosphere Programs and 2 km/s grid. Kurucz CD-ROM No. 13. Cambridge, Mass.: Smithsonian Astrophysical Observatory, 1993., 13
- Lin et al. (1991) Lin, D. N. C., Woosley, S. E., & Bodenheimer, P. H. 1991, Nature, 353, 827
- Löhmer et al. (2004) Löhmer, O., Wolszczan, A., & Wielebinski, R. 2004, A&A, 425, 763
- Lu & Zhang (2004) Lu, Y. & Zhang, S. N. 2004, MNRAS, 354, 1201
- Matsuoka et al. (1984) Matsuoka, M., et al. 1984, ApJ, 283, 774
- Morii et al. (2009) Morii, M., Kobayashi, N., Kawai, N., Terada, H., Tanaka, Y. T., Kitamoto, S., & Shibazaki, N. 2009, PASJ, 61, 51
- Muench et al. (2007) Muench, A. A., Lada, C. J., Luhman, K. L., Muzerolle, J., & Young, E. 2007, AJ, 134, 411
- Patel et al. (2001) Patel, S. K., et al. 2001, ApJ, 563, L45
- Patten et al. (2006) Patten, B. M., et al. 2006, ApJ, 651, 502
- Perna et al. (2000) Perna, R., Hernquist, L., & Narayan, R. 2000, ApJ, 541, 344
- Phinney & Hansen (1993) Phinney, E. S. & Hansen, B. M. S. 1993, in Astronomical Society of the Pacific Conference Series, Vol. 36, Planets Around Pulsars, ed. J. A. Phillips, S. E. Thorsett, & S. R. Kulkarni, 371
- Podsiadlowski (1993) Podsiadlowski, P. 1993, in Astronomical Society of the Pacific Conference Series, Vol. 36, Planets Around Pulsars, ed. J. A. Phillips, S. E. Thorsett, & S. R. Kulkarni, 149
- Sasaki et al. (2004) Sasaki, M., Plucinsky, P. P., Gaetz, T. J., Smith, R. K., Edgar, R. J., & Slane, P. O. 2004, ApJ, 617, 322
- Skrutskie et al. (2006) Skrutskie, M. F., et al. 2006, AJ, 131, 1163
- Tam et al. (2004) Tam, C. R., Kaspi, V. M., van Kerkwijk, M. H., & Durant, M. 2004, ApJ, 617, L53
- Temim et al. (2006) Temim, T., et al. 2006, AJ, 132, 1610
- Uzpen et al. (2007) Uzpen, B., et al. 2007, ApJ, 658, 1264
- van Paradijs & McClintock (1994) van Paradijs, J. & McClintock, J. E. 1994, A&A, 290, 133
- Vrtilek et al. (1990) Vrtilek, S. D., Raymond, J. C., Garcia, M. R., Verbunt, F., Hasinger, G., & Kurster, M. 1990, A&A, 235, 162
- Wachter et al. (2008) Wachter, S., Ramirez-Ruiz, E., Dwarkadas, V. V., Kouveliotou, C., Granot, J., Patel, S. K., & Figer, D. 2008, Nature, 453, 626
- Wang et al. (2008a) Wang, Z., Bassa, C., Kaspi, V. M., Bryant, J. J., & Morrell, N. 2008a, ApJ, 679, 1443
- Wang et al. (2006) Wang, Z., Chakrabarty, D., & Kaplan, D. L. 2006, Nature, 440, 772
- Wang et al. (2008b) Wang, Z., Chakrabarty, D., & Kaplan, D. L. 2008b, in American Institute of Physics Conference Series, Vol. 983, 40 Years of Pulsars: Millisecond Pulsars, Magnetars and More, ed. C. G. Bassa, Z. Wang, A. Cumming, & V. M. Kaspi (New York: AIP), 274
- Wang & Kaspi (2008) Wang, Z. & Kaspi, V. M. 2008, ApJ, 675, 695
- Wang et al. (2007) Wang, Z., Kaspi, V. M., & Higdon, S. J. U. 2007, ApJ, 665, 1292
- Werner et al. (2004) Werner, M. W. et al. 2004, ApJS, 154, 1
- Woods & Thompson (2006) Woods, P. M. & Thompson, C. 2006, in Compact Stellar X-ray Sources, ed. W. Lewin & M. van der Klis (Cambridge, UK: Cambridge University Press), 547
- Woosley & Weaver (1995) Woosley, S. E. & Weaver, T. A. 1995, ApJS, 101, 181
- Zhu et al. (2008) Zhu, W., Kaspi, V. M., Dib, R., Woods, P. M., Gavriil, F. P., & Archibald, A. M. 2008, ApJ, 686, 520