Diffuse molecular gas at high redshift ††thanks: Based on observations carried out with the Ultraviolet and Visual Echelle Spectrograph, mounted on the ESO Very Large Telescope, under Prgm. ID. 081.A-0334(B).
We present the detection of carbon monoxide molecules (CO) at towards the quasar SDSS J160457.50220300.5 using the Very Large Telescope Ultraviolet and Visual Echelle Spectrograph. CO absorption is detected in at least two components in the first six A-X bands and one d-X(5-0) inter-band system. This is the second detection of this kind along a quasar line of sight. The CO absorption profiles are well modelled assuming a rotational excitation of CO in the range 6 16 K, which is consistent with or higher than the temperature of the Cosmic Microwave Background Radiation at this redshift. We derive a total CO column density of CO. The measured column densities of S i, Mg i, Zn ii, Fe ii and Si ii indicate a dust depletion pattern typical of cold gas in the Galactic disc. The background quasar spectrum is significantly reddened (uK mag) and presents a pronounced 2175 Å dust absorption feature at the redshift of the CO absorber. Using a control sample of 500 quasars we find the chance probability for this feature to be spurious is 0.3%. We show that the spectral energy distribution (SED) of the quasar is well fitted with a QSO composite spectrum reddened with a Large Magellanic Cloud supershell extinction law at the redshift of the absorber. It is noticeable that this quasar is absent from the colour-selected SDSS quasar sample. This demonstrates our current view of the Universe may be biased against dusty sightlines. These direct observations of carbonaceous molecules and dust open up the possibility of studying physical conditions and chemistry of diffuse molecular gas in high redshift galaxies.
Key Words.:
cosmology:observations - galaxies: ISM - quasars: absorption lines - quasars: individual: SDSS J160457.50$+$220300.51 Introduction
Quasar absorption lines provide a powerful tool to detect and study gaseous baryonic matter at all redshifts in a luminosity-unbiased way. Large column densities of neutral gas are revealed by the damped Lyman- absorption lines they imprint in the spectrum of background quasars. Because of the large neutral hydrogen column densities (), similar to what is observed along Galactic lines of sight, and the presence of metals at different levels of chemical enrichment (e.g. Pettini et al., 1997; Prochaska & Wolfe, 2002), it is believed that a large fraction of Damped Lyman- systems (DLAs) are located close to regions of star formation at high redshift (see, e.g. Wolfe et al., 2005, for a review on the subject).
The typical dust-to-gas ratio in DLAs, is generally less than one tenth of what is observed in the local interstellar medium (ISM) and only a small fraction (10-15%) of them show detectable amounts of molecular hydrogen (Ledoux et al., 2003; Noterdaeme et al., 2008a). Even in these cases, the molecular fractions are small compared to what is seen in the Galactic ISM. It is therefore likely that most of the DLAs probe only diffuse neutral gas (Petitjean et al., 2000). In contrast, the detection of the cold ( K), dusty and molecular gas, a fundamental ingredient for star-formation, is elusive till now in absorption studies. The corresponding regions could have been missed so far due to the large extinction they are expected to produce. It could also be that molecular gas escapes detection because of its very small cross section (Zwaan & Prochaska, 2006).
Gamma Ray Bursts (GRBs) are thought to be located in star forming regions, and the associated absorptions are therefore more likely to arise from the densest part of the ISM at high redshift. However, the physical state of the absorbing gas is very likely to be influenced by the intense UV radiation field arising from the GRB itself (e.g. Vreeswijk et al., 2007). This could explain the absence of H2 in the majority of GRB-DLAs (Tumlinson et al., 2007). However, only a handful of GRB-DLAs have been studied so far and existing data are still consistent with the statistics of H2 detections in intervening QSO-DLA samples (Ledoux et al. 2009, submitted). When molecules are seen (Prochaska et al., 2009), their excitation is observed to be high, indicating strong UV pumping from the GRB afterglow.
We have started a programme to search for cold gas along QSO lines of sight. The huge number of quasar spectra available in the Sloan Digital Sky Survey (SDSS) and the faint magnitude limit achieved by the survey allows us to identify absorption systems having unique characteristics. In particular the systems can be selected on the basis of the presence of C i which should flag predominantly cold neutral gas. We searched for strong ( Å) C i absorbers at along the line of sight of 40 000 QSOs from the SDSS Data Release 7.
The selection lead to the first detection of carbon monoxide (CO) absorption lines at (Srianand et al., 2008b). Similarly, selection of strong Mg ii systems at intermediate redshift lead to the detection of the 2175 Å feature and 21-cm absorption in two Mg ii systems (Srianand et al., 2008a). Till now, direct signatures of dust at , such as the UV bump or diffuse interstellar bands (DIBs) have only been reported in a small number of cases (e.g., Motta et al., 2002; Wucknitz et al., 2003; Ellison et al., 2008; Liang & Li, 2009).
In this paper we present the simultaneous detection of carbon monoxide absorption lines and 2175 Å dust feature in an intervening absorber at towards SDSS J160457220300. We present high spectral resolution observations in Sect. 2, the metal content of the system in Sect. 3 and the analysis of molecular lines in Sect. 4. We discuss the extinction and presence of a UV bump in Sect. 5. Finally, we conclude in Sect. 6.
2 Observations
The quasar SDSS J160457.50220300.5 () was observed with the Ultraviolet and Visual Echelle Spectrograph (UVES; Dekker et al., 2000) in visitor mode on June 28, 29, and 30, 2008. The total exposure time on source is 29 400 s. Both UVES spectrographic arms were used simultaneously taking advantage of a dichroic setting with central wavelengths of 390 nm in the blue and 564 nm in the red. The resulting wavelength coverage is 329-451 nm and 462-665 nm with a gap between 559 and 568 nm corresponding to the physical gap between the two red CCDs. The CCD pixels were binned and the slit width adjusted to 1 to match the ambient seeing conditions. This yielded a resolving power of R = 47 500 in the blue and R = 45 000 in the red as measured from Th-Ar lines from the calibration lamp. The data were reduced using the MIDAS-based UVES pipeline v 2.9.7, which performs an accurate tracking of the object while subtracting the sky spectrum at the same time. Cosmic ray impacts and CCD defects were rejected iteratively. Wavelengths were rebinned to the vacuum-heliocentric rest frame and individual exposures were co-added using a sliding windows and weighting the signal by the signal-to-noise ratio in each pixel. We analysed the spectrum using standard Voigt-profile fitting techniques. Oscillator strengths and wavelengths of CO absorption lines were taken from Morton & Noreau (1994) with updated values from Eidelsberg & Rostas (2003) for the inter-band systems. Heavy element abundances are given relative to solar (Grevesse et al., 2007), with [X/HXH (X/H)⊙ and assuming H. For short reference through the paper, we refer to SDSS J160457.50220300.5 as Q 16042203.
3 Metal content
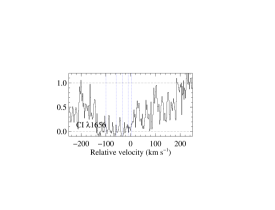
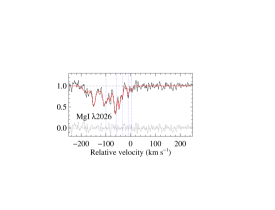
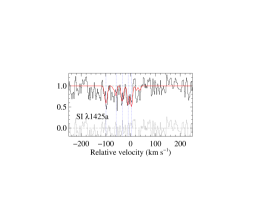
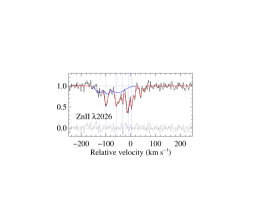
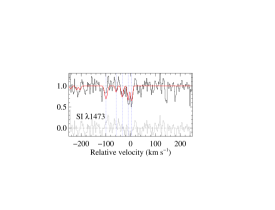
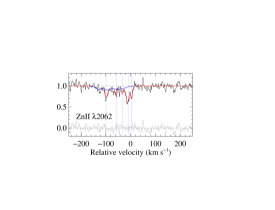
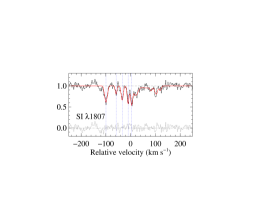
Absorption lines from singly ionised metals (Fe ii, Si ii, and Zn ii) as well as neutral species (S i, Mg i, and C i) are detected around over 200 (see Fig. 1). The covered absorption lines of neutral species are exceptionally strong, with C i 1560,1656 being heavily saturated and S i clearly detected in several transitions. Note that S i is rarely seen in QSO absorbing systems (Quast et al., 2008; Srianand et al., 2008b). Fe i is not detected down to for each component (3 upper limit). We performed simultaneous multicomponent Voigt-profile fits with fitlyman (Fontana & Ballester, 1995) to constrain redshifts, Doppler parameters and column densities, see Table 1. Five narrow components are required to fit the neutral species (S i and Mg i). The profiles of singly ionised species (Zn ii, Si ii and Fe ii) require additional broad components.
While the narrow components can still be seen in the profiles of Zn ii transitions, the presence of additional broad components introduces a degeneracy in the results in particular the relative column densities in the narrow and broad components. We have somewhat artificially associated the broad and narrow components so that one could consider the sum of the column densities in the broad () and narrow () components to be representative of the column density in the six components listed in Table 1. Indeed, narrow components can be completely lost into the broad ones as it is the case for Fe ii and Si ii. However, because lines are in the optically-thin regime, integrated column densities will not depend upon the actual number of components. The above decomposition shows that the coldest gas, as traced by the S i components, is found in clumps embedded in a more turbulent and probably warmer phase. This structure is natural (see e.g. Petitjean et al., 1992) and is usually observed in the H2 phase of DLAs (Ledoux et al., 2002).
The immediate consequence of this is that the depletion factor estimated from integrated column densities may not be a correct representation of the actual depletion factors in individual components.
Using the integrated column densities (Table 1) and upper limits of different ions ( and at 3 c.l., for the whole profile) we find, [Fe/Zn] , [Si/Zn] , [Ni/Zn] and [Cr/Zn] . This is consistent with the depletion pattern seen in the cold neutral medium of the Galactic ISM and that of the Large Magellanic Cloud (see Welty et al., 1999).
From the equivalent width of C i 1280, which is the weakest C i line available we derive , in the linear regime limit. However, even this line is saturated, and filling the C i profiles with five components with the same parameters – Doppler parameters and redshifts – as the S i components gives which is still a lower-limit. Therefore, this system has by far the highest column densities of C i and S i known in any QSO absorption system.
 |
 |
 |
 |
 |
 |
 |
 |
 |
 |
 |
 |
| Comp.a | () | () | ||||||
|---|---|---|---|---|---|---|---|---|
| Zn ii | Fe ii | Si ii | Mg i | S i | CO | |||
| 1B | 1.63967 | 17.8 0.8 | 12.31 0.03 | 13.73 0.02 | ||||
| 2N | 1.63992 | 6.3 0.4 | 12.34 0.05 | 12.85 0.04 | 13.18 0.02 | 13.64 | ||
| 2B | 1.63996 | 11.4 0.3 | 12.09 0.11 | 14.10 0.01 | 14.72 0.03 | |||
| 3N | 1.64028 | 2.8 0.6 | 12.07 0.04 | 12.64 0.05 | 13.28 | |||
| 3B | 1.64034 | 37.6 1.4 | 12.67 0.04 | 14.00 0.02 | 14.52 0.09 | |||
| 4N | 1.64080 | 4.5 0.4 | 12.06 0.05 | 13.29 0.04 | 13.96 0.13 | 12.73 0.03 | 13.01 0.02 | 13.80 |
| 5N | 1.64069 | 6.8 0.3 | 12.70 0.03 | 14.08 0.01 | 14.45 0.05 | |||
| 1.64071 | 3.6 0.4 | 12.66 0.04 | 13.10 0.02 | 14.24 0.20 | ||||
| 6N | 1.64083 | 3.9 0.3 | 12.42 0.02 | 13.67 0.02 | 14.02 0.10 | 12.33 0.07 | 13.13 0.02 | 14.34 0.10 |
| total | 13.30 0.02 | 14.67 0.01 | 15.13 0.03 | 13.28 0.02 | 13.75 0.01 | 14.59 0.11 b | ||
a Narrow components () are indicated by “N” while “B” stands for broad component ().
b Total CO measured from comp. 5 and 6 only. Undetected components (2N, 3N and 4N)
could increase this value by up to 0.1 dex (see text).
4 Carbon monoxide
Carbon monoxide absorption lines are detected in several A-X bands and the d-X (5-0) inter-band system.
 |
 |
 |
 |
 |
 |
Following Burgh et al. (2007), we use the excitation temperature as an external parameter. We fitted the CO profile using a IDL code based on MPFIT (Markwardt, 2009), which performs -minimisation by Levenberg-Marquardt technique. Components associated to the reddest S i components, at and 1.64083, are clearly detected in the and rotational levels (see Fig. 2). The S/N ratio of the data is not high enough so that an independent fit can be performed. In addition, lines from different rotational levels are blended. We therefore fixed the redshifts and Doppler parameters to those obtained from S i. We varied only the total CO column density for each of the two components, distributed among rotational levels up to , using a single excitation temperature .
If we assume the excitation of CO is due to the Cosmic Microwave Background Radiation alone, i.e. , then the best fit model is achieved with for a total column density CO. The model is superimposed on the observed spectrum in Fig. 2.
and are expected to be equal for low gas pressure (Srianand et al., 2008b) and in the absence of UV pumping. Excitation by photon trapping becomes significant only when (CO) (Burgh et al., 2007). Unfortunately, unlike in the case of the CO-bearing system towards SDSS J143912$+$111740, all observed neutral carbon lines are saturated and it is therefore impossible to estimate the pressure of the gas from the population of C i fine-structure levels. We fitted different models along a grid of excitation temperatures and Doppler parameters. A good fit () is achieved for a CO excitation temperature equals to or larger than the CMBR temperature and for . We find K at the 5 confidence level.
Assuming a single excitation temperature for all rotational levels could be considered a rough assumption. However, is generally found constant for in diffuse molecular gas in the local Universe (Sheffer et al., 2008). Moreover, most of the optical depth of the CO profile is due to absorptions from and . Actually, a two rotational levels model gives the same results. We checked that the total CO column density only varies by less than 0.10 dex regardless of the and values as long as the condition is fulfilled. The decomposition between the different components is quite uncertain however.
CO could be also present in the three bluest S i components, although not detected directly at the 3 level. Because these components are far enough from the two detected CO components, they have very little influence on the excitation temperature. However, they could contribute to increase the overall CO column density (over the range to 50 ) by 0.1 dex.
From the lower limit on we derive CO which is typical of what is measured in the diffuse molecular medium (Federman et al., 1980).
5 Dust and 2175 Å UV bump
The presence of dust grains influences the physical state of the gas through photo-electric heating, UV shielding, and formation of molecules on the surface of grains. It can be deduced from the depletion pattern of different elements (see Sect. 3) and/or from the reddening of the background QSO.
The spectral energy distribution (SED) of Q 16042203 is very red with u-K4.5 mag. We note this value is only indicative as u (SDSS) and K (2MASS) magnitudes were measured with 4 years interval and the exact u-K value could be different due to quasar optical variability. The flux-calibrated SDSS spectrum of Q 16042203 is visibly affected by reddening and also shows a clear curvature around 2175 Å in the rest frame of the absorbing system (see Fig. 3). We investigate the possibility that the red colour of the quasar is due to the presence of dust in the CO-bearing system.
We performed a -minimisation between the data and a SDSS composite spectrum (Vanden Berk et al., 2001) reddened by different types of extinction curves, namely that from the Small Magellanic Cloud (SMC), Large Magellanic Cloud Supershell (LMC2), Large Magellanic cloud (LMC) and the Galaxy (MW) (Gordon et al., 2003). The strength of the 2175 Å bump is very different from one extinction curve to the other: while the UV bump is absent in the SMC extinction curve it is strongest in the MW and LMC extinction curves. In addition, the SMC extinction curve has a large UV extinction at compared to the LMC and MW extinction curves. The average extinction curve of the LMC supershell (LMC2), which is part of the 30 Dor star forming region, has a bump strength and a UV extinction in-between the two extremes.
Results of our best fit models using different extinction curves are presented in Table 2. A detailed description of the procedure can be found in Srianand et al. (2008a). The best reduced value is reached for the LMC2 Supershell dust extinction curve with E(B-V) = 0.270.02 for = 2.7.

| Extinction law | E(B-V) | ||
|---|---|---|---|
| MW | 3.1 | 3.0 | |
| LMC | 3.4 | 1.6 | |
| LMC2 | 2.7 | 1.2 | |
| SMC | 2.7 | 2.1 |
We performed a test on a sample of SDSS spectra to rule out the possibility that a peculiar intrinsic spectral shape is mistaken for a 2175 Å bump (Pitman et al., 2000). Our control sample consists of all 529 SDSS quasars with emission redshift within = of that of Q 16042203 (). The distribution of S/N ratios of the spectra111Median signal-to-noise ratio in the i-band (SN_I) provided by SDSS together with the 1D spectra (spSpec*.fit) is shown in the upper right panel of Fig. 4. We fitted all quasar spectra using the SDSS composite spectrum reddened by a SMC extinction curve shifted to , which does not present any UV bump. Using minimisation we estimated, for each quasar, E(B-V) and the strength of a possible 2175 Å feature. The latter is calculated as the integrated flux difference between the fitted composite spectrum and the observed QSO spectrum in the region where the 2175 Å bump is redshifted (i.e. over the observed wavelength range, ). We parametrised this quantity by . A plot of versus E(B-V) together with the distributions of the two parameters is presented in Fig. 4. The positions of Q 16042203 in these graphs are indicated by arrows.
As expected, QSOs with bad signal-to-noise ratio spectra (i.e. S/N 10, open squares in the plots) are responsible for most of the scatter and a tail in the distribution. Therefore, better confidence is achieved when selecting only high signal-to-noise spectra (i.e S/N 10). Note Q 16042203 has S/N = 14.7. From the scatter plot E(B-V) versus , it can be seen that the maximum deviation on both axis is seen for Q 16042203. The probability of getting E(B-V) is as low as 0.7% when we consider only the high S/N () spectra. This corresponds to a 4.7 significance if we approximate the E(B-V) distribution for spectra of S/N 10 by a Gaussian function of mean zero and standard deviation 0.035.
There is only one quasar (SDSS J131903$+$431034) in the high S/N control sample with large E(B-V) in addition to Q 16042203. Interestingly, two strong Mg ii systems are present in the spectrum of this QSO. Selecting quasar with red colours could therefore serve as a direct way to search for dusty intervening absorbers. Concerning the 2175 Å absorption itself, only one quasar (the one presented here) has . The corresponding probability is thus . The mean is zero with a 1 dispersion of 0.035. So if we assume that the distribution for spectra with S/N is well modelled by a Gaussian distribution, the confidence level on the UV bump detection is 4.3 . The joint probability of measuring E(B-V) 0.15 and by pure chance coincidence is %. In short, the exercise presented above rules out the possibility of the 2175 Å structure being spurious at very high confidence level.
It is possible to estimate from the reddening of the quasar, assuming the average LMC supershell relation between the column density of neutral gas and the extinction (Gordon et al., 2003):
| (1) |
where , and = 2.760.09 is the average value for the LMC2 supershell.
We then get . We can estimate a lower limit on (H i) using the largest value of = 3.7610-22 mag/(H cm-2) measured in the LMC2 by Dobashi et al. (2008), . We note that using E(B-V) values obtained with different extinction laws (Table 2) and the corresponding ratios provide very similar results. It would be very interesting to obtain a direct measurement of . However, the faintness of the quasar in the blue would make any determination with UVES very difficult.

6 Discussion
We have reported the detection of diffuse molecular gas at towards SDSS J160457.50220300.5, following careful selection of the target among several thousand quasars from the SDSS.
High spectral resolution observations with the Ultraviolet and Visual Echelle Spectrograph reveal the presence of CO molecules in the absorbing gas. This is only the second such detection in an intervening DLA along a quasar line of sight. From modelling the CO absorption with a multiple Voigt-profile pattern, we measure the CO column density to be (CO) and an excitation temperature of the molecules, K at the 5 c.l., consistent with or higher than the expected temperature of the CMBR, K at .
The observed SED of the quasar is well reproduced if dust reddening happens in the CO absorber with an extinction law corresponding to that observed in the LMC2 supershell including a 2175 Å UV bump. We derive significant reddening (E(B-V)=0.27) and a depletion pattern similar to what is seen in the diffuse molecular medium of the local interstellar medium.
Statistical studies have shown that DLAs as an overall population are not producing significant reddening of the background quasar, with E(B-V) less than about 0.04 mag (Murphy & Liske, 2004; Ellison et al., 2005). Moreover, Vladilo et al. (2008) found a low mean extinction-to-gas ratio in DLAs (H i)2-4 mag cm2 in the SDSS-DR5. In addition, while strong Ca ii absorbers seem to contain larger amounts of dust, they still produce only moderate reddening of the background quasar (E(B-V) ; Wild et al., 2006). Significant reddening, similar to that derived here, has only been found to date for a few individual absorption systems at low and intermediate redshift. Junkkarinen et al. (2004) report E(B-V) = 0.23 for the peculiar absorber at towards AO 0235164 which also exhibits a 2175 Å bump at the same redshift. E(B-V) = 0.16 but no UV bump has been found toward SDSS J13230021 in a high-metallicity sub-DLA at (Khare et al., 2004). Ellison et al. (2008) detected DIBs in a Ca ii absorber at towards a reddened quasar with E(B-V) = 0.23. More recently, Srianand et al. (2008a) measured E(B-V) about 0.3 and detected 2175 Å dust features in two 21-cm absorbers.
It is interesting to note that the depletion pattern of the present system is similar to what has been observed in the DLA towards SDSS J143912111740 where CO is also detected (Srianand et al., 2008b). The present system has CO and S i column densities six times larger than in the previous system when integrated column densities of Zn ii, Si ii and Fe ii are only twice larger (Noterdaeme et al., 2008b) .
The colours of Q 16042203 make this object laying out of the quasar locus used by SDSS to select spectroscopic targets (Richards et al., 2002). More specifically, the object was flagged as TARGET_QSO_REJECT upon its colours and serendipitously assigned an excess spectroscopic fibre left over after the main samples of galaxies, LRGs, and quasars had been tiled (Stoughton et al., 2002). We also note that this object is absent from the photometric catalogue of quasars in SDSS-DR6 (Richards et al., 2009). Similarly, the dusty absorber at towards SDSS J085244$+$343540 (Srianand et al., 2008a), is also absent from this catalogue and selected as SDSS spectroscopic target only because the background quasar is radio-loud. This once again reiterates the fact that lines of sight towards colour-selected quasars are probably biased against the detection of the most relevant component of the interstellar medium, i.e., the diffuse molecular and translucent lines of sight.
It has been four decades since the first detections of the 2175 Å extinction feature in the spectra of hot stars (Stecher, 1965). While it seems now clear that the presence of this bump is related to that of small dust grains, the composition of these latter remains debated. Theoretical and experimental studies have shown that carbon-rich organic grains and polycyclic aromatic hydrocarbons (PAHs) are the most likely carriers of the 2175 Å feature. Amorphous silicates, abundant in interplanetary dust particles could also contribute to the bump (Bradley et al., 2005).
The absence of UV bump in SMC lines-of-sight and in most star-burst galaxies lead Gordon et al. (1997) to propose a trend in dust properties with star formation intensity. Indeed, the UV bump carriers could be extremely sensitive to the local chemical enrichment and to the energy input in the gas (e.g. Whittet, 2003; Gordon et al., 2003; Noll et al., 2007). This is supported by theoretical work in the case of PAH clusters (Rapacioli et al., 2006) and could explain why such feature is absent in the environment of most gamma-ray bursts (see however Elíasdóttir et al., 2009; Liang & Li, 2009) and Lyman break galaxies (Vijh et al., 2003), and only present when the dust is shielded enough from the incident UV radiation.
An efficient shielding of the UV radiation field together with large metal abundances may thus be necessary for the presence of small carbon-rich grains (see also Sloan et al., 2008). These are the best conditions to efficiently form molecules (e.g. Ledoux et al., 2003; Srianand et al., 2005; Petitjean et al., 2006; Noterdaeme et al., 2008a), and in particular CO.
The observations reported here demonstrate that carbonaceous molecules and grains already exist at . This opens the exciting prospects of studying organic chemistry at high redshift.
Acknowledgements.
We are grateful to the anonymous referee for insightful comments and suggestions. PN acknowledges support from the french Ministry of Foreign and European Affairs. SL was supported by FONDECYT grant N. We acknowledge the use of the Sloan Digital Sky Survey database (http://www.sdss.org).References
- Bradley et al. (2005) Bradley, J., Dai, Z. R., Erni, R., et al. 2005, Science, 307, 244
- Burgh et al. (2007) Burgh, E. B., France, K., & McCandliss, S. R. 2007, ApJ, 658, 446
- Dekker et al. (2000) Dekker, H., D’Odorico, S., Kaufer, A., Delabre, B., & Kotzlowski, H. 2000, in Proc. SPIE Vol. 4008, p. 534-545, Optical and IR Telescope Instrumentation and Detectors, Masanori Iye; Alan F. Moorwood; Eds., 534–545
- Dobashi et al. (2008) Dobashi, K., Bernard, J.-P., Hughes, A., et al. 2008, A&A, 484, 205
- Eidelsberg & Rostas (2003) Eidelsberg, M. & Rostas, F. 2003, ApJS, 145, 89
- Elíasdóttir et al. (2009) Elíasdóttir, Á., Fynbo, J. P. U., Hjorth, J., et al. 2009, ApJ, 697, 1725
- Ellison et al. (2005) Ellison, S. L., Hall, P. B., & Lira, P. 2005, AJ, 130, 1345
- Ellison et al. (2008) Ellison, S. L., York, B. A., Murphy, M. T., et al. 2008, MNRAS, 383, L30
- Federman et al. (1980) Federman, S. R., Glassgold, A. E., Jenkins, E. B., & Shaya, E. J. 1980, ApJ, 242, 545
- Fontana & Ballester (1995) Fontana, A. & Ballester, P. 1995, The Messenger, 80, 37
- Gordon et al. (1997) Gordon, K. D., Calzetti, D., & Witt, A. N. 1997, ApJ, 487, 625
- Gordon et al. (2003) Gordon, K. D., Clayton, G. C., Misselt, K. A., Landolt, A. U., & Wolff, M. J. 2003, ApJ, 594, 279
- Grevesse et al. (2007) Grevesse, N., Asplund, M., & Sauval, A. J. 2007, Space Science Reviews, 130, 105
- Junkkarinen et al. (2004) Junkkarinen, V. T., Cohen, R. D., Beaver, E. A., et al. 2004, ApJ, 614, 658
- Khare et al. (2004) Khare, P., Kulkarni, V. P., Lauroesch, J. T., et al. 2004, ApJ, 616, 86
- Ledoux et al. (2003) Ledoux, C., Petitjean, P., & Srianand, R. 2003, MNRAS, 346, 209
- Ledoux et al. (2002) Ledoux, C., Srianand, R., & Petitjean, P. 2002, A&A, 392, 781
- Liang & Li (2009) Liang, S. L. & Li, A. 2009, ApJ, 690, L56
- Markwardt (2009) Markwardt, C. B. 2009, ArXiv e-prints 0902.2850
- Morton & Noreau (1994) Morton, D. C. & Noreau, L. 1994, ApJS, 95, 301
- Motta et al. (2002) Motta, V., Mediavilla, E., Muñoz, J. A., et al. 2002, ApJ, 574, 719
- Murphy & Liske (2004) Murphy, M. T. & Liske, J. 2004, MNRAS, 354, L31
- Noll et al. (2007) Noll, S., Pierini, D., Pannella, M., & Savaglio, S. 2007, A&A, 472, 455
- Noterdaeme et al. (2008a) Noterdaeme, P., Ledoux, C., Petitjean, P., & Srianand, R. 2008a, A&A, 481, 327
- Noterdaeme et al. (2008b) Noterdaeme, P., Petitjean, P., Ledoux, C., Srianand, R., & Ivanchik, A. 2008b, A&A, 491, 397
- Petitjean et al. (1992) Petitjean, P., Bergeron, J., & Puget, J. L. 1992, A&A, 265, 375
- Petitjean et al. (2006) Petitjean, P., Ledoux, C., Noterdaeme, P., & Srianand, R. 2006, A&A, 456, L9
- Petitjean et al. (2000) Petitjean, P., Srianand, R., & Ledoux, C. 2000, A&A, 364, L26
- Pettini et al. (1997) Pettini, M., Smith, L. J., King, D. L., & Hunstead, R. W. 1997, ApJ, 486, 665
- Pitman et al. (2000) Pitman, K. M., Clayton, G. C., & Gordon, K. D. 2000, PASP, 112, 537
- Prochaska et al. (2009) Prochaska, J. X., Sheffer, Y., Perley, D. A., et al. 2009, ApJ, 691, L27
- Prochaska & Wolfe (2002) Prochaska, J. X. & Wolfe, A. M. 2002, ApJ, 566, 68
- Quast et al. (2008) Quast, R., Reimers, D., & Baade, R. 2008, A&A, 477, 443
- Rapacioli et al. (2006) Rapacioli, M., Calvo, F., Joblin, C., et al. 2006, A&A, 460, 519
- Richards et al. (2002) Richards, G. T., Fan, X., Newberg, H. J., et al. 2002, AJ, 123, 2945
- Richards et al. (2009) Richards, G. T., Myers, A. D., Gray, A. G., et al. 2009, ApJS, 180, 67
- Sheffer et al. (2008) Sheffer, Y., Rogers, M., Federman, S. R., et al. 2008, ApJ, 687, 1075
- Sloan et al. (2008) Sloan, G. C., Kraemer, K. E., Wood, P. R., et al. 2008, ApJ, 686, 1056
- Srianand et al. (2008a) Srianand, R., Gupta, N., Petitjean, P., Noterdaeme, P., & Saikia, D. J. 2008a, MNRAS, 391, L69
- Srianand et al. (2008b) Srianand, R., Noterdaeme, P., Ledoux, C., & Petitjean, P. 2008b, A&A, 482, L39
- Srianand et al. (2005) Srianand, R., Petitjean, P., Ledoux, C., Ferland, G., & Shaw, G. 2005, MNRAS, 362, 549
- Stecher (1965) Stecher, T. P. 1965, ApJ, 142, 1683
- Stoughton et al. (2002) Stoughton, C., Lupton, R. H., Bernardi, M., et al. 2002, AJ, 123, 485
- Tumlinson et al. (2007) Tumlinson, J., Prochaska, J. X., Chen, H.-W., Dessauges-Zavadsky, M., & Bloom, J. S. 2007, ApJ, 668, 667
- Vanden Berk et al. (2001) Vanden Berk, D. E., Richards, G. T., Bauer, A., et al. 2001, AJ, 122, 549
- Vijh et al. (2003) Vijh, U. P., Witt, A. N., & Gordon, K. D. 2003, ApJ, 587, 533
- Vladilo et al. (2008) Vladilo, G., Prochaska, J. X., & Wolfe, A. M. 2008, A&A, 478, 701
- Vreeswijk et al. (2007) Vreeswijk, P. M., Ledoux, C., Smette, A., et al. 2007, A&A, 468, 83
- Welty et al. (1999) Welty, D. E., Frisch, P. C., Sonneborn, G., & York, D. G. 1999, ApJ, 512, 636
- Whittet (2003) Whittet, D. C. B., ed. 2003, Dust in the galactic environment
- Wild et al. (2006) Wild, V., Hewett, P. C., & Pettini, M. 2006, MNRAS, 367, 211
- Wolfe et al. (2005) Wolfe, A. M., Gawiser, E., & Prochaska, J. X. 2005, ARA&A, 43, 861
- Wucknitz et al. (2003) Wucknitz, O., Wisotzki, L., Lopez, S., & Gregg, M. D. 2003, A&A, 405, 445
- Zwaan & Prochaska (2006) Zwaan, M. A. & Prochaska, J. X. 2006, ApJ, 643, 675