Microwave magnetoplasmon absorption by a 2DEG stripe.
Abstract
Microwave (MW) absorption by a high mobility 2DEG has been investigated experimentally using sensitive Electron Paramagnetic Resonance (EPR) cavity technique. It is found that MW absorption spectra are chiefly governed by confined magnetoplasmon excitations in a 2DEG stripe. Spectra of the 2D magnetoplasmons are studied as a function of magnetic field, MW frequency and carrier density. The electron concentration is tuned by illumination and monitored using optical photoluminescence technique.
I Introduction
Currently there is an increased interest in microwave (MW) properties of high-mobility two-dimensional electron gas (2DEG), partially, due to recent discovery of microwave induced resistance oscillations (MIROs) which under certain conditions may evolve into so called zero resistance states.Mani ; Zudov The microscopic physics of MIROs is still under debate. This phenomenon is observed in dc transport measurements and first attempts to observe MIRO-like effects in absorption/reflection experiments revealed very different behavior as compared to dc transport.IEEE This work is devoted to in-detail investigation of the MW absorption on a high mobility 2DEG stripe by using a sensitive EPR resonator technique. Several peaks are observed in the absorption spectra of the rectangular 2DEG sample. In order to confirm that these peaks originate from confined magneto-plasmon resonances, a careful study of the peaks is performed as a function of magnetic field, microwave frequency and electron concentration.
II Experiment
Two-dimensional electron gas was confined in a 20 nm wide GaAs/AlGaAs quantum well, similar to the one studied in ref.Nature . A rectangular stipe was cleaved from this sample to the dimensions of approximately 0.82. The electron density in dark was , and mobility was . After full illumination the electron concentration decreased to . An optical fiber was used to deliver He-Ne laser radiation into the cavity through a small hall in the plunger. Varying the illumination intensity, we were able to change 2DEG concentration gradually and simultaneously determine it from the analysis of the magneto-photoluminescence spectra.Moreau ; Moreau2
For the MW absorption measurements we employ an Electron Paramagnetic Resonance (EPR) spectrometer with a cylindric cavity tuned to the mode. The electric field component for this mode has curling geometry and lays in the -plane. The electric field has two zeros - in the center and at the cavity edge, and it reaches the maximum value at the middle of the cavity radius. In direction along the cavity height the electric field reaches maximum at the medium of the cavity height. A movable cylindrical plunger is used to tune the cavity resonance frequency in the range between 40 and 60 by adjusting the cavity height between 3 and 8 . Modulation of the external magnetic field in combination with a lock-in detection technique allows us to improve sensitivity to small signals and increase signal to noise ratio. A detailed description of the EPR spectrometer setup can be found in Refs.Seck ; Seck2 .
The rectangular 2DEG sample is placed at the bottom of the cylindric cavity along the radius so that the external magnetic field is normal to the 2DEG plane, and the MW electric field component of mode lays in the 2DEG plane and is directed along the short side of the rectangular. This geometry is preferable for excitation of confined plasmons across the bar. In this work we position our sample in the ”face down” configuration in which the active 2DEG layer is in in close proximity to the plunger plate and, therefore, the coupling of conduction electrons to the MW cavity is minimized and produces minimum distortion of the cavity resonance.
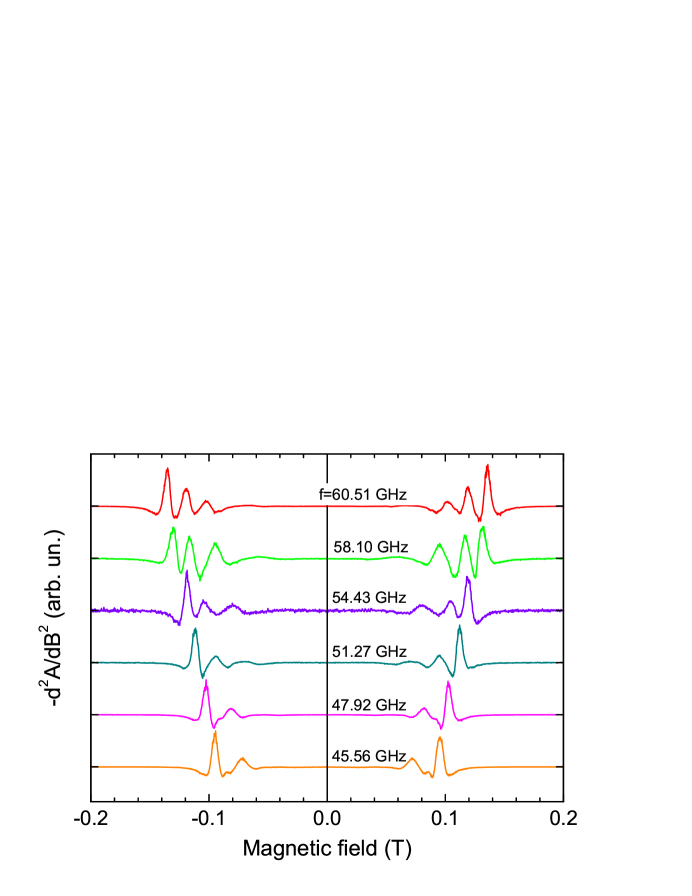
Figure 1 shows experimental traces of the second derivative of the microwave absorption in respect to the magnetic field for both direction of magnetic field. This experiment is performed at liquid helium temperature for different MW frequencies. It is known that the maximum positions of the second derivative (with minus sign) coincide with the maxima of the original function, but peaks become sharper and clearer for the analysis.Stu1986 Several peaks are evident in the traces in Fig. 1, which number increases with frequency. The position and shape of the peaks are symmetric relative to zero magnetic field indicating the correct tuning of the setup. The magnetic field and frequency dependencies of the peak position are characteristic for the confined magnetoplasmons in finite size 2DEG samples.Stern1967
III Discussion
The dispersion of confined plasmons in zero magnetic field in quasi-electrostatic approximation is described by the following equation: Stern1967
| (1) |
where is the sheet concentration of 2D carriers, and is the effective dielectric permittivity of the surrounding medium. In our case of long wavelength plasmons ( 1 mm with , where d is the depth of 2DEG below the surface) we used with being a dielectric constant of gallium arsenide.Kukushkin ; Govorov
In our case, when the retardation effects are not importantMikhailovPRB05 , the 2D plasmon frequencies in magnetic field are described by the following equation:
| (2) |
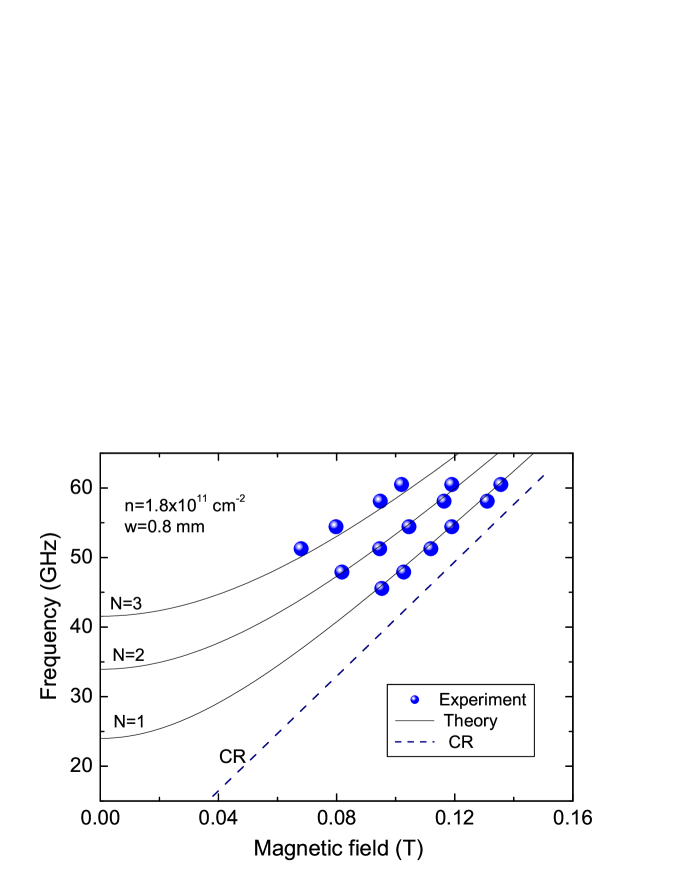
where is plasmon cyclic frequency at zero magnetic field, denotes the plasmon wave vector; N=1,2,3… is the plasmon mode, w is the sample width, is the cyclotron frequency, is the electron effective mass. In our calculations we use =0.068 estimated for this particular quantum well sample.Moreau ; Moreau2 The peak positions of the magnetoplasmon resonances are plotted in Fig. 2 as a function of magnetic field. It is evident that Eq.(2) describes the experimental data on this sample quite well, suggesting that the observed peaks are indeed due to the confined magnetoplasmon resonances.
To obtain further evidences that the observed peaks in Fig. 1 are due to plasmon resonances, we have also studied their dependence as a function of the electron density. As it is mentioned above, the free carrier density is tuned by varying the illumination intensity. As it follows from Eqs. (1) and (2), the resonance field position of the magnetoplasmon peaks vs. electron concentration is described by the following equation:
| (3) |
where is the MW frequency at which the measurements are performed, N is the plasmon mode. A useful practical equation to calculate plasmon peak position is given by the following formulae:
| (4) |
where is measured in Tesla, in GHz, is electron surface density in , and w is the stripe width in cm.
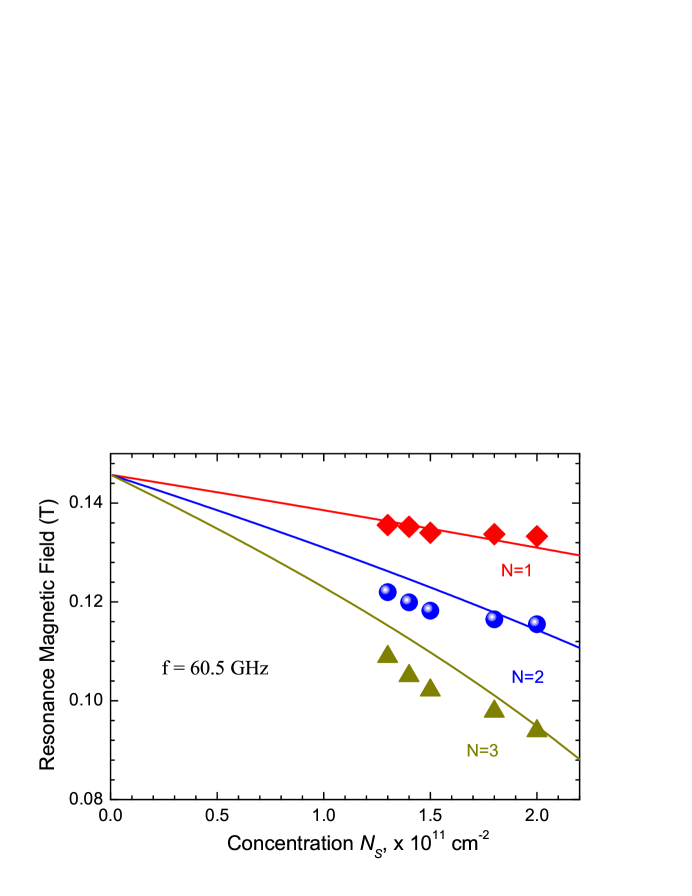
The results of this study vs. electron concentration are presented in Fig. 3. It is seen from the figure that in accordance with Eq. 3 the splitting between magneto-plasmon modes increases with the density. It is clear that agrement between the experiment (points) and the theory (solid lines) is fairly good, confirming again that the observed structure is due to confined magnetoplasmons.
IV Conclusions
In summary, the MW absorption by a 2DEG stripe made of a fairly high-mobility GaAs/AlGaAs wafer was investigated using a sensitive EPR cavity technique. It was shown that the magnetoplasmons play a dominant role in microwave experiments on 2DEG samples. The 2D plasmon spectra were studied as a function magnetic field, microwave frequency, and carrier concentration. Experimental results were compared with the theoretical predictions and a good agreement between both was found.
References
- (1) R. G. Mani, J. H. Smet, K. von Klitzing, V. Narayanamurti, W. B. Johnson, and V. Umansky, Nature (London) 420, 646 (2002).
- (2) M. A. Zudov, R. R. Du, L. N. Pfeiffer, and K. W. West, Phys. Rev. Lett. 90, 046807 (2003).
- (3) S.A. Studenikin, M. Potemski, A. S. Sachrajda, M. Hilke, L. N. Pfeiffer, and K. W. West, IEEE Transactions on Nanotechnology 4, 124 (2005).
- (4) M. Byszewski, B. Chwalisz, D.K. Maude, M.L. Sadowski, M. Potemski, T. Saku, Y. Hirayama, S. Studenikin, D.G. Austing, A.S. Sachrajda, P. Hawrylak, Nature Physics 2, 239 (2006).
- (5) S. Moreau, M. Byszewski, M.L. Sadowski, M. Potemski, S.A. Studenikin, D.G. Austing, A.S. Sachrajda, T. Saku, Y. Hirayama, Physica E 32, 203 (2006).
- (6) S. Moreau, O. M. Fedorych, M.L.Sadowski, M. Potemski, S. Studenikin, G. Austin, A.S. Sachrajda, T. Saku, Y. Hariama, International Journal of Modern Physics B, 21, 1579 (2007).
- (7) M. Seck and P. Wyder Rev. Sci. Instrum. 69, 1817 (1998).
- (8) M. Seck, M. Potemski, and P. Wyder, Phys. Rev. B 56, 7422 (1997).
- (9) S.A. Studenikin, and E. M. Skok, Phys. Status Solidi B 134, 745 (1986).
- (10) F. Stern, Phys. Rev. Lett. 18, 546 (1967).
- (11) I. V. Kukushkin, J. H. Smet, V. A. Kovalskii, S. I. Gubarev, K. von Klitzing, and W. Wegscheider, Phys. Rev. B 72, 161317 (2005).
- (12) A. Govorov (private communication).
- (13) S. A. Mikhailov and N. A. Savostianova, Phys. Rev. B 71, 035320 (2005).