Vol.0 (2009) No.0, 000–000
22institutetext: Graduate University of Chinese Academy of Sciences, 19A Yuquan Road, Shijingshan District, Beijing 100049, China
Multicolour Photometric Study of M31 Globular Clusters
Abstract
We present the photometry of 30 globular clusters (GCs) and GC candidates in 15 intermediate-band filters covering from 3000 to 10000 Å using the archival CCD images of M31 observed as part of the Beijing - Arizona - Taiwan - Connecticut (BATC) Multicolour Sky Survey. We transform these intermediate-band photometric data to the photometry in the standard broad-bands. These M31 GC candidates are selected from the Revised Bologna Catalogue (RBC V.3.5), and most of these candidates do not have any photometric data. Therefore the present photometric data are supplement to RBC V.3.5. We find that 4 out of 61 GCs and GC candidates in RBC V.3.5 do not show any signal on the BATC images at their locations. By linear fit of the distribution in colour-magnitude diagram of blue GCs and GC candidates using the data from RBC V.3.5, and in this study we find the “blue-tilt” of blue M31 GCs with a high confidence at 99.95% or for the confirmed GCs, and or for GCs and GC candidates.
keywords:
galaxies: individual (M31) — galaxies: star clusters — galaxies: evolution1 Introduction
Globular clusters (GCs) are the oldest bound stellar systems in the galaxies, so they provide a fossil record of the earliest stages of galaxy formation and evolution. In addition, since the GCs are bright (), they can be detected at a large distance such as Virgo (see, e.g., Peng et al. [2006]) and Coma Clusters (see, e.g., Baum et al. [1995]). Furthermore, Kalirai et al. ([2008]) discovered the GC system (GCS) of a galaxy which is 375 Mpc far away () and Mieske et al. ([2004]) detected a GC system in Abell 1689 (), both of which are based on the deep image observations with the Advanced Camera for Surveys (ACS) on (). We can study the evolutionary process of the distant galaxy through the nature of its GCs. Finally, GCs are helpful to study the simple stellar population, since the populations in a GC are generally thought to have the same age and the same metallicity. However, some Galactic GCs, such as NGC 2808 and NGC 1851 are now suspected to be composed of heterogeneous populations, and recent data from are hinting at a great fraction of Galactic GCs being composite populations at least chemically (see, e.g., Yi [2009] and references there).
Located at a distance of kpc (see, e.g., Stanek & Garnavich [1998]; Macri et al. [2001]; McConnachie et all. [2005]), M31 is the largest and nearest Sb-type spiral galaxy in Local Group. According to the latest catalogue: The Revised Bologna Catalogue of M31 GCs and GC candidates (RBC V.3.5) (Galleti et al. [2004]; Galleti et al. [2006]; Galleti et al. [2007]), there are 509 confirmed GCs and 1058 GC candidates discovered in M31 by far and 421 former GC candidates have been proved to be stars, asterisms, galaxies, HII regions or extended clusters. These GCs and GC candidates in RBC were observed and discovered by many authors in different observation systems, i.e. CCD photometry, photoelectric photometry, and photographic plates, and a few are visual photometry (see, e.g., Vetesnik [1962]; Sargent et al. [1977]; Battistini et al. [1980]; Crampton et al. [1985]; Barmby et al. [2000]). For obtaining homogeneous photometric data, Galleti et al. ([2004]) took the photometric data of Barmby et al. ([2000]) as reference and transformed others to this reference and make the Master Catalogue RBC (see details in Galleti et al. [2004]). Although this catalogue includes the most comprehensive photometry by far, there are dozens of GCs and GC candidates nearly having not any photometric data. So it is impending to present the photometry for these GCs and candidates.
In the present study we will present the BATC multicolour photometric data for 30 GCs and GC candidates in RBC V.3.5, which nearly have not any photometric and spectroscopic information.
This paper is organized as follows. In Sect. 2 we present the BATC observations and Sect. 3 describes the data reduction process. In Sect. 4 the final photometric results are given and we compare our photometry to photometry in literature. The new magnitude and colour distributions of the M31 GCs and GC candidates are also shown in Sect. 4. And finally, concluding remarks are given in Sect. 5.
2 The sample and observations
2.1 The Sample GC Candidates
To date, the study of M31 GCs has been mainly based on the comprehensive Bologna Catalogue (Battistini et al. [1980, 1987, 1993]). Especially, Galleti et al. ([2004]) collected and revised all the available photometry, obtaining homogeneous photometric data in bands by comparing all the data with the CCD photometries of Barmby et al. ([2000]) as a reference. In addition, Galleti et al. ([2004]) have searched the counterparts of the objects in their catalogue based on the 2MASS database, providing integrated photometry for 529 GCs and GC candidates, of which no previous NIR photometry was observed. This catalogue is referred as the Revised Bologna Catalogue of M31 globulars (hereafter RBC) (Galleti et al. [2004]). It is worth mentioning that RBC is frequently revised (Galleti et al. [2004, 2005, 2006, 2007]). The latest RBC is updated on March 27, 2008, and referred as RBC V.3.5 111Please see the details and download the catalogue from http://www.bo.astro.it/M31/, which includes the newly discovered star clusters from Mackey et al. ([2006]); Kim et al. ([2007]) and Huxor et al. ([2008]). When we check the distribution of mag in RBC V.3.5, we find that there are 61 GCs and GC candidates not having magnitudes, which are drawn in Fig.1 with open and solid circles, and the solid circles represent the multicolour photometries of these GCs and GC candidates obtained in this paper. In fact, there are few photometric data in any filters for these objects. So, in order to obtain the photometry for these objects, we searched the BATC survey archive during 1995 February 2008 March, i.e., from the beginning to the end of M31 observation view before 2008 March (since the M31 field cannot be observed in Xinglong Station after March every year), covering about 6 square degrees, as showed in Fig. 1. There are 519 individual images extracted, of which the observation images during 1995 September 1999 December have been dealt by Jiang et al. ([2003]) (see their Table 1). Table 4 lists the log of observations from 2000 to 2008. There are 7 of them (EXT8, SH25, B306D, DAO11, BA22, BH01 and BA10) out of the BATC observation fields. So, the final sample of M31 GC candidates of this paper includes 54 objects. However, in this paper, we obtained the BATC multicolour photometry for 30 objects. The photometries for the other 24 objects are not obtained in this paper because of low signal-to-noise ratio or other reasons, which will be discussed in detail below. By comparing with Tables 1, 3, 4 and 5 of Caldwell et al. ([2009]), who present a new catalogue of 670 likely star clusters, stars, possible stars and galaxies in the field of M31, all with updated high-quality coordinates being accurate to based on the images from the Local Group Survey (Massey et al. [2006]) or Digitized Sky Survey (DSS), we find that, of these 54 objects only four objects (V234, H13, B523 and SK131C) are not included in Tables 1, 3, 4 and 5 of Caldwell et al. ([2009]). In addition, there are 5 objects, the coordinates of which are different between Galleti et al. ([2004]) (RBC V.3.5) and Caldwell et al. ([2009]). We listed them in Table 1 for comparison. Since Caldwell et al. ([2009]) corrected the coordinates of M31 clusters based on the Hectospec fibers and FK5 system, we used the coordinates in Caldwell et al. ([2009]) to obtain the multicolour photometries for these 5 clusters in this paper.
Below, we will discuss the 24 objects in details, the photometries of which were not obtained in this paper.
1. There are 13 GCs and GC candidates (B523, DAO32, NB27, NB31, NB35, NB43, NB59, NB62, NB84, NB85, DAO83, SK131C and V229), the signal-to-noise ratios of which are too low in the BATC survey images of this paper, therefore we do not obtain their photometries.
2. NB57, NB60, SH05 and SH08: In the BATC survey images of this paper, anything was not found on their positions given in RBC V.3.5. Maybe, they are too faint to be seen in the BATC survey images. However, there is an object very near the position of NB60 presented by Galleti et al. ([2004]). The R.A. and DEC of this object are 00:42:26.63 and +41:18:04.5 compared to the R.A. and DEC of 00:42:26.68 and +41:18:10.70 presented by RBC V.3.5 for NB60.
3. B287: This cluster is very close to an object in the BATC survey images (because of the low resolution of BATC system), the distance of between the centers of these two objects is about 3 pixels in the BATC images (in fact, from the BATC images, these two objects joint together), and we cannot obtain its photometry accurately in this paper.
4. B287D: It is very close to an object in the BATC survey images, the distance of between the centers of these two objects is about 3 pixels in the BATC images, and we cannot obtain its photometry accurately in this paper, too. In addition, this object is classified as a star by Caldwell et al. ([2009]).
5. B259D: This object is classified as a star by Caldwell et al. ([2009]). In addition, it overlaps another object in the BATC survey images. Therefore, we did not obtain its photometry in this paper, either.
6. DAO88: This object is faint, the magnitude in filter is from Caldwell et al. ([2009]). In addition, it is close to a much brighter star in the Milk Way (the magnitude of this star in BATC filter is ). This star contaminates DAO88, although the distance of the centers of these two objects is 28 pixels in the BATC images, and we also cannot obtain its photometry accurately in this paper. In addition, the spectrum of this object is emission-line dominated from Caldwell et al. ([2009]).
7. H13 and V300: In the BATC survey images, these two objects overlap an object, respectively. So, we did not obtain its photometry in this paper, either.
8. V254: It looks very extended in the BATC images, and is probably not a star cluster. In fact, Caldwell et al. ([2009]) has classified this object as an HII region. Thus, we do not present its multicolour photometry in this paper.
2.2 Observations
The observations of M31 were carried out by the BATC Multicolour Sky Survey System, which uses a 60/90 cm f/3 Schmidt telescope at Xinglong Station of the National Astronomical Observatories, Chinese Academy of Sciences (NAOC), where the typical seeing condition is (Ma et al. [2006a]). This system includes 15 intermediate-band filters, covering a range of wavelength from 3000 to 10000 Å (e.g., Fan et al. [1996]; Zhou et al. [2003]). Before February 2006, a Ford Aerospace thick CCD camera was applied, which has a pixel size of 15 and a field of view of , resulting in a resolution of . Later till now, a new E2V thinned CCD with a pixel size of 12 , has successfully been mounted on the focal plane of the Schmidt telescope, resulting in a resolution of . The blue quantum efficiency of the new E2V thinned CCD, which is at 4000 Å, is much higher than the old thick one. Please refer Table 2 for comparing the parameters between thick and thinned CCD.
M31 fields were observed in several observing runs: the first run is on the nights of UT 1995 February 1999 December; the second observation is on the nights of UT 2004 January 1227 and 2004 February 17; the third observation is on the nights of UT 2004 August 1219, September 627 and October 112; the fourth observation is on the nights of UT 2005 October 31 and November 17; the fifth observation is on the nights of UT 2006 October 629 and November 118. Table 4 summarizes the observational catalogue including the name of observed field, filter name, central wavelength, width of filter, numbers of image combined, exposure time, and limiting magnitude, respectively.

Fig. 1 shows the location of 7 observed fields those are drawn with boxes, the names of which are labeled in each box. The total observed field of view is about 6 square degrees.
3 Data Reduction and Photometry
Descriptions of the BATC photometric system can be found in Fan et al. ([1996]). Bias subtraction and flat-fielding with dome flats were done with the BATC automatic data reduction software, PIPELINE I, developed for the BATC Multicolour Sky Survey (Fan et al. [1996]; Zheng et al. [1999]). The dome flat-field images were taken by using a diffuser plate in front of the correcting plate of the Schmidt telescope, and the flatfielding technique has been verified (see e.g., Fan et al. [1996]; Zheng et al. [1999]; Wu et al. [2002]; Yan et al. [2000]; Zhou et al. [2001, 2004]). Spectrophotometric calibration of the M31 images are made by observations of four sub-dwarfs, HD 19445, HD 84937, BD and BD , all taken from Oke & Gunn ([1983]). Hence, our magnitudes are defined in a way similar to the spectrophotometric AB magnitude system (i.e, the Oke & Gunn monochromatic system).
The BATC magnitudes (see, e.g., Yan et al. [2000]; Zhou et al. [2001, 2003]) of the AB magnitude system is defined as
| (1) |
which links the magnitude to the number of photons detected by the CCD rather than to the input flux (Fukugita et al. [1996]). In equation (1), is frequency; is the spectral energy distribution of the source in unit of ; is the filter response function of the system; and are the lower and upper cutoff wavelength of the passband, respectively.
3.1 Calibrations for and Intermediate-band Filters of M31-1 Field
Jiang et al. ([2003]) and Ma et al. ([2006b, 2006c, 2007]) studied 203 M31 GCs and GC candidates based on the BATC observations in to intermediate-band filters for the M31 central field (M31-1 in Fig. 1). In this paper, we also used the combined images and calibrated results of Jiang et al. ([2003]) to obtain the photometric data for our sample GCs and GC candidates in the intermediate-band filters of to , which are in the M31-1 field. For the new observed images of the M31-1 field in and intermediate-band filters, we reduced them by automatic reduction software: Pipeline I, which includes bias subtraction and flat fielding of the CCD images. Then, we combined the images observed in the same filter to eliminate cosmic rays and to increase the signal-to-noise ratios as usually done in photometry. The absolute flux of the combined images was calibrated using the observations of standard stars (see, e.g., Fan et al. [1996]; Zheng et al. [1999]; Wu et al. [2002]; Yan et al. [2000]; Zhou et al. [2001, 2004]).
Table 3 lists the observational parameters of the BATC M31-1 filed in and filters: filter name, central wavelength, width of filter, numbers of image combined, exposure time, the calibration errors in magnitude of the standard stars, and limiting magnitude, respectively.
3.2 Calibrations of M31-2 to M31-7 Fields
For the images of the M31-2 to M31-7 fields, we did the same imaging reduction and combination as we did in Sect.3.1. The absolute flux of the combined images of the M31-2 to M31-7 fields was calibrated based on secondary standard transformations using the M31-1 field; we could easily identify the stars in common between the M31-2 to M31-7 fields and the M31-1 field, since adjacent overlapping fields were initially arranged. On the image of each filter, we first identified the positions of the common stars in the overlapping fields, calculated the mean magnitude offsets between the standardized magnitudes and instrumental magnitudes, and then applied this magnitude offset to transform the instrumental magnitudes of the M31-2 to M31-7 fields to the standardized magnitudes.
3.3 IRAF/DAOPHOT Photometry
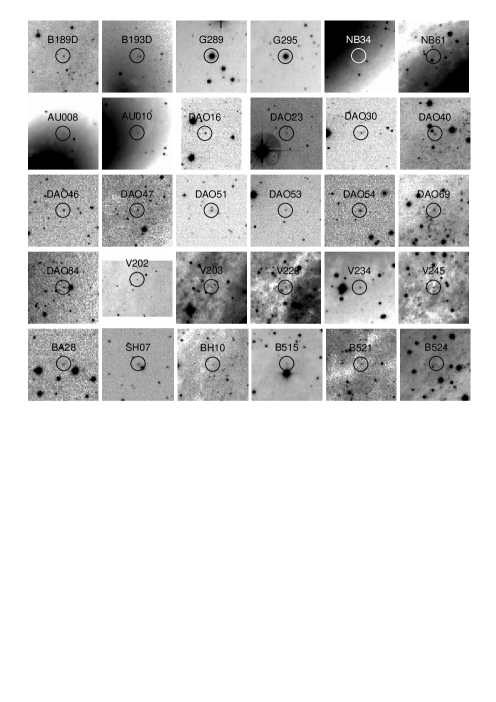
For each M31 GC and GC candidate, the PHOT routine in DAOPHOT (Stetson [1987]) is used to obtain magnitudes. To avoid contamination from nearby objects, we adopt an aperture of a radius of 3 pixels on the Ford CCD and of a radius of 4 pixels on the E2V CCD. Inner and outer radius for background determination are taken at 8 to 13 pixels for the 2k2k Ford CCD corresponding to 10 to 17 pixels for the 4k4k E2V CCD, from the center of the objects. Given the small aperture use for the GC and GC candidate observations, aperture corrections are determined as follows: We use the isolated stars to determine the magnitude difference between photometric radius of 3 pixels on the Ford CCD images and of 4 pixels on the E2V CCD images and the full magnitude of these stars in each of the 15 BATC filters. The spectral energy distributions (SEDs) for the GCs and GC candidates are then corrected for this difference in each filter. However, for AU008, since its background is too bright and varies greatly, we adopted an aperture radius of 2 pixels, and inner and outer radius for background determination are taken at 3 to 6 pixels. The SEDs for the sample GCs and GC candidates are listed in Table 5. Column 2 to Column 16 give the magnitudes of the 15 BATC passbands observed. The second line for each object gives the errors in magnitudes for the corresponding passband. The errors for each filter are given by DAOPHOT. For some GCs and GC candidates, the magnitudes in some filters could not be obtained due to low signal-to-noise ratio. Fig. 2 shows the finding charts of the sample GCs and GC candidates in this paper in the BATC band (centered on 5795Å), obtained with the NAOC 60/90cm Schmidt telescope.
3.4 Transformed Magnitudes in Broadband System
It is an uncontroverted fact that the photometry in the broadband system is very commonly used in astrophysical studies. In RBC V.3.5, the authors transformed the magnitudes of M31 605 GCs and GC candidates from Kim et al. ([2007]) in the Washington photometry to ones in broadband system based on the equations of Geisler ([1996]). These GCs and GC candidates were searched on the CCD images observed by Kim et al. ([2007]) using the KPNO 0.9m telescope. In order to keep consistency with RBC V.3.5, we will transform the magnitudes of the sample GCs and GC candidates obtained in this paper to ones in broadband system. Using Landolt standards and the catalogues of Landolt ([1983, 1992]) and of Galadí-Enríquez, Trullols & Jordi ([2000]), Zhou et al. ([2003]) derived the relationships between the BATC intermediate-band system and the broad-band system. These relationships are given in equations (2) and (6) as:
| (2) |
| (3) |
| (4) |
| (5) |
| (6) |
errors of the magnitudes were estimated using the formulas below,
| (7) |
| (8) |
| (9) |
| (10) |
| (11) |
Using these equations, we calculate the broadband magnitudes and 1 errors for the GCs and GC candidates in this paper and list them in Table 6.
4 Results and Discussions
4.1 Comparison of the Broadband Magnitude
Very recently, Caldwell et al. ([2009]) presented an updated catalogue for 1300 objects in M31, including 670 likely star clusters, and this catalogue presented the magnitudes in the band for the most objects based on the observations of LGS survey of M31. In order to check the photometry in this paper, we compared the results between Caldwell et al. ([2009]) and this paper. In Fig. 3, we plot the comparison of (BATC) photometry with the measurement of Caldwell et al. ([2009]). In this figure, our magnitudes are on the x-axis, the difference between our and Caldwell et al. ([2009]) magnitudes are on the y-axis. The mean magnitude difference (in the sense of this paper Caldwell et al. ([2009])) is .

4.2 Magnitude and Colour Distributions
Based on the combined photometry of RBC V.3.5 and Table 6 in this paper, Fig. 4 plots the magnitude distributions of M31 confirmed GCs and GC candidates classified in RBC V.3.5. The distributions for the confirmed GCs ( in RBC V.3.5) are presented with the hatched histograms while the open histograms are for the GCs and GC candidates (, 2 and 3 in RBC V.3.5) 222Note that there are 265 GC candidates in RBC V.3.5, which are classified as stars (148), galaxies (117) by Caldwell et al. ([2009]). So, we did not include these objects in Fig. 4. We indicate that in RBC V.3.5, , 2 and 3 represent confirmed GCs, GC candidates and controversial objects. The controversial objects, the total number of which is only 9 in RBC V.3.5, mean that, for example, some objects have been classified as galaxies based on high resolution ground images, while they are classified as GCs on the basis of spectroscopical observation (see, Galleti et al. [2004] for more details). They need to be confirmed in future. So they are included as GC candidates in this paper. In all, combining the photometry in RBC V.3.5 and this paper, there are totally 1029, 1085, 1289, 1033 and 1093 photometric values in the and bands for GCs and GC candidates in M31, respectively, and there are 428, 449, 506, 423 and 456 confirmed GCs having photometric data in and bands, respectively. Obviously, the confirmed GCs only occupy a small part of candidates. So, in the future, it is also impending to confirm GCs from GC candidates.

In addition, Fig. 5 also plots the colour distributions for the GCs and GC candidates with the same photometric data as in Fig. 4. For the GCs (the hatched histograms), the peak values of the colour distributions in , , , , and are about 0.8, 1.3, 1.9, 0.5, 0.3 and 2.5, respectively. The peak values of the colour distributions for all the GCs and GC candidates are nearly the same as those of the GCs except for colour. It seems that the confirmed GCs dominate the bluest part of all the GCs and GC candidates in the colour distribution while the other colour distributions do not show this phenomenon, which is also seen in Fig. 6. This may be due to the fact that Near Infrared (NIR) photometry of GCs and GC candidates in RBC V.3.5 are actually lacked, which can be easily seen based on the number of colours. 2MASS is the main source of NIR photometry in RBC V.3.5. However, as the exposure time is usually too short in 2MASS survey, the NIR photometries of faint GCs and GC candidates are not obtained in RBC V.3.5. In addition, bright GCs are easily searched.

Fig. 6 plots the colour - colour diagrams of GCs and GC candidates in RBC V.3.5: vs various colours, which are from RBC V.3.5 and Table 6. The confirmed GCs are marked with red pluses while the GC candidates are shown as black pluses. The reason that we use the in every colour-colour diagram, is can provide a useful discriminant to separate the GCs from the background galaxies (Galleti et al. [2004]). In this figure, it is easy to find that most of the GCs with 3.0 while most of the 3.0 points are GC candidates. Therefore, there are a lot of GC candidates might be the background galaxies according to the conclusion of Galleti et al. ([2004]).
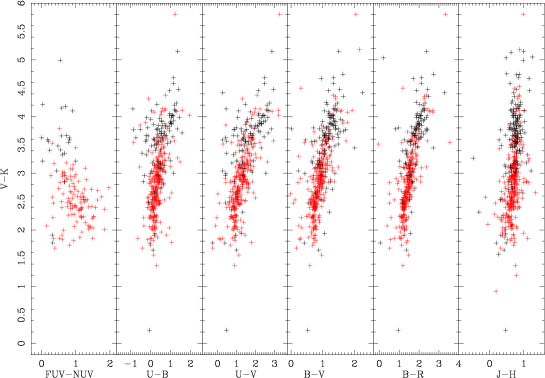
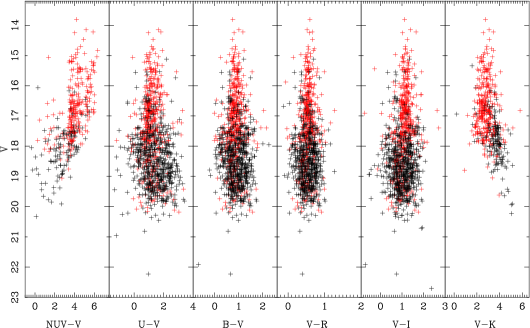
Fig. 7 shows the colour - magnitude diagrams for the GCs and GC candidates. Most of the candidates are fainter than 17 while most of the bright objects ( 17) are confirmed GCs. It implies that the fainter candidates are difficult to be identified and the bright GCs are much easier to be searched.
4.3 The Colour - Luminosity Relationship
Harris et al. ([2006]) investigated the colour magnitude diagrams (CMDs) of GCs in eight brightest cluster galaxies (BCGs) with the ACS/WFC data of HST, and found a trend that the redder GCs are more luminous (massive) for the blue (metal-poor) population with , which is called “blue tilt”. After that, Strader et al. ([2006]) also found the blue tilt phenomenon in giant ellipticals (gEs) M87 and NGC 4649 in Virgo Cluster by analyzing the HST/ACS images, and used the self-enrichment to interpret this phenomenon. Spitler et al. ([2006]) also utilized the HST/ACS images to study the Sa/S0 galaxy Sombrero (NGC 4594) and found the blue tilt in the CMD. Mieske et al. ([2006]) found that, the blue tilt exists in early galaxies from the brightest ones to the faintest ones in Virgo Cluster with the HST/ACS observations, and the slope is deeper in the more luminous host galaxies. Mieske et al. ([2006]) indicated that self-enrichment and field star capture, or a combination of the two processes, offer the most promising means of explaining the blue tilt. Strader & Smith ([2008]) analyzed all the possible explanations for the blue tilt phenomenon discovered previously in various external galaxies, and showed that the self-enrichment in proto-GC clouds can reproduce some aspects of the blue tilt. In this model, star formation is controlled by supernova feedback, and the efficiency scaling is proportional to the protocloud mass. Strader & Smith ([2008]) also investigated the metallicity and mass relationship of Galactic GCs, and did not find the blue tilt; and they suggested that this might be due to the fundamental differences between the parent clouds of Galactic GCs and those in blue-tilt galaxies. However, Strader & Smith ([2008]) do not know whether the blue tilt exits in M31 or not. We will investigate this phenomenon based on the data in RBC V.3.5 and in this paper.
We plot the CMDs in () versus band for all the confirmed GCs of M31 in Fig. 8 and for all the confirmed GCs and GC candidates of M31 in Fig. 9. The KMM mixture modeling routine (Ashman, Bird & Zepf [1994]) was performed to distinguish the blue and red subpopulations in both figures. Then we divided the GCs into several mag bins to calculate the mean colour and mean magnitude in each bin (see the big black spots in Figs. 8 and 9). We fit the linear relationship for the colour and magnitude with the formula: . First we fit the data of the confirmed GCs, for the blue population we have while for red population ; then for all the GCs and GC candidates, we have for the blue population and for the red population. The results strongly present evidence of significant slopes for the blue population. However, the slopes for the red population nearly approach zero, in other words, the luminosity of the red GC population is completely independent of its colour, which means there is no such relationship for red GC population.


5 Conclusions
In this paper, we obtain the photometry of 30 M31 GCs and GC candidates in 15 BATC intermediate bands. Based on Eqs. of Zhou et al. ([2003]), we transformed the BATC intermediate-band magnitudes to the boradband magnitudes for these GCs and GC candidates. We checked the objects in our BATC images and found that, 4 objects could not be detected in the locations presented in RBC V.3.5.
We also investigated the relationship between mag and colour for the confirmed GCs, and GCs and GC candidates, respectively. After fitting, we obtained the slope of the blue population for the confirmed GCs, and for all the GCs and GC candidates.
Finally, we point out that our new supplementary photometry to RBC V.3.5 is not only helpful for us to understand the total nature of GCS in M31 but also useful for the Large Sky Area Multi-Object Fiber Spectroscopic Telescope (LAMOST) project of China to estimate the exposure time when observing them by LAMOST. LAMOST is being built in Xionglong Station of National Astronomical Observatory, Chinese Academy of Sciences (NAOC), Heibei province of P. R. China. This telescope is a reflecting Schmidt telescope with an effective aperture of 4 meters and a primary mirror of 6 meters mounted on it, applying the active optics and fiber positioning technology. The angle diameter of the field of view (FOV) is 5 degree and 4000 fibers are on the large focal plane of 1.75-meter in diameter, which makes it possess the ability to produce several ten-thousands of spectra in one night for the faint objects down to mag. The LAMOST project has been completed in the end of 2008 and its spectroscopic survey will make important contributions to stellar astrophysics, the Galaxy, extra-galactic astrophysics and cosmology (Zhao [1999]). Thus it is proper to use LAMOST to investigate properties of GCs and GC candidates in M31 because of its wide FOV (5 degree) and many star clusters can be observed at the same time.
LAMOST is appropriate to study the properties of M31 GCs and GC candidates: in a few good nights, the spectral observations of M31 GCs and GC candidates can be obtained. Based on these data, we can study the properties of M31 GCs and GC candidates, such as confirming GCs with radial velocities and determining metallicities by measuring the strengths of various absorption features in the integrated spectra (see Perrett et al. [2002], and references there).
Acknowledgements.
We are indebted to the referee for thoughtful comments and insightful suggestions that improved this paper greatly. This work is supported by the Chinese National Natural Science Foundation through Grant Nos. 10873016, 10803007, 10473012, 10573020, 10633020, 10673012, and 10603006; and by National Basic Research Program of China (973 Program) No. 2007CB815403.References
- [1994] Ashman K. A., Bird C. M., Zepf S. E., 1994, AJ, 108, 2348
- [2000] Barmby P., Huchra J., Brodie J., Forbes D., Schroder L., Grillmair C., 2000, AJ, 119, 727
- [1980] Battistini P., Bònoli F., Braccesi A., Fusi Pecci F., Malagnini M. L., Marano B., 1980, A&AS, 42, 357
- [1987] Battistini P., Bònoli F., Braccesi A., Federici L., Fusi Pecci F., Marano B., Börngen F., 1987, A&AS, 67, 447
- [1993] Battistini P., Bònoli F., Casavecchia M., Ciotti L., Federici L., Fusi Pecci F., 1993, A&A, 272, 77
- [1995] Baum W. A. et al., 1995, AJ, 110, 2537
- [2009] Caldwell N., Harding P., Morrison H., Rose J. A., Schiavon R., Kriessler J., 2009, AJ, 137, 94
- [1985] Crampton D., Cowley A. P., Schade D., Chayer P., 1985, ApJ, 288, 494
- [1996] Fan X.-H. et al., 1996, AJ, 112, 628
- [1996] Fukugita M. et al., 1996, AJ, 111, 1748
- [2000] Galadí-Enríquez D., Trullols E., Jordi C., 2000, A&AS, 146, 169
- [2004] Galleti S., Federici L., Bellazzini M., Fusi Pecci F., Macrina S., 2004, A&A , 416, 917
- [2005] Galleti S., Bellazzini M., Federici L., Fusi Pecci F., 2005, A&A, 436, 535
- [2006] Galleti S., Federici L., Bellazzini M., Buzzoni A., Fusi Pecci F., 2006, A&A, 456, 985
- [2007] Galleti S., Bellazzini M. , Federici L., Buzzoni A., Fusi Pecci F., 2007, A&A, 471, 127
- [1996] Geisler D., 1996, AJ, 111, 480
- [2006] Harris W. E. et al., 2006, ApJ, 636, 90
- [2008] Huxor A. P., Tanvir N. R., Ferguson A. M. N., Irwin M. J., Ibata R., Bridges T., Lewis G. F., 2008, MNRAS, 385, 1989
- [2003] Jiang L.-H., Ma J., Zhou X., Chen J.-S., Wu H., Jiang Z.-J., 2003, AJ, 125, 727
- [2008] Kalirai J. S., Strader J., Anderson J., Bicher H. B., ApJ, 682, L37
- [2007] Kim S. C., Lee M. G., Geisler D., Sarajedini A., Park H. S., Hwang H. S., Harris W. E., Seguel J. C., von Hippel T., 2007, AJ, 134, 706
- [1983] Landolt A. U., 1983, AJ, 88, 439
- [1992] Landolt A. U., 1992, AJ, 104, 340
- [2006a] Ma J. et al., 2006a, PASP, 118, 98
- [2006b] Ma J. et al., 2006b, A&A, 449, 143
- [2006c] Ma J. et al., 2006c, MNRAS, 368, 1443
- [2007] Ma J. et al., 2007, ApJ, 659, 359
- [2006] Mackey A. D., Huxor A., Ferguson A. M. N., Tanvir N. R., Irwin M., Ibata R., Bridges T., Johnson R. A., Lewis G., 2006, ApJ, 653, 105
- [2001] Macri L. M. et al., 2001, ApJ, 549, 721
- [2006] Massey P., Olsen K. A. G., Hodge P. W., Strong S, B., Jacoby G. H., Schlingman W., Smith R. C., 2006, AJ, 131, 2478
- [2005] McConnachie A. W., Irwin M. J., Ferguson A. M. N., Ibata R. A., Lewis G. F., Tanvir N., 2005, MNRAS, 356, 979
- [2004] Mieske S. et al., 2004, AJ, 128, 1529
- [2006] Mieske S. et al., 2006, ApJ, 653, 193
- [1983] Oke J. B., Gunn J. E., 1983, ApJ, 266, 713
- [2006] Peng E. W. et al., 2006, ApJ, 639, 95
- [2002] Perrett K. M., Bridges T. J., Hanes D. A., Irwin M. J., Brodie J. P., Carter D., Huchra J. P., Watson F. G., 2002, AJ ,123, 2490
- [1991] Racine R., 1991, AJ, 101, 865
- [1977] Sargent W. L. W., Kowal C. T., Hartwick F. D. A., van den Bergh S., 1977, AJ, 82, 947
- [2006] Spitler L. R. et al., 2006, AJ, 132, 1593
- [1998] Stanek K. Z., Garnavich P. M., 1998, ApJ, 503, 131
- [1987] Stetson P. B., 1987, PASP, 99, 191
- [2006] Strader J., Brodie J. P., Spitler L., Beasley M. A., 2006, AJ, 132, 2333
- [2008] Strader J., Smith G. H., 2008, AJ, 136, 1828
- [1962] Vetesnik M., 1962, BAICz, 13,180
- [2002] Wu H. et al., 2002, AJ, 123, 1364
- [2000] Yan H.-J. et al., 2000, PASP, 112, 691
- [2009] Yi S. K., 2009, (arXiv:0903.2891)
- [1999] Zhao Y.-H., 1999, oaaf.conf, 1
- [1999] Zheng Z.-Y. et al., 1999, AJ, 117, 2757
- [2001] Zhou X., Jiang Z.-J., Xue S.-J., Wu H., Ma J., Chen J.-S., 2001, ChJAA, 1, 372
- [2003] Zhou X. et al., 2003, A&A, 397, 361
- [2004] Zhou X. et al., 2004, AJ, 127, 3642
| Caldwell et al. ([2009]) | RBC V.3.5 | |||
| ID | R.A. | DEC. | R.A. | DEC. |
| (J2000) | (J2000) | (J2000) | (J2000) | |
| (1) | (2) | (3) | (4) | (5) |
| DAO23 | 00:38:54.19 | +40:26:33.9 | 00:38:54.34 | +40:26:46.4 |
| V203 | 00:40:47.80 | +40:59:06.0 | 00:40:48.62 | +40:59:11.4 |
| SH07 | 00:39:37.36 | +42:09:57.1 | 00:39:37.73 | +42:09:28.3 |
| V202 | 00:40:47.82 | +40:55:34.3 | 00:40:47.29 | +40:55:25.5 |
| DAO16 | 00:37:57.25 | +40:24:49.7 | 00:37:56.83 | +40:24:45.5 |
| Parameters | Old CCD | New E2V CCD |
|---|---|---|
| (1) | (2) | (3) |
| Pixel Number | 40964096 | |
| Spatial Scales | ||
| FOV | ||
| Blue Quantum Efficiency ( at 4000 Å) | 92.2 | |
| Red Quantum Efficiency ( at 8500 Å) | 59.4 |
| Filter | C.W.a | Bandwidthb | Image Numberc | Exposured | Calibration Errore | Limiting Mags (S/N=5)f |
| (Å) | (Å) | (hr) | (MAG) | (MAG) | ||
| (1) | (2) | (3) | (4) | (5) | (6) | (7) |
| 3360 | 222 | 6 | 1.5 | 0.018 | 19.88 | |
| 3890 | 187 | 6 | 2.0 | 0.013 | 18.43 |
a0.7Central wavelength for each BATC filer
in Å.
\tablenotesb0.7Bandwidth of the filter in Å.
\tablenotesc0.7The number of images combined to
increase the signal-to-noise ratios in each BATC filer.
\tablenotesd0.7Total exposure time in
hours.
\tablenotese0.7The zero-point errors in magnitude
for each filter obtained from the standard stars.
\tablenotesf0.7The limiting magnitudes for S/N=5.
| Field | Filter | Central Wavetlngth | Bandwidth | Image Number | Exposure | Limiting Mags (S/N=5) |
|---|---|---|---|---|---|---|
| (Å) | (Å) | (hr) | (MAG) | |||
| (1) | (2) | (3) | (4) | (5) | (6) | (7) |
| M31-2 | 3360 | 222 | 7 | 2.1 | 19.63 | |
| … | 3890 | 187 | 7 | 2.1 | 19.96 | |
| … | 4210 | 185 | 4 | 0.8 | 20.05 | |
| … | 4550 | 222 | 9 | 3.0 | 20.09 | |
| … | 4920 | 225 | 3 | 1.0 | 19.53 | |
| … | 5270 | 211 | 3 | 1.0 | 18.60 | |
| … | 5795 | 176 | 3 | 1.0 | 19.32 | |
| … | 6075 | 190 | 3 | 1.0 | 19.29 | |
| … | 6660 | 312 | 5 | 1.7 | 20.47 | |
| … | 7050 | 121 | 6 | 2.0 | 19.25 | |
| … | 7490 | 125 | 4 | 1.3 | 18.83 | |
| … | 8020 | 179 | 3 | 1.0 | 19.12 | |
| … | 8480 | 152 | 5 | 1.7 | 18.10 | |
| … | 9190 | 194 | 3 | 1.0 | 18.53 | |
| … | 9745 | 188 | 5 | 1.7 | 16.83 | |
| M31-3 | 3360 | 222 | 7 | 2.1 | 17.55 | |
| … | 3890 | 187 | 6 | 1.8 | 18.43 | |
| … | 4210 | 185 | 4 | 1.0 | 20.08 | |
| … | 4550 | 222 | 3 | 1.0 | 18.62 | |
| … | 4920 | 225 | 4 | 1.3 | 19.76 | |
| … | 5270 | 211 | 3 | 1.0 | 19.75 | |
| … | 5795 | 176 | 3 | 1.0 | 19.50 | |
| … | 6075 | 190 | 3 | 1.0 | 19.56 | |
| … | 6660 | 312 | 3 | 1.0 | 18.10 | |
| … | 7050 | 121 | 3 | 1.0 | 18.12 | |
| … | 7490 | 125 | 3 | 1.0 | 19.47 | |
| … | 8020 | 179 | 3 | 1.0 | 18.64 | |
| … | 8480 | 152 | 8 | 2.7 | 17.89 | |
| … | 9190 | 194 | 4 | 1.3 | 17.81 | |
| … | 9745 | 188 | 7 | 2.3 | 17.92 | |
| M31-4 | 3360 | 222 | 6 | 1.8 | 17.41 | |
| … | 3890 | 187 | 4 | 1.1 | 17.47 | |
| … | 4210 | 185 | 6 | 1.5 | 18.02 | |
| … | 4550 | 222 | 3 | 1.0 | 20.03 | |
| … | 4920 | 225 | 3 | 1.0 | 20.25 | |
| … | 5270 | 211 | 3 | 1.0 | 19.49 | |
| … | 5795 | 176 | 3 | 1.0 | 19.93 | |
| … | 6075 | 190 | 4 | 1.3 | 20.30 | |
| … | 6660 | 312 | 3 | 1.0 | 19.55 | |
| … | 7050 | 121 | 3 | 1.0 | 19.57 | |
| … | 7490 | 125 | 3 | 1.0 | 19.40 | |
| … | 8020 | 179 | 3 | 1.0 | 18.93 | |
| … | 8480 | 152 | 5 | 1.7 | 17.68 |
| Field | Filter | Central Wavetlngth | Bandwidth | Image Number | Exposure | Limiting Mags (S/N=5) |
|---|---|---|---|---|---|---|
| (Å) | (Å) | (hr) | (MAG) | |||
| (1) | (2) | (3) | (4) | (5) | (6) | (7) |
| … | 9190 | 194 | 7 | 2.3 | 18.95 | |
| … | 9745 | 188 | 3 | 1.0 | 16.71 | |
| M31-5 | 3360 | 222 | 6 | 2.0 | 16.54 | |
| … | 3890 | 187 | 8 | 2.5 | 17.03 | |
| … | 4210 | 185 | 7 | 1.8 | 20.50 | |
| … | 4550 | 222 | 3 | 1.0 | 20.19 | |
| … | 4920 | 225 | 3 | 1.0 | 19.49 | |
| … | 5270 | 211 | 3 | 1.0 | 20.02 | |
| … | 5795 | 176 | 3 | 1.0 | 20.03 | |
| … | 6075 | 190 | 3 | 1.0 | 20.27 | |
| … | 6660 | 312 | 3 | 1.0 | 20.07 | |
| … | 7050 | 121 | 3 | 1.0 | 19.51 | |
| … | 7490 | 125 | 3 | 1.0 | 19.35 | |
| … | 8020 | 179 | 3 | 1.0 | 18.73 | |
| … | 8480 | 152 | 6 | 2.0 | 18.21 | |
| … | 9190 | 194 | 3 | 1.0 | 18.22 | |
| … | 9745 | 188 | 6 | 2.0 | 18.33 | |
| M31-6 | 3360 | 222 | 7 | 2.1 | 17.43 | |
| … | 3890 | 187 | 7 | 2.1 | 17.58 | |
| … | 4210 | 185 | 7 | 1.8 | 17.70 | |
| … | 4550 | 222 | 6 | 2.0 | 16.07 | |
| … | 4920 | 225 | 4 | 1.3 | 19.62 | |
| … | 5270 | 211 | 3 | 1.0 | 19.69 | |
| … | 5795 | 176 | 3 | 1.0 | 19.22 | |
| … | 6075 | 190 | 3 | 1.0 | 19.25 | |
| … | 6660 | 312 | 6 | 2.0 | 19.83 | |
| … | 7050 | 121 | 3 | 1.0 | 18.97 | |
| … | 7490 | 125 | 3 | 1.0 | 17.24 | |
| … | 8020 | 179 | 3 | 1.0 | 17.95 | |
| … | 8480 | 152 | 5 | 1.7 | 17.50 | |
| … | 9190 | 194 | 3 | 1.0 | 17.59 | |
| … | 9745 | 188 | 6 | 2.0 | 18.22 | |
| M31-7 | 3360 | 222 | 6 | 2.0 | 19.66 | |
| … | 3890 | 187 | 6 | 2.0 | 20.26 | |
| … | 4210 | 185 | 3 | 0.8 | 15.49 | |
| … | 4550 | 222 | 3 | 1.0 | 19.86 | |
| … | 4920 | 225 | 3 | 1.0 | 20.16 | |
| … | 5270 | 211 | 3 | 1.0 | 20.06 | |
| … | 5795 | 176 | 3 | 1.0 | 19.24 | |
| … | 6075 | 190 | 3 | 1.0 | 19.37 | |
| … | 6660 | 312 | 3 | 1.0 | 19.99 | |
| … | 7050 | 121 | 5 | 1.7 | 20.09 | |
| … | 7490 | 125 | 3 | 1.0 | 17.73 |
| Field | Filter | Central Wavetlngth | Bandwidth | Image Number | Exposure | Limiting Mags (S/N=5) |
| (Å) | (Å) | (hr) | (MAG) | |||
| (1) | (2) | (3) | (4) | (5) | (6) | (7) |
| … | 8020 | 179 | 3 | 1.0 | 18.08 | |
| … | 8480 | 152 | 6 | 2.0 | 18.28 | |
| … | 9190 | 194 | 6 | 2.0 | 18.10 | |
| … | 9745 | 188 | 6 | 2.0 | 17.92 |
| ID | |||||||||||||||
|---|---|---|---|---|---|---|---|---|---|---|---|---|---|---|---|
| (1) | (2) | (3) | (4) | (5) | (6) | (7) | (8) | (9) | (10) | (11) | (12) | (13) | (14) | (15) | (16) |
| B189D | 18.98 | 18.31 | 18.18 | 17.90 | 18.00 | 18.01 | 17.91 | 17.87 | 17.78 | 17.74 | 17.96 | 17.85 | 18.15 | 17.95 | 17.78 |
| 0.106 | 0.050 | 0.064 | 0.088 | 0.061 | 0.058 | 0.066 | 0.062 | 0.053 | 0.068 | 0.144 | 0.098 | 0.169 | 0.262 | 0.260 | |
| B193D | … | 19.03 | 18.64 | 18.15 | 18.05 | 17.86 | 17.51 | 17.66 | 17.40 | 17.39 | 17.33 | 17.03 | 17.36 | 17.41 | 17.43 |
| … | 0.150 | 0.098 | 0.174 | 0.192 | 0.157 | 0.164 | 0.131 | 0.105 | 0.135 | 0.150 | 0.112 | 0.184 | 0.216 | 0.268 | |
| G289 | 15.70 | 14.55 | 13.70 | 13.12 | 12.56 | 12.48 | 12.15 | 12.07 | 11.94 | 11.75 | 11.61 | 11.63 | 11.73 | 11.68 | 11.64 |
| 0.007 | 0.005 | 0.002 | 0.001 | 0.002 | 0.002 | 0.002 | 0.002 | 0.001 | 0.002 | 0.002 | 0.001 | 0.002 | 0.001 | 0.002 | |
| G295 | 13.80 | 12.91 | 12.39 | 11.90 | 11.72 | 11.70 | 11.55 | 11.56 | 11.55 | 11.36 | 11.28 | 11.34 | 11.48 | 11.53 | 11.55 |
| 0.003 | 0.001 | 0.001 | 0.001 | 0.001 | 0.001 | 0.001 | 0.001 | 0.001 | 0.002 | 0.002 | 0.001 | 0.002 | 0.001 | 0.002 | |
| NB34 | … | 20.02 | … | 18.88 | … | 17.76 | … | … | 17.20 | 17.47 | … | … | … | 17.10 | … |
| … | 0.454 | … | 0.366 | … | 0.160 | … | … | 0.179 | 0.300 | … | … | … | 0.346 | … | |
| NB61 | … | … | … | … | … | … | … | … | 18.48 | 17.70 | 16.78 | 16.69 | 16.47 | 16.12 | 16.07 |
| … | … | … | … | … | … | … | … | 0.760 | 0.438 | 0.225 | 0.245 | 0.232 | 0.175 | 0.177 | |
| AU008 | … | 19.64 | … | 17.85 | 17.52 | 17.44 | 17.99 | 17.40 | 17.02 | 17.01 | … | … | … | … | … |
| … | 0.313 | … | 0.220 | 0.232 | 0.250 | 0.568 | 0.369 | 0.306 | 0.363 | … | … | … | … | … | |
| AU010 | 19.99 | 19.10 | 19.07 | 18.09 | 17.73 | 17.53 | 17.18 | 16.95 | 16.53 | 16.32 | 15.98 | 15.77 | … | 15.46 | 15.46 |
| 0.693 | 0.637 | 1.424 | 0.867 | 0.841 | 0.758 | 0.776 | 0.657 | 0.498 | 0.457 | 0.401 | 0.372 | … | 0.350 | 0.362 | |
| DAO16 | 20.69 | 19.55 | … | 18.54 | … | … | 18.38 | 18.33 | … | … | … | … | … | … | … |
| 0.342 | 0.068 | … | 0.122 | … | … | 0.073 | 0.056 | … | … | … | … | … | … | … | |
| DAO23 | 21.10 | 20.49 | 20.11 | 19.41 | 19.45 | 19.47 | 19.16 | 19.18 | 19.29 | 19.13 | 19.48 | 19.32 | 19.74 | 19.11 | 19.93 |
| 0.345 | 0.119 | 0.161 | 0.190 | 0.116 | 0.075 | 0.096 | 0.102 | 0.079 | 0.093 | 0.320 | 0.179 | 0.414 | 0.362 | 1.132 | |
| DAO30 | 20.45 | 19.34 | 18.93 | 18.37 | 18.63 | 18.39 | 18.09 | 17.99 | 17.85 | 17.83 | 17.90 | 17.72 | 17.89 | 17.95 | 18.32 |
| 0.374 | 0.088 | 0.094 | 0.107 | 0.083 | 0.049 | 0.057 | 0.043 | 0.031 | 0.043 | 0.116 | 0.049 | 0.106 | 0.190 | 0.359 | |
| DAO40 | 18.22 | 17.55 | 17.80 | 17.87 | 17.64 | … | 17.94 | 17.92 | 16.67 | … | 17.66 | 17.61 | 17.78 | 17.19 | 17.35 |
| 0.058 | 0.031 | 0.051 | 0.092 | 0.050 | … | 0.076 | 0.070 | 0.025 | … | 0.125 | 0.072 | 0.127 | 0.129 | 0.193 | |
| DAO46 | 20.13 | 19.54 | 19.28 | 18.61 | 18.84 | 18.70 | 18.55 | 18.39 | 18.24 | 18.25 | 18.11 | 18.13 | 18.06 | 18.16 | 18.23 |
| 0.260 | 0.100 | 0.133 | 0.133 | 0.097 | 0.060 | 0.070 | 0.056 | 0.039 | 0.052 | 0.140 | 0.071 | 0.125 | 0.241 | 0.376 | |
| DAO47 | 20.24 | 19.23 | 19.03 | 18.60 | 18.90 | 18.84 | 18.90 | 19.01 | 18.76 | 18.64 | 18.72 | 18.46 | 18.48 | 18.09 | 18.08 |
| 0.319 | 0.094 | 0.119 | 0.136 | 0.115 | 0.083 | 0.133 | 0.125 | 0.104 | 0.125 | 0.258 | 0.127 | 0.195 | 0.273 | 0.325 | |
| DAO51 | 19.65 | 18.51 | 18.22 | 17.44 | 17.17 | 16.94 | 16.73 | 16.52 | 16.31 | 16.24 | 16.14 | 15.96 | 16.07 | 15.92 | 15.74 |
| 0.164 | 0.035 | 0.043 | 0.053 | 0.028 | 0.017 | 0.020 | 0.015 | 0.009 | 0.013 | 0.032 | 0.013 | 0.025 | 0.043 | 0.052 | |
| DAO53 | … | 21.07 | 20.12 | 19.81 | 19.40 | 19.08 | 18.70 | 18.58 | 18.24 | 18.24 | 18.11 | 17.97 | 17.85 | 17.86 | 17.79 |
| … | 0.426 | 0.303 | 0.422 | 0.170 | 0.088 | 0.099 | 0.071 | 0.039 | 0.074 | 0.145 | 0.060 | 0.098 | 0.200 | 0.255 | |
| DAO54 | 21.05 | 20.30 | 19.78 | 19.12 | 18.69 | 18.61 | 18.20 | 18.13 | 17.81 | 17.81 | 17.63 | 17.63 | 17.46 | 17.36 | 17.18 |
| 0.593 | 0.190 | 0.204 | 0.195 | 0.082 | 0.051 | 0.058 | 0.045 | 0.023 | 0.036 | 0.087 | 0.041 | 0.059 | 0.118 | 0.146 | |
| DAO69 | 18.75 | 17.91 | 17.70 | 17.83 | 18.25 | 17.77 | 17.84 | 18.15 | 17.68 | 17.92 | 18.25 | 17.55 | 18.03 | 17.99 | 17.67 |
| 0.119 | 0.043 | 0.039 | 0.045 | 0.093 | 0.100 | 0.063 | 0.099 | 0.046 | 0.070 | 0.143 | 0.055 | 0.128 | 0.184 | 0.246 | |
| DAO84 | … | 19.81 | 19.42 | 19.25 | 19.26 | 19.39 | 19.11 | 18.75 | 18.48 | 18.89 | 18.71 | 18.50 | 18.54 | 18.30 | 18.69 |
| … | 0.294 | 0.070 | 0.186 | 0.145 | 0.137 | 0.140 | 0.077 | 0.074 | 0.147 | 0.168 | 0.108 | 0.266 | 0.168 | 1.008 | |
| V202 | 20.42 | 19.04 | 18.98 | 19.03 | 19.13 | … | 19.38 | 19.67 | … | … | … | … | … | … | … |
| 0.286 | 0.076 | 0.087 | 0.115 | 0.169 | … | 0.344 | 0.474 | … | … | … | … | … | … | … | |
| V203 | 19.07 | 18.98 | 19.18 | 19.38 | 17.23 | … | … | … | 17.07 | … | … | … | … | 18.28 | … |
| 0.075 | 0.251 | 0.083 | 0.103 | 0.016 | … | … | … | 0.023 | … | … | … | … | 0.126 | … | |
| V226 | 20.82 | 19.34 | 20.01 | 19.84 | 18.66 | 19.54 | 19.60 | 19.84 | 17.14 | 19.25 | 19.44 | 19.60 | … | 17.57 | … |
| 0.339 | 0.293 | 0.086 | 0.083 | 0.034 | 0.084 | 0.105 | 0.112 | 0.019 | 0.127 | 0.174 | 0.216 | … | 0.064 | … |
| ID | |||||||||||||||
|---|---|---|---|---|---|---|---|---|---|---|---|---|---|---|---|
| (1) | (2) | (3) | (4) | (5) | (6) | (7) | (8) | (9) | (10) | (11) | (12) | (13) | (14) | (15) | (16) |
| V234 | 19.09 | 18.55 | 18.15 | 17.96 | 17.74 | 17.59 | 17.33 | 17.33 | 16.86 | 17.08 | 16.87 | 16.67 | 16.47 | 16.44 | 16.45 |
| 0.077 | 0.154 | 0.038 | 0.041 | 0.053 | 0.052 | 0.063 | 0.058 | 0.057 | 0.071 | 0.074 | 0.080 | 0.080 | 0.086 | 0.095 | |
| V245 | 18.91 | 19.24 | 18.77 | 19.26 | 18.51 | 19.90 | 21.47 | … | 17.13 | … | … | … | … | … | … |
| 0.081 | 0.291 | 0.040 | 0.051 | 0.012 | 0.025 | 0.059 | … | 0.009 | … | … | … | … | … | … | |
| BA28 | … | 20.67 | 20.17 | 19.68 | 19.68 | 19.48 | 18.65 | 18.58 | 18.32 | 18.35 | 17.80 | 17.94 | 17.80 | 17.74 | 18.69 |
| … | 0.453 | 0.285 | 0.222 | 0.269 | 0.649 | 0.129 | 0.090 | 0.045 | 0.096 | 0.086 | 0.071 | 0.109 | 0.145 | 0.665 | |
| SH07 | 18.49 | 17.57 | 17.66 | 17.41 | 17.05 | 16.85 | 16.63 | 16.55 | 16.34 | 16.35 | 16.23 | 16.02 | 16.03 | 15.98 | 15.88 |
| 0.075 | 0.024 | 0.013 | 0.056 | 0.030 | 0.017 | 0.026 | 0.013 | 0.020 | 0.037 | 0.016 | 0.015 | 0.029 | 0.045 | 0.045 | |
| BH10 | … | 20.49 | 20.31 | 19.29 | 19.29 | 19.39 | 18.91 | 18.70 | 18.69 | 18.77 | 18.85 | 18.60 | 19.06 | 18.43 | 18.70 |
| … | 0.300 | 0.422 | 0.263 | 0.193 | 0.182 | 0.173 | 0.130 | 0.119 | 0.156 | 0.362 | 0.177 | 0.401 | 0.393 | 0.644 | |
| B515 | … | 19.93 | 19.77 | 19.16 | 18.70 | 18.65 | 18.37 | 18.20 | … | 17.87 | 17.87 | 17.73 | … | 17.66 | … |
| … | 0.394 | 0.074 | 0.042 | 0.037 | 0.033 | 0.052 | 0.036 | … | 0.057 | 0.072 | 0.076 | … | 0.074 | … | |
| B521 | … | 19.72 | 19.71 | 19.87 | 19.23 | 18.96 | 19.00 | 19.00 | 18.68 | 18.67 | 18.61 | 18.43 | 18.30 | 17.90 | 17.72 |
| … | 0.130 | 0.214 | 0.379 | 0.158 | 0.101 | 0.141 | 0.130 | 0.094 | 0.119 | 0.228 | 0.109 | 0.154 | 0.197 | 0.235 | |
| B524 | … | … | 19.99 | 20.03 | 19.71 | 19.88 | 19.21 | 19.28 | 19.42 | 18.91 | 19.19 | 18.95 | 18.25 | 18.49 | 18.40 |
| … | … | 0.274 | 0.218 | 0.160 | 0.206 | 0.136 | 0.117 | 0.205 | 0.138 | 0.235 | 0.210 | 0.148 | 0.184 | 0.248 |
| ID | ||||||||||
|---|---|---|---|---|---|---|---|---|---|---|
| (1) | (2) | (3) | (4) | (5) | (6) | (7) | (8) | (9) | (10) | (11) |
| B189D | 17.87 | 0.094 | 18.07 | 0.090 | 18.01 | 0.072 | 17.88 | 0.053 | 17.92 | 0.344 |
| B193D | … | … | 18.40 | 0.180 | 17.62 | 0.177 | 17.50 | 0.105 | 17.06 | 0.318 |
| G289 | 14.43 | 0.008 | 13.50 | 0.001 | 12.33 | 0.002 | 12.04 | 0.001 | 11.44 | 0.002 |
| G295 | 12.61 | 0.002 | 12.18 | 0.001 | 11.64 | 0.001 | 11.65 | 0.001 | 11.18 | 0.002 |
| NB34 | … | … | … | … | … | … | 17.31 | 0.179 | … | … |
| NB61 | … | … | … | … | … | … | 18.58 | 0.760 | 16.11 | 0.273 |
| AU008 | … | … | … | … | 18.05 | 0.587 | 17.13 | 0.306 | … | … |
| AU010 | 18.81 | 0.903 | 18.52 | 0.940 | 17.42 | 0.843 | 16.63 | 0.498 | … | … |
| DAO16 | 19.43 | 0.247 | … | … | … | … | … | … | … | … |
| DAO23 | 20.01 | 0.275 | 19.68 | 0.195 | 19.30 | 0.105 | 19.40 | 0.079 | 18.68 | 0.939 |
| DAO30 | 19.20 | 0.276 | 18.56 | 0.111 | 18.27 | 0.061 | 17.95 | 0.031 | 17.34 | 0.329 |
| DAO40 | 17.11 | 0.054 | 18.03 | 0.093 | … | … | 16.78 | 0.025 | 17.20 | 0.210 |
| DAO46 | 19.04 | 0.214 | 18.83 | 0.138 | 18.70 | 0.075 | 18.35 | 0.039 | 17.74 | 0.373 |
| DAO47 | 19.02 | 0.245 | 18.76 | 0.141 | 18.89 | 0.142 | 18.86 | 0.104 | 18.09 | 0.386 |
| DAO51 | 18.39 | 0.119 | 17.80 | 0.054 | 16.91 | 0.021 | 16.41 | 0.009 | 15.86 | 0.060 |
| DAO53 | … | … | 20.10 | 0.429 | 18.91 | 0.106 | 18.34 | 0.039 | 17.60 | 0.280 |
| DAO54 | 19.91 | 0.464 | 19.49 | 0.201 | 18.41 | 0.062 | 17.91 | 0.023 | 17.25 | 0.164 |
| DAO69 | 17.58 | 0.096 | 17.84 | 0.050 | 17.76 | 0.078 | 17.78 | 0.046 | 17.95 | 0.271 |
| DAO84 | … | … | 19.41 | 0.189 | 19.37 | 0.149 | 18.58 | 0.074 | 17.89 | 0.768 |
| V202 | 19.08 | 0.215 | 19.13 | 0.122 | … | … | … | … | … | … |
| V203 | 18.14 | 0.308 | 19.94 | 0.105 | … | … | 17.17 | 0.023 | … | … |
| V226 | 19.45 | 0.423 | 20.26 | 0.085 | 19.55 | 0.115 | 17.25 | 0.019 | … | … |
| V234 | 18.02 | 0.193 | 18.18 | 0.043 | 17.47 | 0.068 | 16.96 | 0.057 | 16.16 | 0.124 |
| V245 | 18.12 | 0.356 | 19.44 | 0.052 | … | … | 17.23 | 0.009 | … | … |
| BA28 | … | … | 19.91 | 0.238 | 18.99 | 0.251 | 18.42 | 0.045 | 16.80 | 0.506 |
| SH07 | 17.30 | 0.059 | 17.67 | 0.056 | 16.78 | 0.027 | 16.44 | 0.020 | 15.79 | 0.059 |
| BH10 | … | … | 19.64 | 0.282 | 19.19 | 0.188 | 18.80 | 0.119 | 18.39 | 0.672 |
| B515 | … | … | 19.52 | 0.046 | 18.57 | 0.054 | … | … | … | … |
| B521 | … | … | 20.11 | 0.383 | 19.04 | 0.151 | 18.78 | 0.094 | 18.01 | 0.282 |
| B524 | … | … | 20.22 | 0.229 | 19.45 | 0.157 | 19.53 | 0.205 | 18.08 | 0.277 |