A failed outburst of H 1743-322
Abstract
We report on a campaign of X-ray and soft -ray observations of the black hole candidate H 1743-322 (also named IGR J17464-3213), performed with the RXTE, INTEGRAL and Swift satellites. The source was observed during a short outburst between 2008 October 03 and 2008 November 16. The evolution of the hardness-intensity diagram throughout the outburst is peculiar, in that it does not follow the canonical pattern through all the spectral states (the so called q-track pattern) seen during the outburst of black-hole transients. On the contrary, the source only makes a transition from the Hard State to the Hard-Intermediate State. After this transition, the source decreases in luminosity and its spectrum hardens again. This behaviour is confirmed both by spectral and timing analysis. This kind of outburst has been rarely observed before in a transient black hole candidate
keywords:
X-rays: binaries – X-rays: stars – X-rays: individual: IGR J17464–3213 – H 1743–322 – black hole candidate1 Introduction
During the outbursts of transient black hole candidates (BHCs), in addition to the large changes in X-ray luminosity, marked variations are observed in the properties of the timing and the energy spectrum often on very short time scales (see e.g. Belloni et al. 2005). We still do not have a detailed understanding of all the mechanisms that lead to changes in the X-ray emission properties, but the physics involves the structure of the accretion flow around the black hole as well as the connection between the accretion disc and the steady or impulsive jets that can be emitted from these systems. The main cause of the changes in the X-ray emission properties is the variation of the mass accretion rate onto the black hole; however some phenomena indicate that other parameters are also important (e.g. Homan et al. 2001).
From the observational point of view, the emission properties of accreting black holes are often classified in terms of observed spectral and timing parameters. From their combination, a number of source states have been identified (Belloni et al. 2005; Belloni 2009, for an alternative definition, see Remillard & McClintock 2006).
The high-energy spectra can be described as the combination of a soft thermal component together with a hard power law component. The latter component often shows a cutoff at high energies (Tanaka & Shibazaki, 1996). This decomposition is the simplest phenomenological model. However for the hard component complex models can be used as for example the Comptonization models (see e. g. Titarchuk 1985; Poutanen & Svensson 1996). The simplest decomposition is less model dependent and provides at least a qualitative measurement of the behaviour of the source. The power density spectra, used to characterise the fast variability, show a combination of power-law and Lorentzian components. When the Lorentzians are zero-centered, they are referred to as “band-limited noise”, while if they are narrow they are called Quasi-Periodic Oscillations (QPO, see e.g. Belloni, Psaltis & van der Klis 2002). Another important observable that can be used to trace source states is the total amount of variability in the 0.1-64 Hz band, expressed in terms of fractional integrated rms (see e.g. Belloni et al. 2005; Homan & Belloni 2005; Belloni 2009).
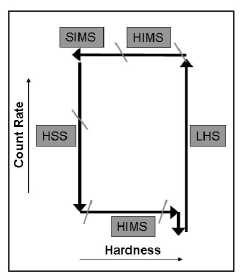
A BHC spends its time mostly in a quiescent state at low flux level ( 1032–1033 ergs s-1, e.g. Campana, Parmar & Stella 2001). When the outburst begins, the luminosity of the source increases and the X-ray spectrum is dominated by a power law component with a hard photon index of 1.4-1.5 and a high-energy cutoff around 100 keV (low/hard state, hereafter LHS). The radio emission in this state indicates the presence of steady jets, while the power spectrum is dominated by a strong band limited noise (30% fractional rms). Then the outburst evolves as the source increases its luminosity and its spectrum starts to change: the soft thermal component appears and becomes increasingly important, the energy peak of the emission softens and the photon index of the hard component steepens ( 2.0-2.5). Two different states with these spectral characteristics have been defined: the hard intermediate state (HIMS) and the soft intermediate state (SIMS). The characteristics of these two states are quite complex: the changes can be established mostly by the timing properties (Homan & Belloni, 2005) and also by the ejection of relativistic jets associated to the transition from HIMS to SIMS. After the SIMS, the source enters a state where the X-ray spectrum is dominated by the emission of the soft thermal component (high/soft state, hereafter HSS). A non-thermal power law tail is also present without any detectable cutoff, while the power spectrum is characterised by a low-level (1-2% fractional rms) variability. Then the flux starts to decrease, most likely following a parallel decrease in accretion rate. At some point, a reverse transition is started and the path is followed backwards all the way to the LHS and then to quiescence. As mentioned above, the luminosity level of this back-transition is always lower than that of the corresponding forward-transition. The description above is the basic general pattern (the so-called ”q-track” pattern in the hardness-intensity diagram (see Figure 1); several examples of ”q-track” patterns are reported in Homan & Belloni 2005 or in Dunn et al. 2009 in prep.), which has been modeled after repeated outbursts of GX 339-4 (Fender, Belloni & Gallo, 2004; Belloni et al., 2005; Homan & Belloni, 2005; Del Santo et al., 2008; Belloni, 2009). During the HSS, minor transitions to SIMS and HIMS have been observed also in GX 339-4 (e.g. Casella et al. 2004; Belloni et al. 2005; Del Santo et al. 2009). Other sources behave in a more complicated way, but the general classification into four states holds for all of them (see e.g. Revnivtsev, Sunyaev & Borozdin 2000; Frontera et al. 2001; Chaty et al. 2003; Hynes et al. 2003). Interestingly, until now all black-hole transients have shown two types of behaviour: after the initial LHS, most sources show a transition to the HIMS at a luminosity level which is always different and might be related to the previous history of the transient (Yu et al., 2007). If this transition takes place, the source always reached the HSS. However, a few sources (both NS and BHC X-ray binaries) never left the LHS at all as reported for example by Brocksopp et al. (2004) for V404 Cyg, A1524-62, 4U1543-475, GRO J0422+32, GRO J1719-24, GRS1737-21 and GS 1354-64, by Sturner & Shrader (2005) for XTE1550-564 and by Rodriguez, Show & Corbel (2006) for Aql X-1. The only possible exception to this dichotomy is represented by SAX J1711.6–38 (see Wijnands & Miller 2002), a faint transient X-ray binary classified as BHC (Liu et al., 2007).
In this paper we present the results of the RXTE, Swift and INTEGRAL data analysis of the last outburst of the recurrent transient H 1743–322 during which only two states were sampled: the LHS and the HIMS. It is the first time that this kind of outburst is analysed in detail showing that the evolution of the BHC outbursts, through the different spectral states, is still difficult to predict.
1.1 Short History of H 1743–322
On 2003 March 21 INTEGRAL (MJD=52719) detected a relatively bright source (60 mCrab at 15-40 keV) named IGR J17464–3213. The source was localised at R.A. (2000) , Dec. , with an error box of 1.6 arcmin (90% confidence) and then associated with H 1743–322 (Markward & Swank, 2003; Revnivtsev et al., 2003), a bright BHC observed by HEAO-1 in 1977 with an intensity of 700 mCrab in the 2-10 keV (Doxsey, Bradt & Fabbiano, 1977). The outburst evolution of 2003 was followed by RXTE and INTEGRAL reporting strong flux and spectral variability (Parmar et al., 2003; Homan et al., 2005; Capitanio et al., 2005; Joinet et al., 2005).
H 1743–322, after the first and brightest outburst, also underwent two fainter outbursts on September 2004 and September 2005 (Swank, 2004; Rupen, Mioduszewski & Dhawan, 2005; Capitanio et al., 2006). On January 2008 a third outburst was detected by RXTE/ASM (Kalemci et al., 2008). Then a Swift ToO was granted in order to follow the source evolution (Capitanio et al., 2008a, b). Seven months later (on September 23, MJD=54732), another outburst was detected by INTEGRAL during the Galactic bulge monitoring (Kuulkers et al., 2008) showing that the source was in a hard state with an increasing flux. Swift, RXTE and INTEGRAL followed the outburst evolution. Furthermore, on October 23 (MJD=54762) an RXTE observation of H 1743–322 indicated that the source had undergone a state transition from the LHS to the HIMS (Belloni et al., 2008). The study reported in this paper is focused on the last part of this outburst. Some preliminary results of these observations were already reported in various ATels (see e.g. Ricci et al. 2008 and reference therein), while results on the early phase of the outburst are presented in Prat et al. (2009).

2 Observation and analysis
The RXTE campaign of pointed observations covers the period of the outburst starting from MJD=54740 (2008 October 10) to MJD=54775 (2009 November 5) for a total of 37 pointings with a total exposure time of 65.5 Ks. The PCA and HEXTE data analysis was performed with the standard RXTE software within HEASOFT V6.6 following the standard extraction procedure. For spectral analysis only PCA2 for PCA and cluster B for HEXTE were used. A systematic error of 0.6% (Wilms et al., 2006) was added to the PCA spectra. For the fitting, the energy ranges 3-20 keV and 20-130 keV were used for PCA and HEXTE respectively.
For the timing analysis of the PCA data, for each of the observations, we produced power spectra from 64-s stretches accumulated in the channel band 0-35 (2-15 keV) with a time resolution of 1/1024 s. The resulting power spectra were then averaged, resulting in one power spectrum per observation. The power spectra were normalised according to the description by Leahy et al. 1983 and converted to squared fractional rms (Belloni & Hasinger, 1990; Myiamoto et al., 1991). The contribution due to Poissonian statistics was subtracted (see Zhang et al. 1995). The timing analysis was performed with custom software.
During the 2008 October outburst a public INTEGRAL ToO campaign was carried out (Ricci et al. 2008 and references therein). Three observations were performed respectively in 2008 October 10 (65 ks, MJD=54749), October 22 (86 ks,MJD=54761) and October 28 (80 ks,MJD=54767 ) with a total of 136 science windows (SCW)111 A SCW is a unit of INTEGRAL continuous observing time that is at the base of the INTEGRAL data processing. of about 2500 s each (INTEGRAL revolutions 732, 734 and 736). In order to obtain a wider energy range for the spectra, our analysis was focused on ISGRI (Lebrun et al., 2003), the low energy detector of the -ray telescope IBIS (Ubertini et al., 2003). The data of the INTEGRAL spectrometer SPI were not used because of the low angular resolution of the instrument (for details see Verdenne et al. 2003). For the ISGRI data analysis we used the latest release of the standard Offline Scientific Analysis (OSA) version 7. The ISGRI energy range considered for the fitting is 20-200 keV with a systematic error of 2% as usual in the INTEGRAL spectral analysis (see also Jourdain et al. 2008). The ISGRI light curve was obtained by extracting the source count rate from the images in the 40-100 keV band for each SCW.
A Swift ToO was also performed with three pointings. We extracted the XRT spectra of the Window-Timing (WT) mode pointings ( less affected by pile-up) in order to better constrain the equivalent hydrogen column. The data were processed with the standard Swift tools: XRT software version 0.12.2 and FTOOLS version 6.6.2 Only the second WT mode Swift/XRT observation was performed simultaneously with RXTE and INTEGRAL and thus it was used to obtain a joint spectrum with the other instruments (see the bottom panel of Figure 8). The Swift /BAT transient monitor light curve was provided by the Swift /BAT team222http://swift.gsfc.nasa.gov/docs/swift/results/transients/index.html.
3 Results
3.1 Outburst Evolution
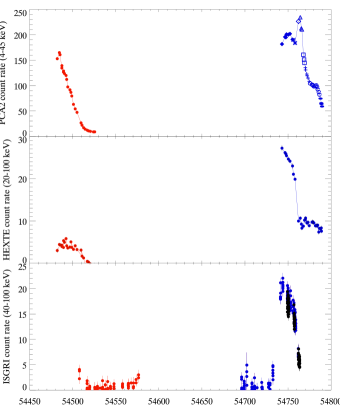
The 2008 October outburst of H 1743-322 was quite short, and fainter than the previous ones (see Figure 2). In Figure 3 we show the temporal behaviour of H 1743-322 in different energy ranges. For a direct comparison with the previous outbursts of the source, we show in the figure, as an example, also the light curves of the January 2008 outburst. During the January 2008 outburst the source reached the HSS (Kalemci et al., 2008) showing the standard q-track behaviour as for the previous outbursts of H1743-322 (see for example Capitanio et al. 2005, 2006; McClintock et al. 2007). The top panel and the middle panel represent respectively the 4-45 keV (RXTE/PCA) and the 20-100 keV (RXTE/HEXTE) light curves. Both curves are binned to a single observation. The bottom panel shows the INTEGRAL IBIS/ISGRI 40-100 keV light curve, binned to a SCW 333 The data are taken from both the public archive of the INTEGRAL Galactic Bulge Monitoring., http://isdc.unige.ch/Science/BULGE/ and from the 2008 public INTEGRAL ToO.. The first outburst, was observed by RXTE only during the return to the quiescent state. The monitoring of the most recent outburst (blue curve) was more complete even though RXTE missed the rising phase of the outburst and its coverage ended before the full return to quiescence. The INTEGRAL monitoring started at the end of the January outburst; a good coverage was only achieved during the October outburst (bottom panel of Figure 3). Figure 4 shows the Swift /BAT daily averaged light curve (15-50 keV) of the two 2008 outbursts of H1743-322.

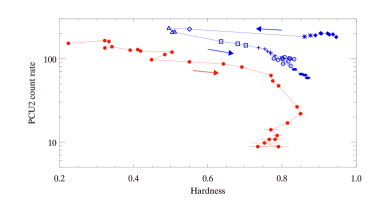
The HIDs of the two outbursts are compared in Figure 5: for the first outburst (red curve), the PCA caught the source at the end of the q-track diagram (see Belloni et al. 2005; Belloni 2009), when the energy spectrum of H 1743–322 was hardening again through the HIMS, then moving vertically downward along the LHS branch returning to quiescence. For the second outburst, after the initial LHS rise (missed by RXTE ) the source moves horizontally to the left, softening, then jumps to a much softer location, from which it slowly returns to the hard track along a diagonal path. Clearly, the final hard state is also missed. As Figure 5 shows, the softest points of the second outburst reach only intermediate values of the hardness (0.5) that correspond in the previous outburst to the HIMS. This fact is confirmed also by the HEXTE light curve of the two outbursts (see middle panel of Figure 3 red and blue curves): the ratio between the PCA and HEXTE fluxes shows that the October outburst is clearly harder than the January one.
3.2 Timing Analysis
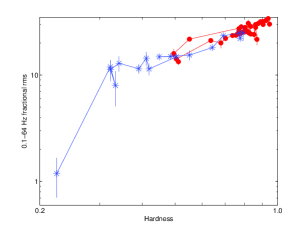
Figure 6 shows the Hardness-rms diagram for both 2008 outbursts. Also from this figure it is evident that the October outburst saw the source remaining at a high level of variability, with integrated fractional rms always above 10%. In contrast, in January the sampling of the final part of the outburst, started at a low hardness and little variability (around 1%). Together with the HID, this figure suggests that in October the source never left the HIMS.
Inspection of the power-density spectra of the October outburst confirms this hypothesis. Band-limited noise is seen in all cases. All observations show a type-C QPO (see Remillard et al. 2002) with the exception of that of October 25 (MJD=54764), the softest of the sample. However, the observations before and after, on October 23 (MJD=54762) and 27 (MJD=54766), show a QPO evolving from 5.6 Hz to 6.7 Hz, with an rms decreasing from 5.5% to 3.1%. The 3 upper limit for a 6 Hz QPO with the same FWHM (around 0.4 Hz) for October 25 is 3.3%, which makes the non-detection compatible with neighboring observations.
From timing analysis, we can conclude that all observations of the October outburst indicate H 1743-322 being in the HIMS, a state characterised by the presence of a type-C QPO and intermediate hardness.
3.3 Spectral Analysis
We analysed all the RXTE pointed observations in order to study the source spectral behaviour. The data were fitted with a simple model consisting of an absorbed disc blackbody plus a cutoff power-law component. From the analysis of the Swift/XRT data an equivalent hydrogen column value of NH=(1.60.1)1022 atoms cm-2 was derived and in all the other fits the NH was fixed to the value derived from the Swift data analysis. To account for cross-calibration problems between the three different instruments (PCA, HEXTE, IBIS/ISGRI), multiplicative constants were added to the fits. An emission line with centroid fixed at 6.4 keV was needed to obtain good fits. The relative change of the disc inner radius is derived from the square root of the disk black body component normalisation constant (for details see Mitsuda et al. 1984). After a detailed study of each pointing, we averaged the spectra of contiguous observations with consistent spectral parameters. Table 1 summarises our results, while the unfolded spectra of different groups of observations are presented in Figure 7. Each spectrum was rebinned with HEASOFT V6.4 tool GRPPHA in order to get an adequate signal to noise ratio. Concerning the first group of spectra, (a) in Table 1, the best fit model is described by a disk black body with an internal temperature of about 1 keV plus a high-energy power law component with a photon index of about 1.3 and a cutoff of 75 keV. The second group of spectra, (b), is characterised by a softening of the photon index together with the decrease of the 0.1-500 keV flux (see Table 1).
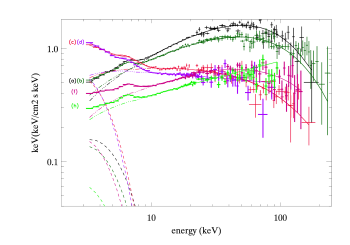
Between the observations (b) and (c), the spectrum changes fast: the cutoff reaches a value of about 100 keV (red curve in Figure 7). Two days after (spectrum (d)) the cutoff is no longer detectable; at the same time the photon index becomes softer. The disc black body inner radius increases its value by about 70% during the softening while the inner temperature remains contant (see Table 1).
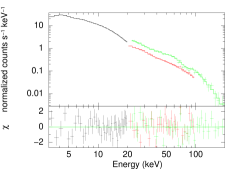
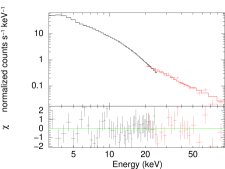
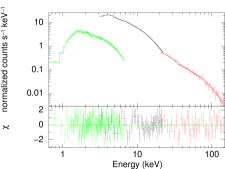
After October 30 the source spectra (e) and (f) harden again: in accordance with the HID, the cutoff is again detectable at about 109 keV. Both the inner radius and the photon index approach values similar to those observed in the first two groups of observations (see Table 1). We show in Figure 8 (bottom panel) the (f) spectrum fitted jointly with the simultaneous Swift/XRT window timing observations. This spectrum confirms the presence of the disk black body component and the fit parameters are all consistent within the errors with the RXTE spectrum (see Table 1). While the top and the middle panels show respectively the (a) and (d) spectra.
At the end of the outburst (spectra (g) and (h)) the flux slightly continues to decrease, the inner temperature of the disk still remains unvaried, while it is no more possible to constrain the cutoff. Note, however that the last INTEGRAL observation, that permits to extend the spectrum up to 200 keV, was performed in the 2008 October 23 (MJD=54762) (spectrum (c)). Thus, the spectra taken after October 23 cover only energy range from 3 to 130 keV. This fact limits the possibility to constrain the cutoff for observations after that date.
| ID | date | date | Tin | R | Ec | FLUX(0.1-500) | FLUX(2-10) | FLUX(10-100) | d.o.f. | ||
| - | mm/dd | MJD | keV | Km | - | keV | (erg s-1cm-2) | (erg s-1cm-2) | (erg s-1cm-2) | - | - |
| - | (2008) | - | - | - | - | - | 10-9 | 10-9 | 10-9 | - | - |
| (a) | 10/03-10/16 | 54742-54755 | 1.1 | 4 | 1.23 | 64 | 8.9 | 1.7 | 5.0 | 1.1 | 96 |
| (b) | 10/17-10/19 | 54756-54758 | 1.0 | 5 | 1.45 | 84 | 8.1 | 1.7 | 4.1 | 1.0 | 104 |
| (c) | 10/23 | 54762 | 0.83 | 16 | 1.9 | 109 | 10 | 2.8 | 2.0 | 1.1 | 92 |
| (d) | 10/25-10/27 | 54764-54767 | 0.79 | 20 | 2.10 | – | 12 | 2.9 | 2.1 | 1.0 | 61 |
| (e) | 10/28-10/30 | 54767-54769 | 0.72 | 15 | 1.95 | – | 7.1 | 1.8 | 2.2 | 1.0 | 65 |
| (f)444 Swift/XRT, RXTE/PCA and RXTE/HEXTE joint spectrum | 10/31-11/04 | 54770-54774 | 0.82 | 6 | 1.60 | 104 | 5.1 | 1.2 | 2.1 | 0.9 | 215 |
| (g) | 11/07-11/16 | 54776-54786 | 0.80 | 5 | 1.71 | – | 6.7 | 0.9 | 2.1 | 1.0 | 68 |
| (h) | 11/18-11/19 | 54788-54789 | 1.0 | 3 | 1.60 | – | 5.3 | 0.6 | 1.7 | 1.1 | 51 |
4 discussion
At first inspection the shape of the HID of H 1743-322 suggests a normal evolution of the October outburst: (missed) hard state, followed by a HIMS, a fast jump to the soft state (with or without a sampling of the SIMS), then a return path at lower flux. However, the softest points are only at an intermediate hardness, which, in the previous outburst, for example, corresponded to the HIMS. The hardness is only a rough indication of the spectral shape and similar states have been seen to correspond to slightly different hardness values even in different outbursts of the same source. Anyway the lack of soft states is an important fact and possibly suggests that the soft state was never reached. This fact, only supposed by the study of the HID, is confirmed by the results of the timing analysis. The spectral analysis, in accordance with the HID, sampled the softening of the source: the flux of the black body component increases and the Rin decreases. This means that the disk approaches the last stable orbit, while, curiously, the Tin remains substantially unvaried being also quite high for a HIMS.
As far as we know, this is the first time that an outburst, that left the LHS and does not reach the HSS, has ever been studied in detail. Searching for similar cases in the literature, we have found only one outburst comparable with our results, the one of SAX J1711.6–3808 in 2001. This outburst was not covered very densely, but its softest observation showed a power spectrum and a total fractional rms typical of the HIMS, while the slope of the hard part of the energy spectrum hardly reached 2.4 (Wijnands & Miller, 2002). Also in this case we have an HIMS with an relatively high inner-disk temperature as 0.860.04 keV (Wijnands & Miller, 2002) and a luminosity consistent with the softest state of H 1743-322. We conclude that we observed from H 1743-322 a failed outburst. In fact the source, even if softens, it never reaches the HSS during the 2008 October outburst.
The range in luminosities of hard-to-soft transitions in black-hole binaries observed with RXTE is 0.2-1 LEdd (Chen et al., 1997). Interestingly, the lowest transitions, at 0.2 LEdd, are those observed from Cyg X-1, which also does not reach very soft spectral hardnesses (see Wilms et al. 2006; Belloni 2009). Similarly, we found that the luminosity of the softest state of H 1743-322 outburst (spectrum (d) in Table 1), computed in unit of Eddington luminosity, is L0.1 LEdd ( considering a mass of 10 M⊙ and a distance of 10 kpc as estimated for H 1743-322 by McClintock et al. 2007). Although the mass accretion rate is a very important parameter involved in the transition, another parameter seems to prime the transition out from the hard state. This second parameter, whose nature is still not clear (Esin et al., 1997; Homan et al., 2001), drove the October 2008 transition from the LHS to HIMS. Then probably an accretion rate decrease did not permit to continue the canonical transition pattern to the HSS. This means that the source did not pass the jet-line in the HID (see Homan & Belloni 2005) and probably there was not any jet major ejection (Fender, Belloni & Gallo, 2004). This despite the fact that the inner disk radius was seen to decrease and according to the Fender, Belloni & Gallo (2004) model the acceleration of the jet to higher Lorentz factor had already started. The results reported in this paper demonstrate that the processes starting at the beginning of the outburst can be reversible even after the transition to HIMS.
Other cases previously presented in literature as failed outbursts of transient X-ray binaries, are LHS-only outbursts without any sign of state transitions at all (see e.g. Brocksopp et al. 2004 and Sturner & Shrader 2005). Conversely, the data presented here show that the full pattern (LHS, HIMS, SIMS, HSS) and LHS-only pattern are not the only two possibilities for the temporal evolution of a BHC outburst.
The October 2008 outburst of H 1743-322, showing only LHS and HIMS, takes place at low luminosity (L0.1 LEdd) and the lack of soft-state transitions is probably connected to a premature decrease of the mass accretion rate. Again, this bring us back to one of the major problems for the interpretation of the spectra/timing evolution of the outbursts: what physical parameter determines the transitions starting from the low hard state.
Acknowledgements
This work has been supported by the Italian Space Agency through grants I/008/07/0 and I/088/06/0. TMB acknowledges support from the International Space Science Institute. We acknowledge the use of public data from the Swift data archive and all the Swift team for its support. Our particular thanks goes to Dr. J. M. Miller and his colleagues who immediately returned to the scientific community their INTEGRAL ToO data.
References
- Belloni (2009) Belloni, T., 2009, in “The jet paradigm: from microquasars to quasars”, Ed. T. Belloni, Springer, in press
- Belloni et al. (2008) Belloni, T., Homan J.,, Yamaoka, K., Swank, J. 2008, ATel 1804
- Belloni et al. (2005) Belloni, T., Homan, J., Casella, P., van der Klis, M., Nespoli, E., Lewin, W. H. G., Miller, J. M., Méndez, M., 2005, A&A, 440, 207
- Belloni, Psaltis & van der Klis (2002) Belloni, T., Psaltis, D., van der Klis, M., 2002, ApJ, 572, 392
- Belloni & Hasinger (1990) Belloni, T., Hasinger, G., 1990, A&A, 230, 103
- Brocksopp et al. (2004) Brocksopp, O., Bandyopadhyay, R. M., Fender, R. P., 2004, New Astr.,9, 249
- Campana, Parmar & Stella (2001) Campana, S., Parmar, A. N., Stella, L., 2001, A&A, 372, 241.
- Capitanio et al. (2005) Capitanio, F. et al., ApJ, 2005, 622, 503.
- Capitanio et al. (2006) Capitanio, F., Bazzano, A., Ubertini, P, Bird, A. J., 2006, PoS (MQW6) VI Microquasar Workshop Proc. 074
- Capitanio et al. (2008a) Capitanio, F., Del Santo, M., Bazzano, A., ATel 1385, 2008
- Capitanio et al. (2008b) Capitanio, F., Del Santo, M., Bazzano, A., ATel 1414, 2008
- Casella et al. (2004) Casella, P., Belloni, T., Homan, J., Stella, L., 2004, A&A 426, 587
- Chaty et al. (2003) Chaty, S., Haswell, C.A., Malzac, J., Shrader, C. R., Cui, W., 2003, MNRAS, 346, 689
- Chen et al. (1997) Chen, W., Shrader, C. R., & Livio, M., 1997, ApJ, 491, 312
- Del Santo et al. (2009) Del Santo, M. et al. 2009 MNRAS, 392, 992
- Del Santo et al. (2008) Del Santo, M., Malzac, J., Jourdain, E., Belloni, T., Ubertini, P., 2008, MNRAS, 390, 227
- Doxsey, Bradt & Fabbiano (1977) Doxsey, H., Bradt, G., Fabbiano, R., 1977, IAUC 3113
- Esin et al. (1997) Esin, A. A., McClintock, J. E., Narayan, R. 1997, ApJ, 489, 865
- Fender, Belloni & Gallo (2004) Fender, R.P., Belloni, T.M., Gallo, E., 2004, MNRAS, 355, 1105
- Frontera et al. (2001) Frontera, F. et al., 2001, ApJ, 561, 1006
- Homan et al. (2001) Homan, J., Wijnands, R., van der Klis, M., Belloni, T., 2001, ApJS, 132, 377
- Homan & Belloni (2005) Homan, J., Belloni, T., 2005, ApSS, 300, 107
- Homan et al. (2005) Homan, J., Miller, J., Wijnands, R., van der Klis, M., Belloni, T., Steeghs, D., Lewin, W. H. G., 2005, ApJ, 623, 383
- Hynes et al. (2003) Hynes, R.I. et al., 2003, MNRAS, 345, 292
- Joinet et al. (2005) Joinet, A., Jourdain, E., Malzac, J., Roques, J. P., Schoenfelder, V., Ubertini, P., Capitanio, F., 2005, ApJ, 629, 1008
- Jourdain et al. (2008) Jourdain E., Gotz D., Westergaard N. J., Natalucci L., Roques J. P., 2008, 7th INTEGRAL Workshop, PoS, 144.
- Kalemci et al. (2008) Kalemci, E., Tomsick, J. A., Yamaoka, K., Ueda, J. 2008 ATel 1348
- Kuulkers et al. (2008) Kuulkers, E. et al. 2008, ATel 1739
- Leahy et al. (1983) Leahy, D. A, Darbro, W., Elsner, R. F., Weisscopf, M. C. Kahn, S., Sutherland, P. G., Grindlay, J. E. 1983, ApJ, 266, 160
- Liu et al. (2007) Liu, Q. Z., van Paradijs, J., van den Heuvel, E. P. J., 2007, A&A, 469, 807
- Lebrun et al. (2003) Lebrun, F. et al. 2003, A&A, 411, L141
- Markward & Swank (2003) Markwardt, C.B., Swank,J.H., 2003 ATel 133.
- McClintock et al. (2007) McClintock j., Remillard R. A., Rupen M. P., Torres M. A. P., Steeghs D., Levine A. M., Oroz J. A., 2007 preprint (astroph 0705.1034)
- Miller et al. (2006) Miller, J. M., Raymond, J., Homan, J., 2006, ApJ, 646, 394
- Myiamoto et al. (1991) Miyamoto, S., Kimura, K., Kitamoto, S., Dotani, T., Ebisawa, K., 1991, ApJ, 383, 784
- Mitsuda et al. (1984) Mitsuda, K. et al. 1984,PASJ, 36, 741
- Parmar et al. (2003) Parmar, A. N., Kuulkers, E., Oosterbroek, T., Barr, P., Much, R., Orr, A., Williams, O. R., Winkler, C., 2003, A&A, 411, 421
- Poutanen & Svensson (1996) Poutanen, J., Svensson, R., 1996, ApJ, 470, 249
- Prat et al. (2008) Prat, L. et al. 2008, ATel 1808
- Prat et al. (2009) Prat, L., Rodriguez, J., Cadolle Bel, M. et al. 2009, A&AL, 494, L21
- Remillard & McClintock (2006) Remillard, R.A., McClintock, J.E., 2006, ARA&A, 44, 49
- Remillard et al. (2002) Remillard, R.A., Sobczak,G.J., Muno, M.P., McClintock, J.E., 2002, ApJ 564, 962
- Revnivtsev et al. (2003) Revnivtsev M., Chernyakova, M., Capitanio, F., Westergaard, N. J., Schoenfelder, V., Gehrels, N., Winkler, C., 2003, ATel 132.
- Revnivtsev, Sunyaev & Borozdin ( 2000) Revnivtsev, M., Sunyaev, R., Borozdin, K., 2000, A&A, 361, L37
- Ricci et al. (2008) Ricci C., Caballero-Garcia M., Beckmann V., Miller J. M., Kuulkers E., 2008, ATel 1779.
- Rodriguez, Show & Corbel (2006) Rodriguez, J., Show, S. E., Corbel. S., 2006, 451, 1045
- Rupen, Mioduszewski & Dhawan (2005) Rupen, M. P., Mioduszewski, A. J., Dhawan, V., 2005, ATel 575
- Sturner & Shrader (2005) Sturner, S. J., Shrader, C. R., 2005, ApJ, 625, 923
- Swank (2004) Swank, J., 2004, ATel 301
- Tanaka & Shibazaki (1996) Tanaka, Y., Shibazaki, N.,1996, Ann. ReV. A&A, 34, 607
- Titarchuk (1985) Titarchuk, L. G., 1994, ApJ 434, 570
- Ubertini et al. (2003) Ubertini, P. et al. 2003, A&A, 411, L131
- Verdenne et al. (2003) Verdenne, G. et al. 2003, A&A, 411, L63
- Wilms et al. (2006) Wilms, J., Nowak, M. A., Pottschmidt, K., Pooley, G. G., Fritz, S., 2006 A&A 447, 245;
- Wijnands & Miller (2002) Wijnands, R., Miller, J.M., 2002, ApJ, 564, 974
- Yu et al. (2007) Yu, W., Lamb, F.K., Fender, R., van der Klis, M., 2007, ApJ, 663, 1309
- Zhang et al. (1995) Zhang, W., Jahoda, K., Swank, J. H., Morgan, E. H., Giles, A. B., 1995, ApJ, 449, 930