Emergence of the stochastic resonance in glow discharge plasma
Abstract
Stochastic resonance (SR) has been studied experimentally in a glow discharge plasma. For the SR phenomena, it is observed that a superimposed subthreshold periodic signal can be recovered via stochastic modulations of the discharge voltage. In the present experiments, induction of SR is quantified using the absolute mean difference (AMD). Comparison of the AMD techniques with respect to cross-correlation has also been shown.
1 Introduction
Stochastic resonance (SR) which has been observed in many physical, chemical and biological systems [1, 2, 3, 4, 5, 6, 7, 8, 9, 11], is a phenomenon in which the response of the nonlinear system to a weak periodic input signal is amplified or optimized by the presence of a particular level of noise [1], i.e. a previously untraceable subthreshold signal applied to a nonlinear system, can be detected in the presence of noise. Furthermore, there exists an optimal level of noise for which the most efficient detection takes place.
In 1993, Gang, et al. [12], and in 1994, Kurt Wiesenfeld, et al. [13], had shown that SR is also possible in different classes of dynamical systems based not on bistability but on excitable dynamics. They proposed a system consisting of a potential barrier (PB) and above this barrier the system shows deterministic dynamics (limit cycle oscillation) and below, stable fixed point as illustrated in Fig 1.
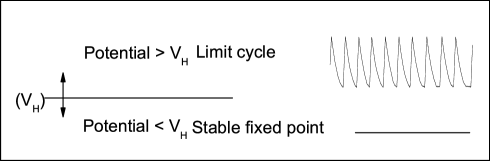
The figure shows that when the control parameter (potential) crosses the PB, i.e., the potential is greater than PB, the system shows a limit cycle behavior and when the potential is less than PB, the system exhibits a stable fixed point behavior. Now if we set the control parameter (potential) below the PB and apply noise (stochastic perturbation on the potential) to the system and whenever the barrier is crossed, the system returns to its fixed point or “rest state” deterministically [12, 13, 14], i.e., whenever the barrier is crossed, the system traverses one oscillation. Now when a subthreshold periodic signal in the form of pulse and noise are added to the system below the potential barrier the probability of crossing the barrier by noise at the time of occurrence of the periodic pulse is maximum and hence one can get back deterministic dynamics in the form of periodic oscillations of frequency of the applied periodic pulse for optimum noise level which is the SR of an excitable system. Based upon excitability, SR has been observed in chemical systems [15], human brain and many other systems [3, 11].
In plasma excitability arises from the most fundamental processes, namely the wave-wave and wave-particle interactions. Different modes may be excited due to nonlinear coupling of waves and plasma components and the character of the oscillations is primarily determined by the plasma parameters and perturbations [16, 17, 18]. In our experiments, we get excitable dynamics, for certain discharge parameters, in the region greater than the Paschen minimum [19] and has been discussed in Section 3.
2 Experimental setup
The experiments were performed in a hollow cathode dc glow discharge plasma. The schematic diagram of the experimental setup is presented in Fig 2.

A hollow stainless steel tube of length and of diameter () 45 mm was used as the cathode and a central rod of length and 1.6 mm was employed as the anode. The whole assembly was mounted inside a vacuum chamber and was pumped down to a pressure of about 0.001 mbar using a rotary pump. The chamber was subsequently filled with the argon gas up to a pre-determined value of neutral pressure by a needle valve. Finally a discharge was struck by a dc discharge voltage (DV), which could be varied in the range of 01000 V.
The noise and subthreshold periodic square pulse generators were coupled with DV through a capacitor [Fig. 2]. In all the experiments DV was used as the bifurcation parameter while the remaining system parameters like pressure etc., were maintained constant. The system observable was the electrostatic floating potential, which was measured using a Langmuir probe of diameter = 0.5 mm and length 2 mm. The tip of this Langmuir probe was placed in the center of the electrode system as indicated in Fig. 2. The plasma density and the electron temperature were determined to be of the order of 107cm-3 and 34 eV respectively. Furthermore, the electron plasma frequency () was estimated to be around 28 MHz, whereas the ion plasma frequency () was estimated to be around 105 kHz.
3 Autonomous dynamics
At high pressures an anode glow and fluctuations in the floating potential were simultaneously observed as shown in Figs. 3(I) and 3(II) respectively. Figs 3I(a) shows that the glow with largest size, appears when the discharge is struck at a typical pressure of 0.95 mbar and its size decreases with increase in the DV until it finally disappears [Figs 3I(a)3II(h)].
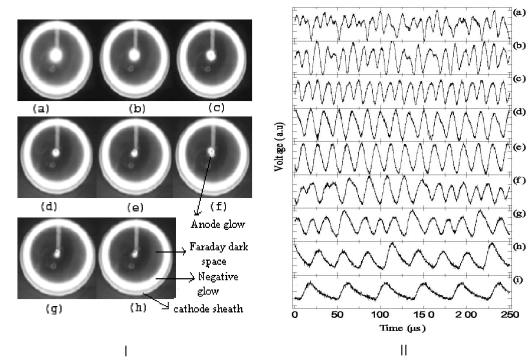
From the CCD image analysis the annular radius of the glow around the anode, was estimated to be mm at the beginning of the discharge [Fig 3I(a)] and reduced to mm [Fig 3I(f)]. Based on the observation of Valentin Pohoaţǎ, et al. [21], we feel that the relaxation oscillations are double layers or such coherent potential structures, which are constantly forming and annihilating. An interesting feature associated with the anode glow was the different types of oscillations in the floating potential at different pressures. The fluctuations in the floating potential fluctuations were irregular at the initial stage of discharge [Fig 3II(a)] and became regular with increase in the DVs Figs 3II(h)3II(i), and finally reaches a stable fixed point through homoclinic bifurcation [20]. The DV at which these oscillations cease may be termed as the bifurcation point () which acts as a PB in this experiment. The floating potential fluctuation exhibits relaxation oscillations on the one side of the and stable fixed point on the other side, which is termed as being in an excitable state and is useful to study SR.
4 Stochastic resonance
For our experiments on SR, the reference voltage was chosen such that and therefore the autonomous dynamics, by virtue of an underlying homoclinic bifurcation, exhibit steady state behavior. The DV was thereafter perturbed , where is the subthreshold periodic pulse train chosen for which , (subthreshold signal does not cause the system to cross over to the oscillatory regime) and is the added Gaussian white noise with amplitude .

Subthreshold periodic square pulse of width and duration 2 ms was constructed using Fluke PM5138A function generator. Meanwhile, the gaussian noise produced using the HP 33120A noise generator was subsequently amplified using a noise amplifier.
Fig. 4 show time series of the system response in the presence of an identical subthreshold signal for three different amplitudes of imposed noise. The subthreshold periodic pulse train is also plotted, in the top most graph of the left panel, for comparison purposes. Fig. 4(a) shows that there is little correspondence between the subthreshold signal and the system response for a low noise amplitude. However, there is excellent correspondence at an intermediate noise amplitude [Fig. 4(b)]. Finally, at higher amplitudes of noise the subthreshold signal is lost amidst stochastic fluctuations of the system response [Fig. 4(c)]. Absolute mean difference (AMD), used to quantify the information transfer between the subthreshold signal and the system response, is defined as . and are the inter-peak interval of the response signal and mean peak interval of the subthreshold periodic signal respectively. Fig 4(d) shows that the experimentally computed AMD versus noise amplitude D curve has a unimodal structure typical for the SR phenomena. The minima in this curve corresponds to the optimal noise level for which maximum information transfer between the input and the output takes place.
5 Discussion
The effect of noise has been studied experimentally near a homoclinic bifurcation in glow discharge plasma system. Our study demonstrates the emergence of SR for periodic subthreshold square pulse signals via purely stochastic fluctuations.
In SR experiments, the efficiency of information transfer was quantified using AMD instead of the power norm which has been utilized elsewhere [5]. The advantage of using this method in comparison to the power norm () [5] lies in the fact that AMD remains independent of the lag between the measured floating potential and the applied periodic square pulse. This is of relevance to our experimental system, where invariably there exists a lag, at times varying in time due to the parameter drifts.

Comparison between the estimated and AMD have been shown in Fig 5. It is obvious from the upper panel of Fig 5 that does not show any peak at optimum noise level. Whereas, AMD shows nice agreement with regular spiking of the signal [Fig 5(lower panel). Derivation of the AMD statistics has been shown in A.
The authors acknowledge A. Bal, S.S. Sil, A. Ram and D. Das and the Micro Electronic Division of SINP for their technical help during the experiments.
Appendix A Absolute mean difference (AMD)
Absolute mean difference (AMD) is the statistical tool, proposed to quantify the SR in a plasma subjected to noise and a periodic signal. AMD is defined as , and gives AMD gives the degree of mimicking the output to the input subthreshold signal. Usually, regularity in the stochastic resonance is quantified by calculating cross-correlation () between the output and input signal. But in case of plasma it is not suitable, because there is always a lag between periodic signal that is applied to the plasma and the output. This lag also varies with time because the plasma conditions keep fluctuating over time. Therefore, cross-correlation is not the right quantity to be estimated. So we have proposed a statistical tool AMD which will be independent of lag and is estimated as follows:
-
1.
First calculate the mean inter-peak distance () of the periodic signal.
-
2.
Calculate the inter-peak distances () of the output signal.
-
3.
Calculate the ()
-
4.
Take the absolute, i.e., .
Therefore, .
References
References
- [1] Roberto Benzi, Alfonso Sutera, and Angelo Vulpiani 1981 J. Phys. A: Math Gen. 14 L453-L457
- [2] Roberto Benzi arXiv:nlin.CD /0702008v1 5 Feb 2007
- [3] Luca Gammaitoni, Peter Hänggi, Peter Jung and Fabio Marchesoni 1998 Rev. Mod. Phys. 70 223
- [4] Bruce Mc Namara, Kurt Wiesenfeld, and Rajarshi Roy 1988 Phys. Rev. Lett. 60 2626
- [5] P. Parmananda, Gerardo J. Escalera Santos, M. Rivera, and Kenneth Showalter 2005 Phys. Rev. E 71 031110
- [6] F. Moss, A. Bulsara, and M. F. Shlesinger 1993 J. Stat. Phys. 70 1
- [7] A. Longtin, A. Bulsara, and F. Moss 1991 Phys. Rev. Lett. 67 656
- [8] A. Föster, M. Merget, and F. W. Schneider 1996 J. Phys. Chem. 100 4442
- [9] T. Amemiya, T. Ohmori, M. Nakaiawa, and T. Yamaguchi 1998 J. Phys. Chem. 102 4537
- [10] G. J. Escalera Santos and P. Parmananda 2002 Phys. Rev. E 65 067203
- [11] Keiichi Kitajo, Daichi Nozaki, Lawrence M. Ward and Yoshiharu Yamamoto 2003 Phys. Rev. Lett. 90 218103
- [12] Hu Gang, T. Ditzinger, C. Z. Ning, and H. Haken 1993 Phys. Rev. Lett. 71 807
- [13] Kurt Wiesenfeld, David Pierson, Eleni Pantazelou, Cris Dames and Frank Moss 1994 Phys. Rev. Lett. 72 2125
- [14] W. J. Rappel and Steven Strogatz 1994 Phys. Rev. E 50 3249
- [15] Gerardo J. Escalera Santos, M. Rivera, M. Eiswirth, and P. Parmananda 2004 Phys. Rev. E 70 021103
- [16] Duncan H. Looney, and Sanborn C. Brown, Phys. Rev. 93, 965 (1954).
- [17] P. A. Sturrock 1960 Phys. Rev. 117 1426
- [18] B. Shokri, S. M. Khorashadizadeh 2006 Phys. Plasmas 13 052116
- [19] Md. Nurujjaman, Ramesh Narayanan, and A. N. Sekar Iyengar 2007 Chaos 17 043121
- [20] Md. Nurujjaman, A.N. Sekar Iyengar, and P. Parmananda 2008 Phys. Rev. E 78 026406
- [21] Valentin Pohoaţǎ, Gheorghe Popa, Roman Schrittwieser, Codrina Ioniţǎ, and Milan Čerček 20003 Phys. Rev. E 68 016405