Bottomonium Results from BABAR and BELLE
After nine years of operation the BABAR experiment at the B factory PEPII (Standford Linear Accelerator Center) stopped data taking in April 2008. The last three month of data taking were devoted to collisions at center of mass energies of the , and to an energy scan above the . Besides the observation of the bottomonium ground state , the center of mass energy dependent cross section was measured in the energy range from 10.54 to 11.20 GeV. BELLE observed an enhancement in the production cross section for in an energy scan from 10.83 to 11.02 GeV.
1 Introduction
The bound states of , the bottomonium states, are the heaviest and most compact bound states of quarks and anti quarks in nature. They were first discovered as spin triplet states called by the E288 collaboration at Fermilab in 1977 in scattering on Cu and Pb targets studying muon pairs in a regime of invariant masses larger than 5 GeV . Thirty years after the discovery of these triplet states, still no evidence for the lowest energy spin singlet state, the pseudo scalar , was found.
Spectroscopic measurements of fine and hyperfine structure splittings of hadronic and radiative transitions in the bottomonium system allow to test calculations of NRQCD, QCDME and lattice QCD. In particular, the hyperfine mass splitting between the singlet and triplet states yields information about the spin-spin interactions. Of the recent topics in bottomonium physics, BABAR’s discovery of the and the measurement of the hyperfine splitting are discussed . Results of an inclusive cross section measurement of a precision energy scan above the are presented. These results are compared to an exclusive cross section measurement of by BELLE in a scan on the resonance.
2 Discovery of the Meson
The large BABAR dataset on of 120 million/100 million events allows to search for the rare radiative M1 transitions from the triplet states and to the .
The strategy is to search in the inclusive photon spectrum for the decay in the center of mass frame of the . Besides the signal photons at an energy of about 900 MeV, we expect large backgrounds of non-peaking and peaking nature. Continuum events, cascade decays and events contribute to the non-peaking background. There are two contributions to the peaking background: i) the decay chain from to the tripletaaaThe 3 states of the decaying to appear as one peak at about 760 MeV due to energy resolution and Doppler broadening. , which then decays to , ii) initial state radiation (ISR) with a photon of such a radiated energy ( 860 MeV) that the remaining virtual photon matches the .
Knowing all sources entering the inclusive photon spectrum, for each contribution a probability density function (PDF) is determined. A binned maximum likelihood fit in the photon energy range from 500 to 1100 MeV allows to extract the signal. About 10 % of the data are used to improve the PDF determination, the event selection and the background suppression. This data are discarded in the final analysis. The shape of the photon distribution () of the decay to is determined from MC as a convolution of a Crystal Ball and a Breit-Wigner function. The width of the Breit-Wigner function is fixed to 10 MeV and variations are considered as systematic errors. For the non-peaking background component an exponential Ansatz is used; the starting parameters are determined from the side bands. The decays are parametrized as 3 Crystal Ball functions. Their width is fixed and is for all 3 lines the same. The relative peak positions are taken from PDG. The relative yields are also fixed. In the final fit the yield of the contribution from ISR () is fixed and taken from the extrapolated yield of the off-peak data to the on-peak sample taking the luminosity, the reconstruction efficiency and the cross section into account.
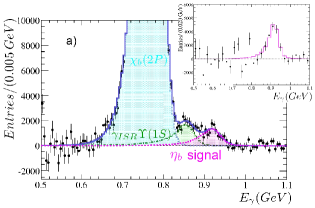
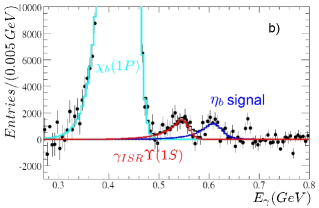
A maximum likelihood fit of the four components to the data sample with an integrated luminosity of 25.6 (109 million events) is performed. Figure 1a shows the inclusive photon spectrum and the PDFs of the fit result as colored lines after subtracting the non-peaking background. The contribution is indicated in light blue, in green the contribution from initial state radiation. The peak in magenta is clearly visible. Subtracting the and ISR contributions leads to the signal shown in the upper right part of Figure 1a. The photon energy is measured to be with a significance of .
In addition to the search in data, BABAR performed a similar analysis using 92 Million events . The discovery is confirmed in this channel with a signal significance of . Both values of the mass agree very well. The combined mass of the is measured to be , which is in good agreement with unquenched lattice QCD calculations . Using the PDG average for the mass of the , BABAR measures a hyperfine mass splitting of well in agreement with lattice QCD predictions . The ratio of the branching fraction measurements for and is . According to Godfrey and Rosner , this is compatible with the assumption of radiative M1 transitions.
3 Energy Scans above
Recently, non-baryonic charmonium states which do not behave like standard states were discovered. The question arises, if similar exotic states with appear in the bottomonium energy regime. Scaling the Y states (4260, 4350, 4660) from the charmonium to the bottomonium regime, the interesting energy range is above and below 11.2 GeV. BABAR performed a scan in the center of mass energy from 10.54 to 11.2 GeV in 5 MeV steps with 25 of recorded data per point. This is about 4 times finer with a 30 times larger amount of data than the last scan done 25 years ago at CESR . Including 8 additional points of irregular spacing on , the total amount of data corresponds to an integrated luminosity of 3.9 .
BABAR follows an inclusive approach to search for new states with quark content measuring the inclusive hadronic cross section as the ratio at different center of mass energies . Here, is the total cross section of including the states produced in initial state radiation below the open beauty threshold and is the lowest order cross section of .
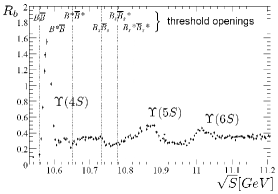
The region above the is explored with unprecedented details as shown in Figure 2 by the measurement of as function of the center of mass energy. The errors are of statistical and uncorrelated systematic nature. The dotted lines indicate the different meson production thresholds. The large statistics per energy point and the small energy steps reveal structures which seem to correspond to threshold openings. The and candidates are probably not pure resonance structures as predicted within the coupled channel model in 1984 by Törnquist . It handles the coupling between the quarkonia and the continuum. Coupled channel effects play a significant role in accounting for the energy spacing of the level. All resonances contribute by interference with the dominant resonance. Therefore, an interpretation of the measured structures is very difficult. The bumps in the region from 10.6 to 10.75 GeV are not due to resonances, but appear due to threshold openings of the and and the node structure in the overlap integrals. Above a plateau is clearly visible.
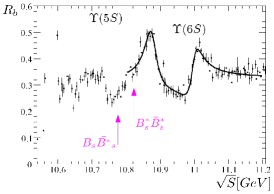
In order to determine the parameters for the and candidates, the following simplified model is fit to the data in the energy range from 10.8 to 11.2 GeV: , is a relativistic Breit-Wigner resonance. The values obtained , and , differ significantly from the PDG values , and , . The result of the fit is superimposed in Figure 2 (right). The number of states and their energy dependence is a priori unknown. Therefore, a calculation within a proper coupled channel approach would certainly yield different results.
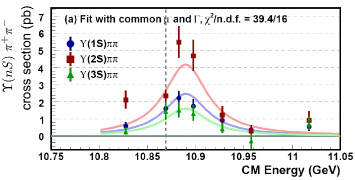
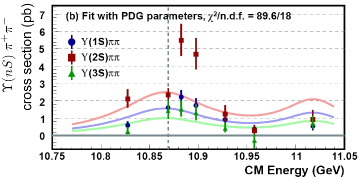
In contrast to BABAR, BELLE followed an exclusive approach measuring the energy dependence of the cross section of () in an energy scan within the region . Data of six energy points from 10.83 to 11.02 GeV corresponding to an integrated luminosity of 7.9 were collected. The signal yield for the cross section measurement is extracted by an unbinned maximum likelihood fit to , defined as the difference between and , for the 3 different resonance regions , and . The three sets of cross section measurements as a function of the center of mass energy are shown in Figure 3 in different colors. The fit of a single S-wave Breit-Wigner resonance model is superimposed (Figure 3a). In the fit the normalization as well as a common mean and width are extracted. An enhancement in the production of the final states is observed and the conventional lineshape does not describe the measurements well. The values obtained in the fit, and , are clearly different from the PDG values listed above. This is supported in Figure 3b where a fit with the PDG and parameters yields a poor value; the observed resonance structure disagrees with the states given by the PDG.
4 Summary
The large BABAR datasets on resulted in the discovery of the lowest energy spin singlet state of the bottomonium system in decays. The mass was measured to be with a hyperfine splitting .
These measurements were complemented by an inclusive hadronic cross section measurement above from 10.54 to 11.2 GeV which revealed structures with unprecedented detail. BABAR extracted from the fit of a simplified model parameters for and which indicate a smaller width than the PDG values. This is supported by a cross section measurement from BELLE of in the region of 10.83 to 11.02 GeV.
References
References
- [1] W. R. Innes et al, Phys. Rev. Lett. 39, 20 (1977).
- [2] B. Aubert et al, Phys. Rev. Lett. 101, 071801 (2008).
- [3] B. Aubert et al, arXiv:0903.1124 subm. to Phys. Rev. Lett..
- [4] T.-W. Chiu et al, Phys. Lett. B 651, 171 (2007).
- [5] A. Gray et al, Phys. Rev. D 72, 094507 (2005).
- [6] S. Godfrey, J. L. Rosner, Phys. Rev. D 64, 074011 (2001).
- [7] D. Besson et al, Phys. Rev. Lett. 54, 381 (1985).
- [8] D. M. Lovelock et al, Phys. Rev. Lett. 54, 377 (1985).
- [9] B. Aubert et al, Phys. Rev. Lett. 102, 012001 (2009).
- [10] N. Törnquist Phys. Rev. Lett. 53, 878 (1984).
- [11] K.-F. Chen et al, Phys. Rev. Lett. 100, 112001 (2008).
- [12] I. Adachi et al, arXiv:0808.2445 (2008).