Calibration and imaging challenges at low radio frequencies: An overview of the state of the art
Abstract
Many scientific deliverables of the next generation low frequency radio telescopes require high dynamic range imaging. Next generation telescopes under construction indeed promise at least a ten-fold increase in the sensitivity compared with existing telescopes. The projected achievable RMS noise in the images from these telescopes is in the range of 1–10Jy/beam corresponding to typical imaging dynamic ranges of . High imaging dynamic range require removal of systematic errors to high accuracy and for long integration intervals. In general, many source of errors are directionally dependent and unless corrected for, will be a limiting factor for the imaging dynamic range of these next generation telescopes. This requires development of new algorithms and software for calibration and imaging which can correct for such direction and time dependent errors. In this paper, I discuss the resulting algorithmic and computing challenges and the recent progress made towards addressing these challenges.
National Radio Astronomy Observatory, Socorro, New Mexico, USA
1. Introduction
Aperture synthesis array telescopes combine signals from a number of antenna pairs to sample the coherence function (visibility function) in the radiation far field. The angular resolution is inversely proportional to the largest separation between the antennas (baseline) compared to the wavelength of observation. The sensitivity is proportional to the total collecting area, square root of the bandwidth of observation and total integration time and inversely proportional to the effective system temperature.
Next generation telescopes radio telescopes, some under construction, promise 10–100 times improvement in resolution and sensitivity. For a number of reasons ranging from engineering challenges and cost considerations to sky background emission, it is hard to lower the system temperature by a few order of magnitude to improve the telescope sensitivity by similar order. As a result, all next generation telescopes use larger number of antenna elements to increase the collecting area, wide-band receivers and long integrations in time to achieve the higher sensitivity. To mitigate bandwidth smearing (Thompson et al. 2001), effects of narrow band radio frequency interference (RFI) and for scientific reasons, the observed band is split into a number of narrower frequency channels. Snapshot data rate is proportional to the product of the square of the number of antenna elements and number of frequency channels. This fact, combined with long integrations in time implies that the projected sensitivity improvements of the next generation telescopes will come at the cost of times increase in the data volume over existing telescopes.
An underlying assumption in the sensitivity calculations is that the random noise in the observations has no systematic component and that for a given system temperature, the signal to noise ratio (SNR) is proportional to where is the total integration in time and is the total bandwidth of observation. However, the observed data is inevitably corrupted by a number of instrumental and ionospheric/atmospheric effects. Furthermore, these effects are not the same across the field of view (i.e., these effects are direction dependent(DD)). This makes the “noise” in the observations non-random which does not necessarily reduce with integration in time and/or frequency. Furthermore, low frequency sky is also brighter and more complex. As a result, the projected image plane RMS noise of 1–10Jy/beam translates to an imaging dynamic range requirement of . The imaging dynamic range limit due to deconvolution errors for complex fields with compact and extended emission is significantly higher than this.
The next generation post processing software therefore needs to correct for direction dependent effects more accurately, over larger parameter space (time, frequency and polarization) using 2–4 orders of magnitude larger data volume as well as image complex sky emission with high fidelity to achieve the scientific goals. An obvious conclusion is that we necessarily need significant research in the area of post processing techniques for imaging and calibration and develop algorithms which are more accurate, account for direction dependent effects and can deal with large data volumes efficiently. In this paper, I review the recent progress in the development of new imaging and calibration algorithms relevant for high dynamic range imaging at low radio frequencies ( GHz). A more complete theoretical background can be found in the recent paper by Rau et al. (2009).
2. The Measurement Equation
Using the theoretical formulation by Hamaker et al. (1996), full polarimetric measurements from a single baseline can be described by the following Measurement Equation
| (1) |
where is the observed visibility samples measured by the pair of antennas designated by the subscript and , separated by the vector and weighted by the measurement weights . is the complex direction independent gain, is the direction dependent gain as a function of the direction , frequency and time and is the image vector. The vectors and are full polarization vectors in the data and image domain respectively. and can be expressed as an outer product of two antenna based Jones matrices as and . and describe the full polarization response of the individual antennas in the feed polarization bases. An appropriate unitary transform can be applied to convert the above equation to Stokes bases (see Hamaker et al. (1996); Rau et al. (2009) for details).
For wide-band observations, the sky emission also changes as a function of frequency and is potentially differently for different directions. Assuming time invariance, this frequency dependence can be expressed as
| (2) |
where is the image at the reference frequency and is spectral index which varies across the field of view and the frequency band. , , and represent the explicit unknowns in Equation 1. The process of calibration estimates and while the process of imaging estimates and . Note that while the observed visibilities can be corrected for the effects of s by dividing Equation 1 by , the same is not true for DD terms. Correction for the effects of can only be done as part of the imaging process. This makes solving and correcting for DD errors more difficult and consequently conventional calibration accounts for only direction independent corruptions. This has been sufficient for the existing telescopes. This however must change to achieve imaging dynamic ranges consistent with the thermal noise limit of the next generation instruments (Bhatnagar et al. 2004, 2006; Rau et al. 2006).
3. Parametrization of the Measurement Equation
In order to make an image free of the effects of the corruptions, needs to be corrected for the effects of s and s. Conventional techniques typically parametrize as three separate terms to represent time, frequency and polarization dependencies. These are assumed to be orthogonal and therefore solved independently in the process of time, bandpass and polarization calibration. For narrow band observations (less than 10% fractional bandwidth), is assumed to be small or zero and is parametrized as a value per pixel, each pixel being treated as independent degree of freedom (DoF). is ignored in calibration and during image deconvolution and if required, corrections for it are made post-deconvolution (e.g. post-deconvolution correction for the antenna response as a function of direction).
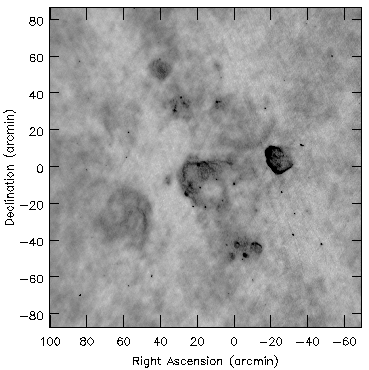
For the next generation telescopes however, more sophisticated parametrization is required. The DD terms need to be parametrized to model the instrumental and ionospheric DD effects. Variations of across observing frequency band and across the field of view (FoV) needs to be parametrized to model the spectral index of the sources. Sky is brighter and more complex at low frequencies and most fields have sources with extended emission. therefore also needs to be parametrized to better represent extended emission.
4. The W-term
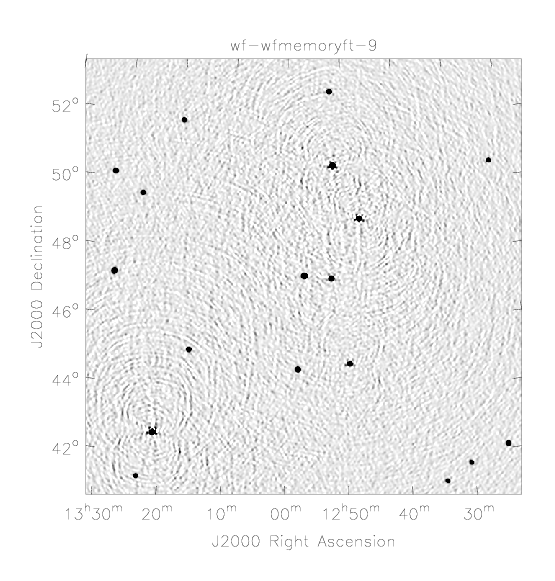
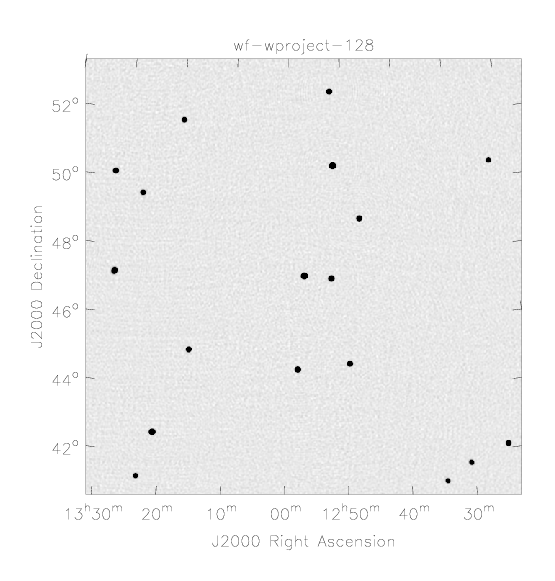
The exponent in Equation 1 can be expanded as with the usual meaning for the symbols (Thompson et al. 2001). When the field of view is large (as is typically true at low frequencies), the integral cannot be reduced to a Fourier transform and use of the 2D FFT algorithm for computing efficiency leads to significant distortions away from the phase center.
Faceting algorithms using faceting in the uv-domain (as against image-plane faceting) (see Sault et al. (1999) for an expression for faceting in the uv-domain) produce undistorted single-plane images of the sky with an approximate space-invariant PSF. This has several practical advantages during deconvolution, particularly for the deconvolution of extended emission. Algorithms using this approach exist in the CASA package111CASA Home Page at http://casa.nrao.edu. Computing load is the same as that for image-plane faceting algorithms (Cornwell & Perley 1992, 1999).
4.1. The W-Projection Algorithm
Absorbing the third term in the expression for into in Equation 1, the observed visibilities can be expressed as where are the visibilities corresponding to the tangent plane, represents the Fourier transform and ’’ denotes the convolution operations respectively. The W-Projection algorithm (Cornwell et al. 2008) exploits this to correct for the w-term in the gridding/de-gridding operation during imaging. While theoretically this algorithm can be shown to be faster by up to 50 times, in practice it has been shown to be up to an order of magnitude faster compared to faceting algorithms. W-Projection algorithm also produces a single-plane image, making it easier to combine with other techniques for dealing with extended emission across the field of view as well as correcting for other DD effects.
5. Ionospheric corruptions
Corruptions due to ionosphere is one of the limiting problems in high sensitivity high resolution imaging at low frequencies. Its effect is that the phase across the antenna aperture is not constant and potentially different for each antenna in the array (it is a direction dependent effect - often referred to as “non-isoplanatic ionosphere” in the literature).
5.1. Field base calibration
The field-based calibration technique (Cotton et al. 2004) measures the shift of compact sources throughout the FoV to estimate local ionospheric phase gradients. A polynomial fit to the estimated phases is then used to apply corrections to the rest of the field. For small baselines (Km) this has been shown to improve the imaging performances for some fields. This technique however can be computationally prohibitive for large FoV with complex emission and does not extend to cases where the ionospheric refractive effects are significant.
5.2. Peeling
This technique estimates a complex gain towards a number of sources across the FoV for which good models are known apriori (either from earlier imaging and calibration runs or from external sources). The solved gains are then used to remove the contribution of the sky emission in the vicinity from the data as:
| (3) |
where the superscript denotes all sources in the region where the peeling solutions apply. In the iterative form of Peeling, the corrected visibilities are then used to apply this technique iteratively to the strongest sources in the residual image. This has been shown to work well for simple fields (dominated by compact strong sources) and for relatively small data volume. Various variants of this technique are being currently tested (Nijboer & Noordam 2007; Mitchell et al. 2008) to determine its numerical and computational performance for complex fields with extended emission and with large data volumes.
6. Effects of antenna Primary Beam
For narrow band observations, time dependent DD gains are dominantly due to time varying antenna primary beams (PB). While the antenna forward gain is clearly direction dependent, its time variation is due to a number of reasons (rotation of the rotationally asymmetric PBs with Parallactic Angle for Az-El mount antennas, antenna pointing errors, geometrical distortions of the antenna with elevation, etc.). For wideband observations, the shape of the PB varies across the band and sources well within the PB main-lobe at the lower frequency end of the band may appear in the first sidelobe at the higher frequency end (e.g. with a bandwidth ratio of 2:1). For sources in the first sidelobe of the antenna power pattern, the time varying gain due to the rotation of the PBs will be even stronger (Bhatnagar et al. 2006, 2008). Furthermore, the time, frequency and direction dependence of aperture array station power pattern is expected to be worse compared to filled aperture antennas. Algorithms to correct for PB effects are therefore crucial for the scientific deliverables of the next generation instruments.
Image-plane based PB correction by direct evaluation of the integral in Equation 1 is possible. To reduce the resulting prohibitive run-time computing cost for realistic image complexity and data volumes, a FFT based reverse transform has been used by Uson & Cotton (2008). However this requires making assumptions about the variability of either the sky emission or the antenna power pattern.
6.1. The A-Projection Algorithm
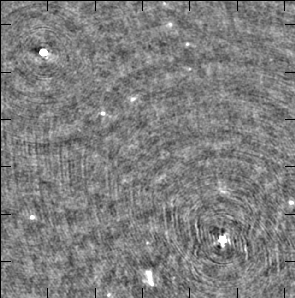
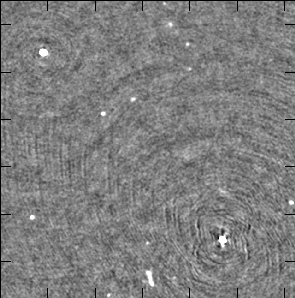
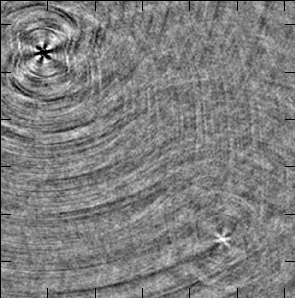
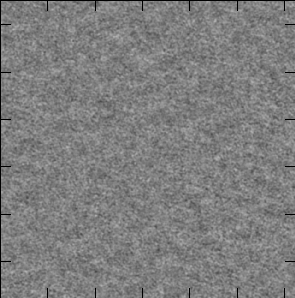
represents the effects of antenna primary beams in Equation 1. The A-Projection algorithm (Bhatnagar et al. 2008) uses a model for antenna aperture illumination and the approximate unitary nature of the resulting operator to correct for effects of PB as part of image deconvolution iterations. This algorithm can naturally deal with non-identical antenna PBs, is straight forward to integrate with other advanced imaging and calibration algorithms and is computationally efficient. An estimate of the antenna aperture illumination pattern is however required - which can be measured (antenna holography) or modeled. See Fig. 3 for an example of application of this algorithm for imaging at L-Band using the VLA.
7. The Sky Model
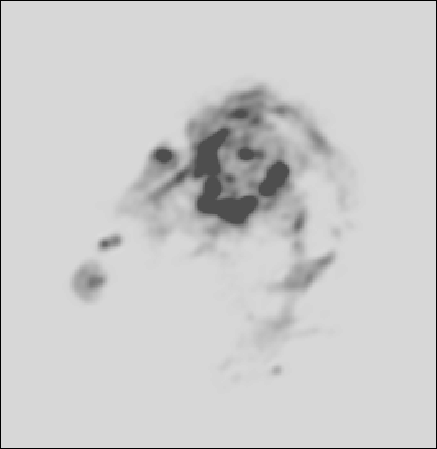
The sky model in Equation 1 is computed using image deconvolution algorithms. Most conventional algorithms treat each pixel with significant emission in the image as an independent DoF (e.g., the Clean (Högbom 1974) and MEM (Cornwell & Evans 1985) algorithms and their variants). Such a parametrization of the sky is non-optimal for extended emission (Bhatnagar & Cornwell 2004) and suffers from the problem of pixel quantization errors (Voronkov & Wieringa 2004; Cotton & Uson 2008). For complex fields with strong emission, both these problems limit the imaging dynamic range well above the instrumental limit of the next generation telescopes.
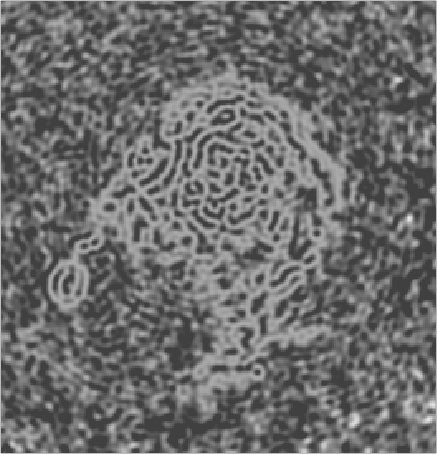
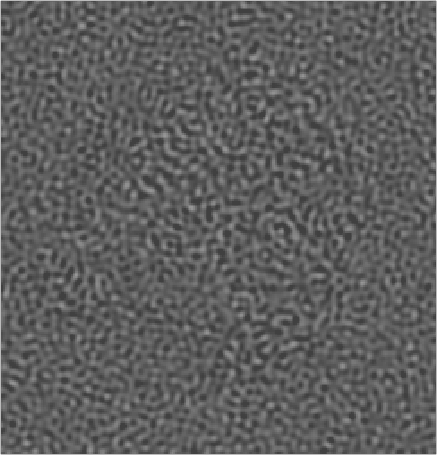
7.1. Scale-sensitive modeling: The MS- and Asp-Clean algorithms
The MS-Clean algorithm (Cornwell 2008) models the sky as a collection of components with pre-computed set of scale sizes. Depending upon the user defined choice of scales, extend emission as well as compact emission can be better modeled with a significantly smaller number of components (DoF). Memory requirements and computing load is higher compared to conventional algorithms and the coupling between fixed set of user defined scales is ignored (i.e., it effectively ignores the fact that the parameter space is non-orthogonal).
The Asp-Clean algorithm (Bhatnagar & Cornwell 2004) adaptively determines the local scale as well as position of the components in the image. This effectively mitigates the problem of pixel quantization and accounts for coupling between various scales (i.e., recognize the fact that parameter space is non-orthogonal). Although for the same number of components the computing requirements are 2–3 times higher compared to MS-Clean, the number of components required is significantly smaller for same image complexity.
7.2. Wide-band modeling: The MS-MFS algorithm
Ignoring the frequency dependence of the sky in wide-band observation can limit the imaging dynamic range to (Rau et al. 2006). Hence, apart from scale-sensitive modeling of the sky, modeling the frequency dependence of the sky (Equation 2) during imaging is required for wide-band observations. The MS-MFS algorithm (Rau 2009) uses the MS-Clean approach to model extended emission and models the frequency dependence using a Taylor expansion of Equation 2 about the reference frequency and solving for the coefficients of the series. The A-Projection algorithm is used to correct for the PB frequency dependence in combination with MS-MFS to make Stokes-I, spectral index and spectral index variation images of the sky (Rau 2009). The combined algorithm is being currently tested using wide-band observations of fields with strong extended emission.
8. Solvers for direction dependent effects
For high resolution high dynamic range imaging, it is virtually impossible to measure the DD terms in Equation 1 to the required accuracy prior to imaging. Algorithms to model and solve for the DD effects are therefore required.
Peeling based algorithms attempt to solve for DD effects by allocating few DoF per direction of interest (DoI). Solutions for each DoI are either used locally to subtract from the data (section 5.2.), or interpolated for other sources as well.
8.1. Pointing SelfCal
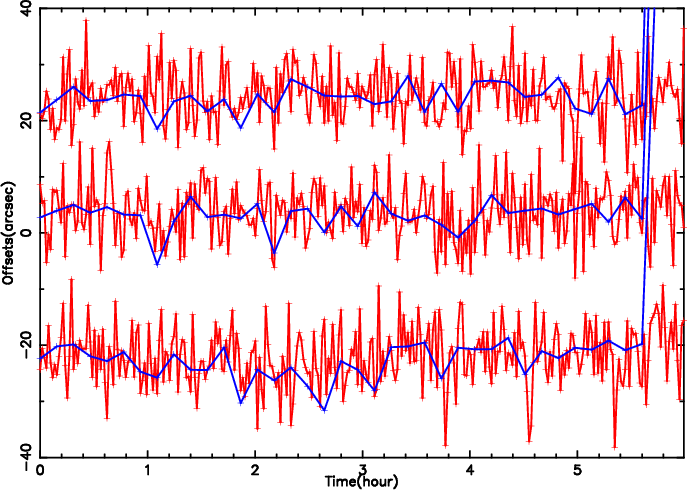
Another approach, fundamentally different from Peeling, is to develop physical models for the various DD effects and solve for the parametric model using Equation 1. Projection methods to correct for known DD effects (sections 4.1. and 6.1.) can be easily used to implement solvers which are also computationally efficient. This approach fundamentally mitigates the problem of the proliferation of DoFs inherent in the peeling approach. The Pointing SelfCal algorithms (Bhatnagar et al. 2004) is an example of use of this approach to solve for antenna pointing errors. To correct for the pointing errors, the solved pointing errors are included as part of the model for the antenna aperture illumination and used in A-Projection algorithm during imaging. Fig. 5 shows results from tests using simulated data. Further work on this using real data is currently in progress.
Acknowledgments.
I wish to thank T.J. Cornwell, K. Golap, R. Nityananda and U. Rau for their useful comments and discussions over many years.
References
- Bhatnagar & Cornwell (2004) Bhatnagar S., Cornwell T. J., 2004, Astron. & Astrophys. 426, 747
- Bhatnagar et al. (2004) Bhatnagar S., Cornwell T. J., Golap K., 2004, Solving for the antenna based pointing errors, Technical report, EVLA Memo 84
- Bhatnagar et al. (2006) Bhatnagar S., Cornwell T. J., Golap K., 2006, Corrections of errors due to antenna power patterns during imaging, Technical report, EVLA Memo 100
- Bhatnagar et al. (2008) Bhatnagar S., Cornwell T. J., Golap K., Uson J. M., 2008, Astron. & Astrophys. 487, 419
- Cornwell (2008) Cornwell T. J., 2008, IEEE Journal of Selected Topics in Signal Processing, issue 5, 2, 793
- Cornwell & Evans (1985) Cornwell T. J., Evans K. J., 1985, Astron. & Astrophys. 143, 77
- Cornwell et al. (2008) Cornwell T. J., Golap K., Bhatnagar S., 2008, IEEE Journal of Selected Topics in Signal Processing 2, 647
- Cornwell & Perley (1992) Cornwell T. J., Perley R. A., 1992, Astron. & Astrophys. 261, 353
- Cornwell & Perley (1999) Cornwell T. J., Perley R. A., 1999, in G. B. Taylor, C. L. Carilli, R. A. Perley (eds.), Astron. Soc. Pac. Conf. Ser. 180: Synthesis Imaging in Radio Astronomy II
- Cotton et al. (2004) Cotton W. D., Condon J. J., Perley R., Kassim N., Lazio L., Cohen A., Lane W., Erickson B., 2004, SPIE 5489
- Cotton & Uson (2008) Cotton W. D., Uson J. M., 2008, A&A 490, 455
- Hamaker et al. (1996) Hamaker J. P., Bregman J. D., Sault R. J., 1996, Astron. & Astrophys. Suppl. Ser. 117, 137
- Högbom (1974) Högbom J. A., 1974, Astron. & Astrophys. Suppl. Ser. 15, 417
- Mitchell et al. (2008) Mitchell D. A., Greenhill L. J., Wayth R. B., Sault R. J., Lonsdale C. J., Cappallo R. J., Morales M. F., Ord S. M., 2008, IEEE Journal of Selected Topics in Signal Processing, issue 5 2, 707
- Nijboer & Noordam (2007) Nijboer R. J., Noordam J. E., 2007, ASP Conf. Series: Astronomical Data Analysis Software and Systems XVII 376, 237
- Rau ( 2009) Rau U., (in prepration) 2009, Ph.D. thesis, The New Mexico Institute of Mining and Technology, Socorro, New Mexico, USA
- Rau et al. (2009) Rau U., Bhatnagar S., Voronkov M. A., Cornwell T. J., 2009, IEEE (in press)
- Rau et al. (2006) Rau U., Cornwell T. J., Myers S. T., 2006, Multi Frequency Synthesis Imaging for the EVLA : An initial investigation, Technical report, EVLA Memo 101
- Sault et al. (1999) Sault R. J., Bock D. J., Duncan A., 1999, Astron. & Astrophys. 139, 387
- Thompson et al. (2001) Thompson A. R., Moran J. M., Swenson, Jr. G. W., 2001, Interferometry and Synthesis in Radio Astronomy ( edition), John Wiley & Sons, Inc.
- Uson & Cotton (2008) Uson J. M., Cotton W. D., 2008, Astron. & Astrophys. 486, 647
- Voronkov & Wieringa (2004) Voronkov M. A., Wieringa M. H., 2004, Experimental Astronomy 18, 13