Energy resolution of alpha particles in a microbulk Micromegas detector at high pressure Argon and Xenon mixtures
Abstract
The latest Micromesh Gas Amplification Structures (Micromegas) are achieving outstanding energy resolution for low energy photons, with values as low as 11% FWHM for the 5.9 keV line of 55Fe in argon/isobutane mixtures at atmospheric pressure. At higher energies (MeV scale), these measurements are more complicated due to the difficulty in confining the events in the chamber, although there is no fundamental reason why resolutions of 1% FWHM or below could not be reached. There is much motivation to demonstrate experimentally this fact in Xe mixtures due to the possible application of Micromegas readouts to the Double Beta Decay search of 136Xe, or in other experiments needing calorimetry and topology in the same detector. In this paper, we report on systematic measurements of energy resolution with state-of-the-art Micromegas using a 5.5 MeV alpha source in high pressure Ar/isobutane mixtures. Values as low as 1.8% FWHM have been obtained, with possible evidence that better resolutions are achievable. Similar measurements in Xe, of which a preliminary result is also shown here, are under progress.
keywords:
Gas detectors , Micropattern , Micromegas , Energy resolution , Xenon , Argon1 Introduction
The use of gas Time Projection Chambers (TPCs) as calorimeters, like in recently explored applications of gamma ray astronomy, dark matter or double beta decay, in contrast to their traditional use as tracking detectors, has increased the interest of improving their energy resolution and studying the factors that ultimately limit it. The appearance of novel charge readout planes based on micropattern techniques (like Micromegas) with substantially better energy resolution capabilities, is a further motivation for these studies.
In the specific case of Double Beta Decay (DBD) searches, the Gothard TPC [1] in the 90’s represented a pioneering use of a gaseous Xenon TPC to look for the neutrinoless DBD of the 136Xe isotope. The modest energy resolution has been, however, a drawback to further pursue this experimental technique in the last decade. Indeed, for next generation experiments aiming at sensitivities down to 100 eV or 10 eV for the effective neutrino mass (for which target masses of 100 kg or several tons are needed respectively), energy resolutions better than 4.5% and 2% FWHM respectively at the Qββ value are required [2]. These requirements on energy resolutions come from the need of separating the tail of the standard DBD with 2 neutrinos, which represent an irreducible background to the neutrinoless DBD. On the other hand, it is well known that gas Xe TPCs can offer very promising and unique features when compared with other experimental techniques. Among other things, natural Xe already contains 7% of the required isotope and, as a gas, it is relatively easy to enrich. In addition, the DBD event in gas has a distinctive topological information that an appropriately pixelised readout could exploit to identify the signal and reduce backgrounds.
The advent of new readout techniques which may overcome the limitations regarding energy resolution have renewed the interest of gas Xe TPC for DBD searches. Recent proposals like the ones of NEXT[9] and EXO[10] collaborations are based on this fact. The purpose of the present work is to evaluate which is the best energy resolution of state-of-the-art Micromegas readout planes.
The energy resolution in gaseous proportional counters (and by extension in gaseous Time Projection Chambers with electron avalanche readouts) depends on many factors. Some of them can be considered non fundamental and can in principle be overcome (although with difficulty in practice). Examples of these are non-uniformity of readout planes, problems of equalization of multiple channels, ballistic deficit, attachment to electronegative impurities of the gas, time dependencies, etc… The only truly fundamental effects limiting the energy resolution are the fluctuations occurring in the number of primary electron-ion pairs produced by the ionizing particle (and determined by the Fano factor) as well as the fluctuations in the number of secondary electrons produced in the avalanche initiated by each primary electron.
The Micromegas [3, 4] readouts make use of a metallic micromesh suspended over a (usually pixellised) anode plane by means of insulator pillars, defining an amplification gap of the order of 50 to 150 m. Electrons drifting towards the readout, go through the micromesh holes and trigger an avalanche inside the gap, inducing detectable signals both in the anode pixels and in the mesh. It is known [5] that the way the amplification develops in a Micromegas gap is such that its gain is less dependent on geometrical factors (the gap size) or environmental ones (like the temperature or pressure of the gas) than conventional multiwire planes or other types of micropattern detectors based on charge amplification. This fact allows in general for higher time stability and spatial homogeneity in the response of Micromegas, reducing the importance of some of the non-fundamental factors mentioned above affecting the energy resolution. In addition, the amplification in the Micromegas gap has less inherent statistical fluctuations than that of wires, due to the faster transition from the drift field to the amplification field provided by the micromesh [6]. Experimentally, resolutions of 11% FWHM for the 5.9 keV 55Fe peak, like the one shown in figure 1 are achieved by the latest generation of Micromegas readouts.
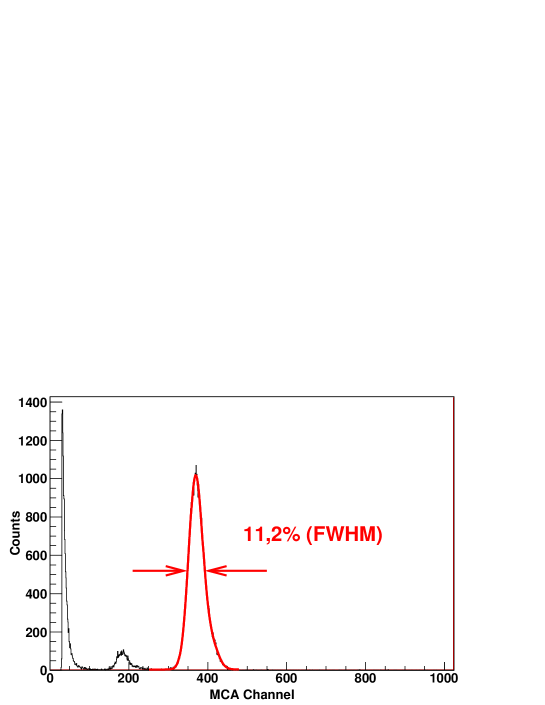
Assuming a square root of energy dependency, this value would point to energy resolutions of less then 1% at the MeV scale, by far fulfilling the requirements, for instance, of double beta decay applications [2]. An experimental confirmation of this, however, is not an easy task, due to the difficulty of confining the high energy events in a small chamber, and in fact results on energy resolution in these conditions for gaseous TPCs are seldom found in the literature.
In this paper we present the first results of our work aiming at measuring the energy resolution at high energy and high pressure of Micromegas readouts. In section 2, the experimental setup used for the measurements is described in some detail. In section 3, we present the methodology followed and the main results achieved with argon/isobutane mixtures. In sections 4 and 5 some additional results on the quenching factor in Argon/Methane mixtures and preliminary results on pure Xenon are presented respectively. We finish with our conclusions and future plans in section 6.
2 Experimental setup
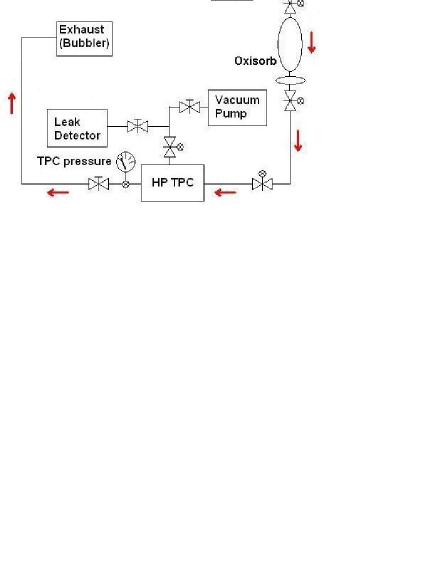
The experimental setup used in these measurements was adapted from the former HELLAZ setup at CEA/Saclay[7], already designed to perform R&D with custom-made gas mixtures of high purity and at high pressures. The overall scheme of the system is shown in figure 2, and includes a high pressure vessel of 1 liter of volume, a turbomolecular pump, a gas distribution system with a gas mixer, an oxysorb filter, a pressure controller, and an exhaust line with bubbler.
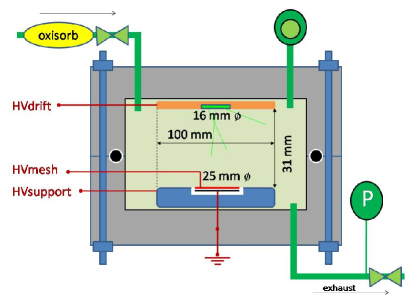
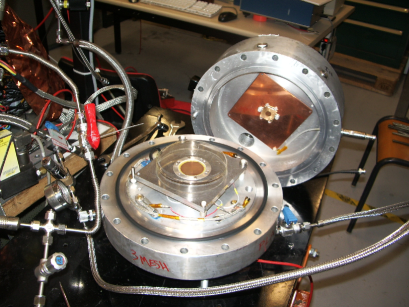
The main element of the setup is the high pressure vessel. It is composed by two 5 cm thick aluminium caps sketched in fig 3.a and photographed in 3.b, which close with a viton o-ring and leave a 1-liter inner space able to hold gas up to 20 bar 222although in the present version of the system a maximum pressure of 5 bar was respected by limitation of other elements. The dimensions of the inner space are 16 cm diameter and 5 cm of height. The vessel is provided with appropriate high voltage (SHV) and signal (BNC) feed-throughs for the internal readout setup, as well as a CF40 outlet for pumping, equipped with an all-metal UHV high-pressure valve. The gas mixer is composed by 3 independent gas lines with Bronkhorst mass flow controllers able to work at high pressure (20 bar). The gas mixture passes through a MESSER oxysorb filter before entering the chamber.
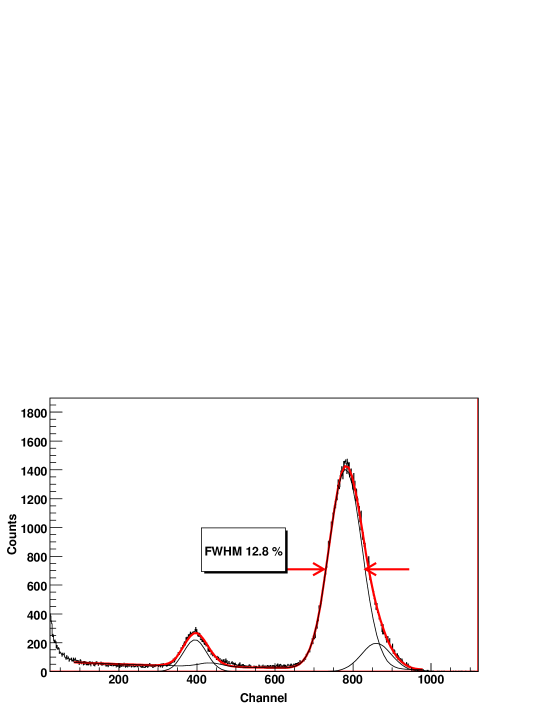
The inside of the high pressure vessel was equipped with a state-of-the-art 2.3 cm diameter circular Micromegas readout of 50 microns gap, with a single non-segmented anode covering all this area. The readout was made by the microbulk manufacturing technique developed at CERN[11], which yields the Micromegas amplification structures out of a double-clad kapton sheet, by chemically removing part of the kapton. This technique is known to yield the highest precision in the gap homogeneity and, because of that, the best energy resolutions among Micropattern detectors. The particular readout used in this measurements was tested before and after the measurements campaign with a 55Fe source at atmospheric pressure, presenting the spectrum shown in fig. 4, with a resolution of 12.8% FWHM at the 5.9 keV line of 55Fe. We must stress that no appreciable deterioration was seen after the year-long duration of the measurements campaign.
The readout was installed inside of the high pressure vessel by means of a metallic support of cm2. Apart from mechanically supporting the Micromegas readout, it aims at extending the equipotential surface defined by the Micromegas mesh and preserve a good shape of the drift electric field (i.e. drift lines perpendicular to the Micromegas plane) all along the conversion volume which projects onto the Micromegas surface. The supporting piece is therefore placed at the same voltage as the Micromegas mesh. The drift cathode is placed above the Micromegas at a distance of 3.1 cm, and was prepared to hold the Americium source in its center, as sketched in fig 3.
The electrical connections were made in such a way that we could power independently the drift cathode, the Micromegas mesh and the supporting piece. Although, as explained before, the voltage of the supporting piece is usually set the same as the one of the mesh in order to preserve the drift field. The signal was read out from the Micromegas mesh using a CANBERRA 2004 preamplifier, whose output was fed into an ORTEC VT120 amplifier/shaper and subsequently into a multichannel analyzer AMPTEK MCA-8000A for spectra building. Alternatively, the output of the preamplifier was digitized directly by a LeCroy WR6050 oscilloscope and saved into disk for further offline inspection.
3 Measurements and results
The system was cleaned before every measurement either by pumping it with the turbo-molecular pump down to pressures below 10-6 mbar, or by purging it with argon several times. The purity of the gas used was always laboratory-grade (4.6 or superior) provided by MESSER. The final gas purity, determined in addition by the leak-tightness of the system, the outgassing of materials and the effect of the oxysorb, was proven to be adequate for the short-term runs with Argon mixtures for a 3.1 cm drift distance presented in this paper. For the forthcoming Xenon measurements the present system may be limiting as evidence of some degree of attachment was found. This is discussed in the section 5.
The desired gas mixture was introduced into the high pressure vessel using the gas mixer with the appropriate relative flows. The gas mixtures for which data are presented in this section include argon plus a variable amount of isobutane (between 2% and 5%). Methane was also used in some measurements for practical reasons (non-availability of isobutane) although it is known not to be an optimal mixture for Micromegas operation. The desired gas pressure was set via the back-pressure controller. Two operation modes have been used: 1) open-loop, i.e., the gas flow is directed towards the exhaust line and lost, keeping the input flow at typical values of a few l/h, and 2) sealed-mode, i.e. the vessel was filled up to the desired pressure with the output outlet closed, and then operation started with the gas sealed inside the vessel. No substantial difference was observed between both modes of operation in the Argon data.
All data here presented has been taken using an Americium-241 source. The source consisted on a metallic circular substrate of 25 mm diameter with the Americium deposited on its center, in an approximate circular region of about 8 mm diameter. The source is not sealed, that is, no material is present on top of the americium that could stop the alphas. It was installed inside the vessel, attached to the center of the drift cathode, and in electrical contact with it, facing the center of the Micromegas readout (see Fig. 3). In order to contain the 5.5 MeV alpha particles from the main Am-241 line in our 3.1 cm of drift, the gas needed to be at a pressure of at least bar. This is the reason why no data are presented for atmospheric pressure. The activity of the source was such that, when uncollimated, it induced a typical rate of about 200 Hz on the Micromegas.
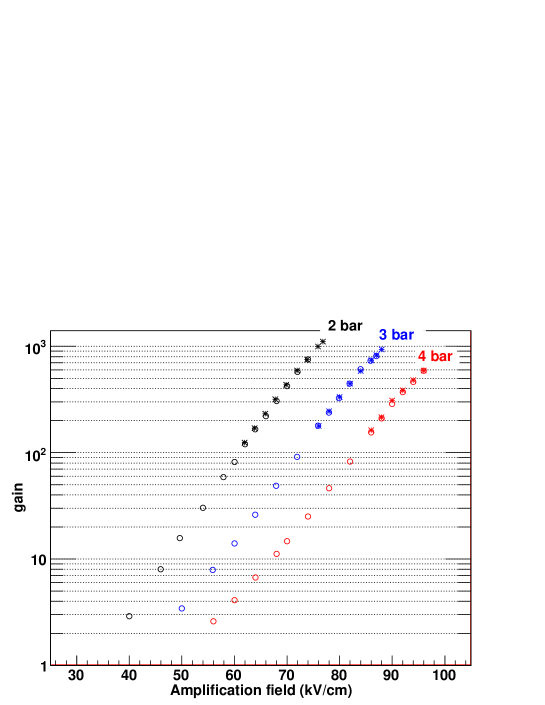
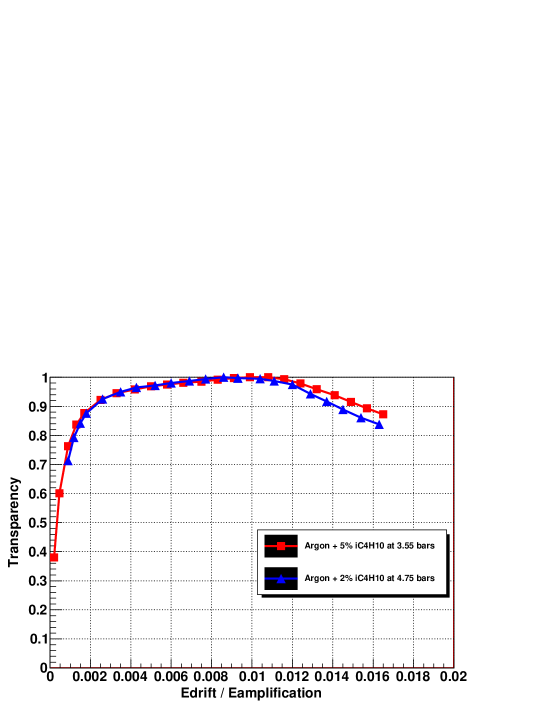
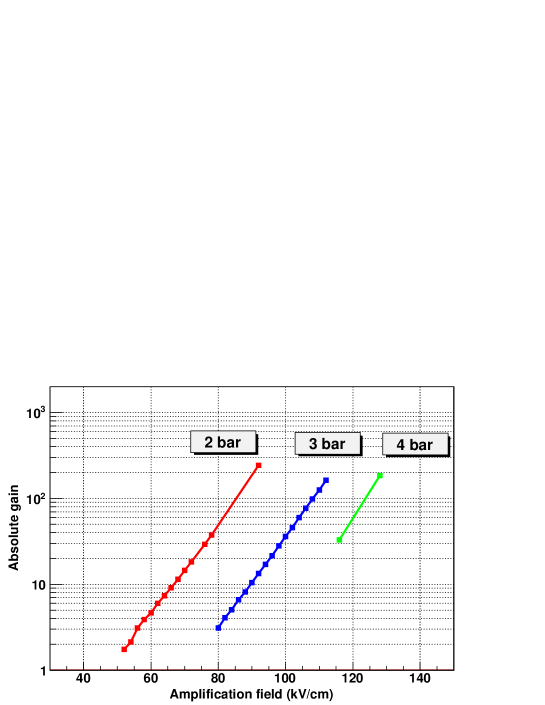
The typical sequence of data-taking for a given gas mixture and pressure included systematic variation of the mesh and drift voltages, registering the position of the 5.5 MeV alpha peak, as well as its width. The mesh voltage is typically varied in the range from 200 V to 500 V, corresponding to amplification fields from 40 to 100 kV/cm. The specific values for each pressure can be seen in fig. 5. The drift voltage is typically varied from 300 V up to 4000 V (limit of the power supply used) corresponding to drift fields from 100 V/cm to 1333 V/cm. The evolution of the peak position versus the mesh voltage gave the typical gain curves like the ones shown in fig. 5. The evolution of the peak position versus the drift field (for a fixed mesh voltage) showed the characteristic flat dependence shown in Fig. 6 over a wide range of drift/amplification field ratios (0.002 – 0.012), decreasing for larger drift fields due to decrease of the electron transmission of the mesh. The curve is compatible with usual curves taken with the 55Fe source at atmospheric pressure and shows that no significant attachment is present in the system. The relevant data were taken in conditions corresponding to the full electron transmission through the mesh (on the plateau of the curve 6).
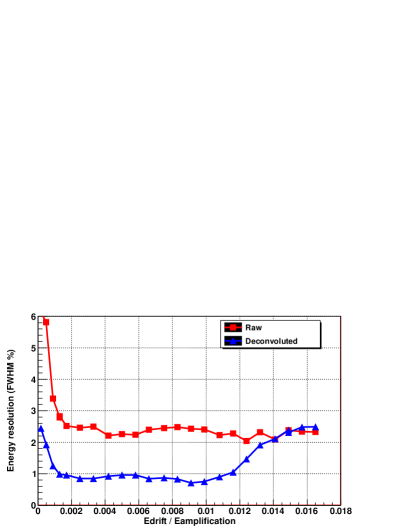
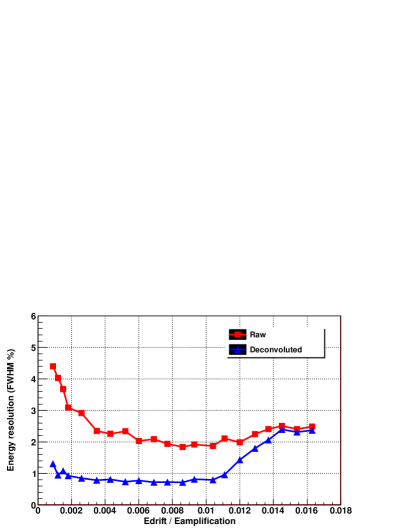
The FWHM of the alpha peak shows a characteristic dependency on the drift field, shown in Fig. 7, clearly correlated with the electron transmission plot of Fig. 6. Best energy resolutions are obtained for larger drift fields inside the electron transmission plateau, although resolutions around the level of 2% and 2.3% (respectively for 2% and 5% isobutane mixtures) are obtained for a relatively wide range of values. The best obtained values were 1.8% and 2% respectively.
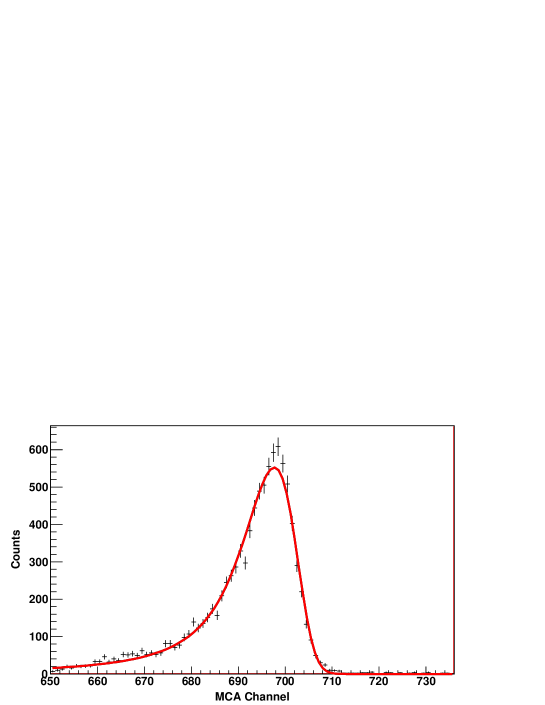
In the best cases, the peak showed a clearly asymmetric shape as it is shown in Fig. 8. As this shape is not expected from just fundamental fluctuations in the primary or secondary charge, it is indicative of (small) external effects related, for example, to incomplete charge collection for some events (for example for alphas coming from the bulk of the Americium and leaving some energy in it before exiting, or cases where the alpha tracks are in small angle with the cathode plane and part of its ionization is lost back to the cathode). Let us add that this asymmetry cannot be attributed to the effect of attachment, as the voltage configurations for which it is observed lie always well within the electron transmission plateau. In any case the amount of charge loss would very plausibly follow a Landau distribution. In fact, the peak shape is very well parameterized by a negative Landau function convoluted by a gaussian. If we attribute the mentioned external effects to the Landau function we can see the remaining gaussian as the intrinsic energy resolution of the Micromegas. This deconvolution analysis, illustrated in the fit of Fig. 8, points to an energy resolution of 0.7% FWHM (0.9% for the 5% isobutane case). This value could be suggestive of the achievable resolution in a setup where the mentioned external effects were not present. Measurements with a gaseous source (radon) are envisaged to test the suggested origins of such effects.
It is interesting to note the dependence of this ”deconvoluted” resolution with drift/amplification field ratios, shown in Fig. 7. The values obtained are rather constant along the electron transmission plateau and get worse beyond it (the peak becomes symmetric). It is reasonable to assume that whatever the origins of the peak assymetry, they just become less important compared with other (symmetric) effects of gain fluctuation at higher field ratios (electron loss in the mesh, larger statistical fluctuations in avalanche, etc ).
In summary, energy resolution at the 2% FWHM or below have been demonstrated in 4 bar argon/isobutane mixtures for the 5.5 MeV alpha line. Possible evidence for resolutions below 1% is pointed out based on the asymmetry of the peak, although further work is needed to identify the effects causing the asymmetry, and eventually remove them.
| Pressure (bar) | Gas Mixture | Energy resolution (FWHM) |
|---|---|---|
| 4 | Ar + 2% isobutane | 1.8 % |
| 4 | Ar + 5% isobutane | 2.0 % |
4 Alpha ionization yield results
Although the average energy required to ionize (the value) is similar for alphas or electrons [12], the effective ionization of an alpha particle of a given energy may be less than that of an electron of the same energy in some conditions. This is due to the effect of recombination of electron-ion pairs, which is stronger in the denser alpha tracks. This effect is dependent on the density of the media (being more relevant, for example, in noble liquid detectors) and on the applied electric drift field (strong electric fields prevents the recombination). The presence of quenchers could also have some effect.
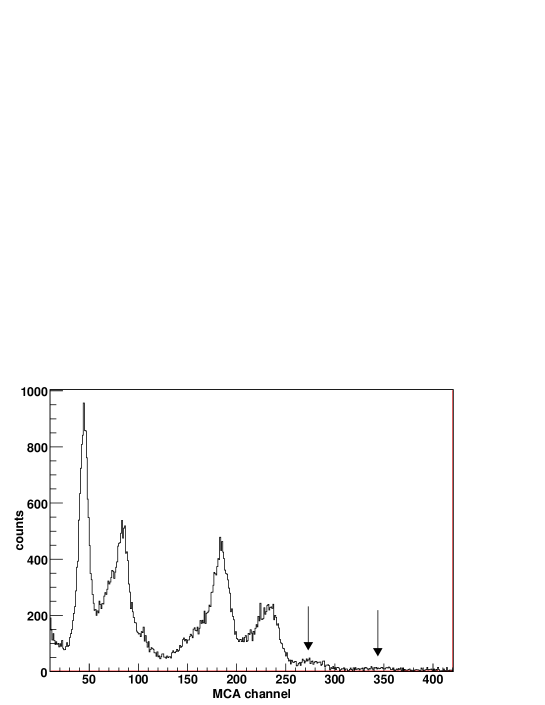
In the present section we gather the results achieved to determine whether in our specific conditions alphas suffer from any appreciable recombination, in which case a correction, or quenching factor, would be needed to apply in order to know which electron-equivalent energy corresponds our 5.5 MeV alpha peak. The method followed to measure the alpha quenching factor was to focus on the x-rays and gamma lines of the same Americium source. In order to see these lines, of considerable lower energy than the alpha one, we started by blocking the source with a thin aluminium foil that would stop the alpha emission. The Micromegas mesh was set at higher voltages with respect to the alpha runs. The result is illustrated in Fig. 9, where a series of peaks are identified (see caption). We proceed to calculate the gain curve using these peaks, checking that all gave identical curves, as expected from gain proportionality. Finally, we compare the curve obtained with the gamma peaks to that of the alpha peak.
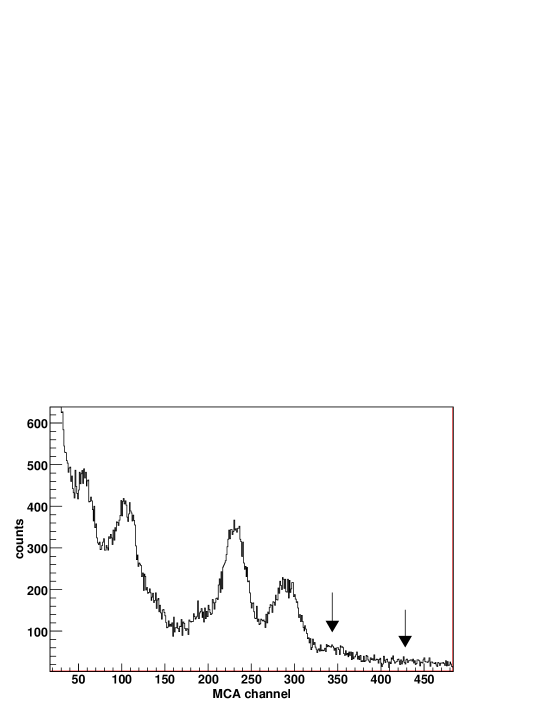
The need of covering and uncovering the alpha source (and opening the system, re-pumping, and re-filling) left doubts on the reproducibility of the gas conditions from measurement to measurement. In order to obtain a reliable result the alpha peak should be observed in the same runs as the gamma peaks. For that reason we collimated the alpha source in such a way that a small alpha peak was observable without contaminating too much the low energy region and thus still observe the x-ray and gamma peaks. Fig. 10 shows the low energy spectrum obtained in such conditions.
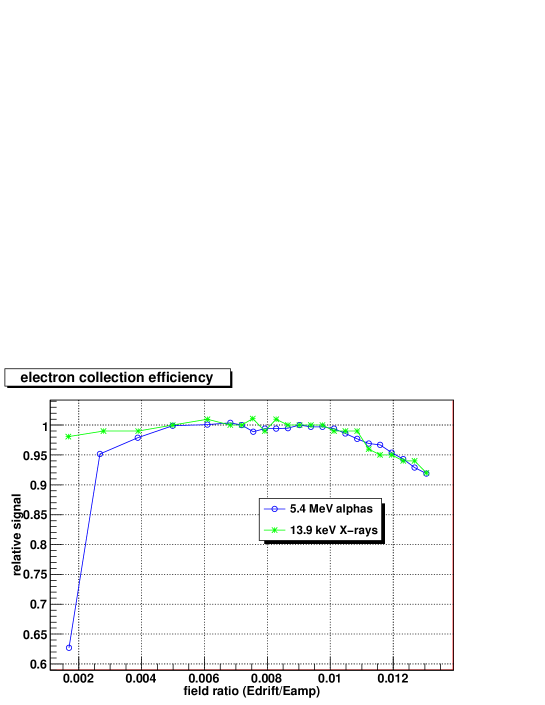
The gain curves for both the alpha and the gamma peaks are shown in Fig. 5. As can be seen both kind of lines are coincident and therefore the quenching factor is almost unity. The precise values obtained by averaging over all the series are listed in table 2 for 2, 3 and 4 bar. The error shown in Table 2 represents only the 1 sigma statistical error from the dispersion of the points of the averaged series and is therefore underestimated. From this we conclude that recombination effects are very small in the experimental cases tested. Similar measurements were performed in Ar + CH4 mixtures (with different amounts of CH4) with similar results.
It is worth noticing that all these data were taken with values of drift sufficiently high so that we were well within the plateau of Fig. 6. Additional data were taken at different values of the drift field, as shown in Fig. 11, and only at very low values we measured decreased values of the alpha series with respect to the gamma series, what can be attributed to recombination effects.
| Gas | Pressure (bar) | Q 1 error |
|---|---|---|
| Ar + 5% isobutane | 2 | 0.987 0.006 |
| Ar + 5% isobutane | 3 | 0.984 0.007 |
| Ar + 5% isobutane | 4 | 0.966 0.010 |
5 Preliminary results in pure Xenon
In this section we present our very preliminary results of measuring the energy resolution in pure Xenon. As will be discussed later the present status of the system is not suitable to achieve the required levels of gas purity to work with Xenon, and therefore the results here achieved are to be considered as preliminary and certainly a conservative upper limit to the energy resolution achievable.
The methodology followed in this case is identical to the one sketched in section 2, but only sealed-mode was used. The mesh voltages used were somehow higher than the case of Argon, ranging from 250 V to 650 V, corresponding to 50 to 130 kV/cm). The specific values for each pressure can be seen in fig. 12. As in the case of Argon, gain and electron transmission curves were measured (see Fig. 12), for gas pressures 2, 3 and 4 bar. A remarkable result was that the same maximum gain of at least 200 333value obtained assuming a quenching factor unity, so it is a lower limit was obtained independently of the pressure, indicating that this was a limitation probably related to the amount of charge generated locally in the Micromegas gap, set by the rate of alphas of our source, and not the intrinsic Micromegas limit. Single runs with the source more collimated showed indeed higher gains. We cannot exclude that the same impurities that produce attachment (see later) are allowing us to obtain larger gains, but it could also be that the particular microbulk geometry is able to reach relatively high gains in pure Xenon compared to other amplification geometries. This question needs further study.
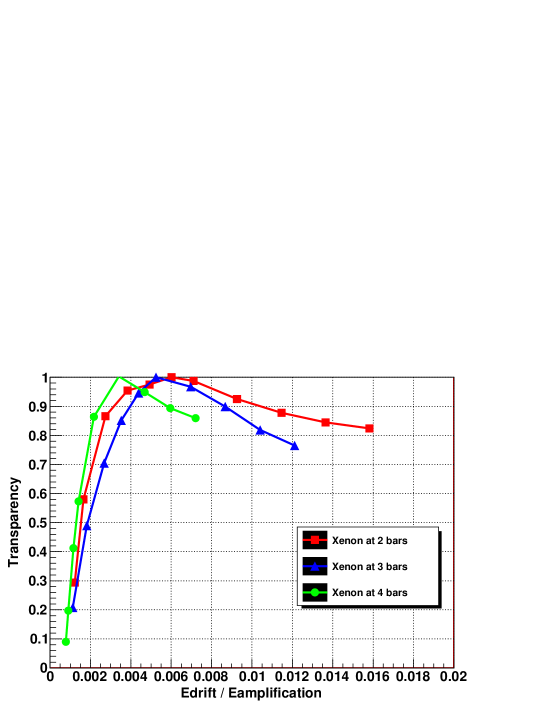
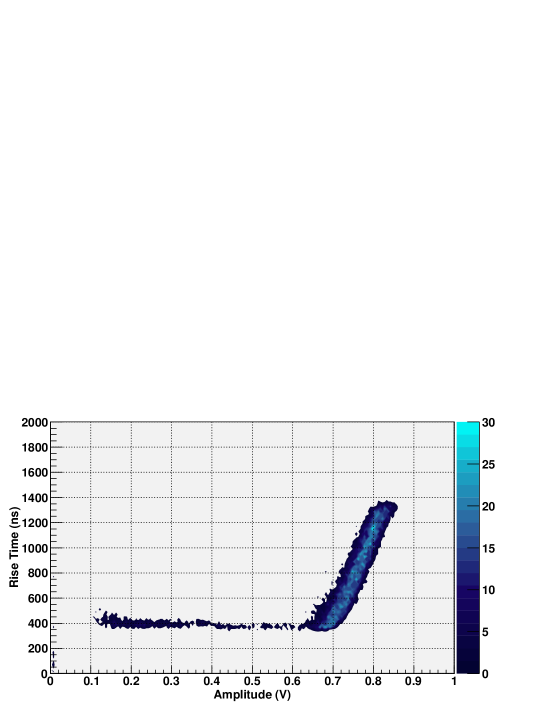
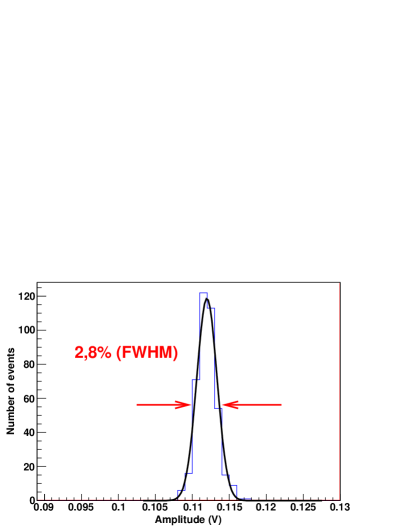
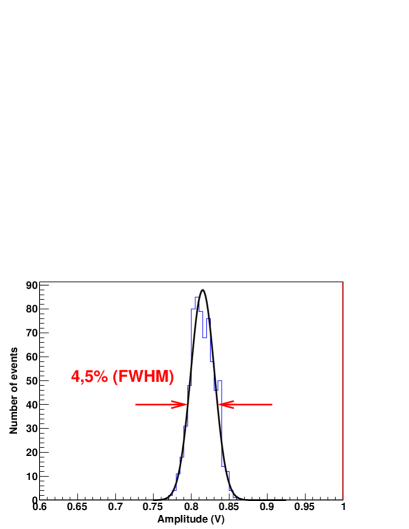
The curves obtained (Fig. 13) for the electron transmission through the mesh showed evidence of attachment, explaining why spectra taken with the MCA showed always modest energy resolution. Data taken with the oscilloscope, allowed us to perform a pulse shape analysis (PSA) to extract pulse characteristics like risetime and amplitude. These data, unlike the Argon ones, showed a clear correlation between the risetime of the pulse and its amplitude, for events in the alpha peak, as illustrated in Fig. 14. Pulses of long risetime correspond to alpha tracks with orientation close to perpendicular to the Micromegas plane, while pulses of shorter risetime corresponds to tracks closer to parallel to the Micromegas plane. The fact that the latter have lower amplitudes is an evidence of attachment. Nevertheless the PSA allows us to have a conservative estimation of the energy resolution without attachment by performing a cut on risetime and keeping only events with similar risetime, and therefore minimal spread due to different attachments. The choice of risetime values for the plots here presented (fig. 15) is 1800-2000 ns for the 2 bar case and 1200-1300 ns for the 4 bar case. The values obtained with this analysis were 2.8% FWHM for pure Xenon at 2 bar, and 4.5% FWHM for pure Xenon at 4 bar, as shown in Fig. 15. We must stress that these numbers are conservative, because the subset of events kept by the cuts suffer still from attachment. Nevertheless, the values obtained are positive and already approach the requirements of double beta decay experiments. At present we work to improve the system from the point of view of leak-tightness and outgassing in order to repeat these measurement in better conditions.
This is the first time that energy resolution measurements of alpha particles at high pressure with microbulk type of Micromegas are published. Similar measurements were done in [8] for Xe-CF4 gas mixtures, although with considerable worse values for the energy resolution. The reason seems to be the type of readout used (woven-mesh) of significantly less precision in the microscopic dimensions of the amplification structure. This points to very promising prospects for the application of these new type of readouts in calorimetric experiments, and more specifically to double beta decay.
6 Conclusions and prospects
We have presented first results from measurements of energy resolution at high energy and high pressures of Micromegas readouts. The main result regards measurements in argon/isobutane mixtures at 4 bar. Energy resolution down to 1.8% and 2% FWHM at the 241Am 5.5 MeV alpha line have been obtained for a wide range of drift/amplification field ratios, for percentages of isobutane of both 2% and 5% respectively. Possible evidence for better achievable resolutions (down to 0.7% and 0.9% FWHM respectively) are pointed out based on the asymmetry of the measured alpha peak. Complementary to these measurements, it has been determined that the quenching factor of alpha particles in argon + 5% isobutane is almost unity, by comparing x-ray and gamma peaks of the 241Am source.
Finally, preliminary measurements in pure Xenon have been presented, although the status of the system have been proved not to be good enough for electron drifting in Xenon, and effects of some attachment in the gas were found. Nevertheless, by performing pulse shape analysis on the digitized waveforms of the preamplifier outputs and performing cuts on the risetime, a conservative estimation of the energy resolution of 2.8% FWHM for 2 bar and 4.5% FWHM for 4 bar were found.
This is the first time that energy resolution measurements of alpha particles at high pressure with microbulk type of Micromegas are published. Even preliminary, the obtained energy resolution in pure Xenon approaches the requirements of double beta decay, opening very promising prospects for their use in these kind of experiments.
At present we are working on the upgrade of the system to improve its leak-tightness and outgassing in order to resume the measurements in pure Xenon in appropriate conditions of gas purity. We are also implementing a suitable recirculation system with adequate filters to keep the gas purity for longer periods.
We also plan to use an enlarged high pressure vessel big enough to contain high energy electron events, and perform similar measurements with photon/electron sources and not only with alphas. Furthermore, we intend to explore the effect of quenchers in Xenon in the energy resolution as well as going up to pressures higher than the ones in the present paper (from 5 to 10 bars).
Finally, we are also working on different enhancements of the readouts that could lead to improved working conditions in high pressure. For example, meshes with larger transparencies that the one used here would allow us to work at higher drift fields and partially overcome the effect of attachment that could jeopardize the detector performance at large drift distances. In addition, Micromegas with smaller amplification gaps should provide enhanced stability of operation and therefore better energy resolutions when operated at high pressure by virtue of the argument mentioned in the introduction and described in [5]. Amplification gaps below 50 microns pose new technical questions for the manufacturing techniques that are currently being addressed successfully. In particular, microbulks with gaps of 25 microns have recently being manufactured, and even smaller gaps are planned. We plan to test them in the context of the present line of work.
7 Acknowledgements
We wish to thank the staff of CEA/Saclay for the technical support received, in particular to S. Aune and J.P. Mols. We also want to thank colleagues from the CAST, HELLAZ and NEXT collaborations for many fruitful discussions. We acknowledge partial support from project FPA2007-62833 of the Spanish Science and Innovation Ministry (MCINN). F. I. and A. T. acknowledge support from grants AP2005-0360 of the MCINN and B024/2006 from the Aragon Regional Government.
References
- [1] R. Luscher et al., Phys. Lett. B 434 (1998) 407.
- [2] F. T. Avignone, G. S. King and Yu. G. Zdesenko, New J. Phys. 7 (2005) 6.
- [3] Y. Giomataris, P. Rebourgeard, J. P. Robert and G. Charpak, Nucl. Instrum. Meth. A 376 (1996) 29.
- [4] I. Giomataris et al., Nucl. Instrum. Meth. A 560 (2006) 405 [arXiv:physics/0501003].
- [5] I. Giomataris et al., Nucl. Instrum. Meth. A 419 (1998) 239.
- [6] G. D. Alkhazov, Nucl. Instrum. Meth. 89 (1970) 155.
- [7] J. Dolbeau, I. Giomataris, P. Gorodetzky, T. Patzak, P. Salin and A. Sarat, Nucl. Phys. Proc. Suppl. 138 (2005) 94.
- [8] L. Ounalli, J. L. Vuilleumier, D. Schenker and J. M. Vuilleumier, JINST 4 (2009) P01001 [arXiv:0810.0445 [hep-ex]].
- [9] J. D az on behalf of NEXT collaboration, talk given at the Fourth Symposium on Large TPCs for Low Energy Rare Event Detection, December 18th-19th, 2008, Paris. http://www-tpc-paris.cea.fr/
- [10] D. Sinclair on behalf of EXO collaboration, talk given at the Fourth Symposium on Large TPCs for Low Energy Rare Event Detection, December 18th-19th, 2008, Paris. http://www-tpc-paris.cea.fr/
- [11] T. Papaevangelou, talk given at the Fourth Symposium on Large TPCs for Low Energy Rare Event Detection, December 18th-19th, 2008, Paris. http://www-tpc-paris.cea.fr/
- [12] Glenn F. Knoll. Radiation Detection and Measurement. 3rd edition. John Wiley and Sons. 2000.