Gravitational wave backgrounds and the cosmic transition from Population III to Population II stars
Abstract
Using the results of a numerical simulation which follows the evolution, metal enrichment and energy deposition of both Population III and Population II stars, we predict the redshift dependence of the formation rate of black hole remnants of Population III stars with masses and of neutron stars (black holes) remnants of Population II stars with masses ().
We describe the gravitational wave spectrum produced by Population III and Population II sources adopting the most appropriate signals available in the literature and we compute the stochastic backgrounds resulting from the cumulative emission of these sources throughout the history of the Universe.
With the aim of assessing whether these backgrounds might act as foregrounds for signals generated in the Inflationary epoch, we compare their amplitudes with the sensitivity of currently planned and future ground/space-based interferometers.
The predicted Population III background lies in the sensitivity range of Ultimate-DECIGO, adding as a confusion-limited noise, with a peak amplitude of at Hz. However, differently to previous claims, we find that the gravitational wave background generated in the Inflationary epoch may dominate for Hz. At frequencies Hz, the background generated by Population II stellar remnants is much larger than that associated with Population III stars, with peak amplitudes ranging between at frequencies Hz: progenitors with masses in the range contribute with a nearly monotonically increasing behavior, whereas for stars with masses the resulting background shape depends on the waveforms used to represent the collapse signal.
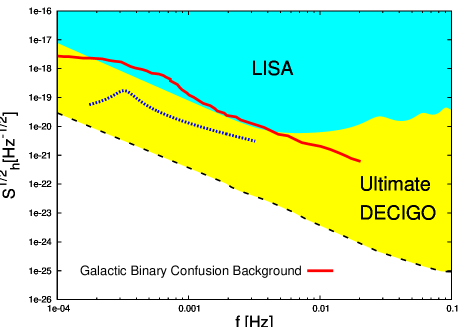
Finally, we explore a scenario in which Super Massive Stars, formed in protogalactic dark matter halos out of gas of primordial composition and irradiated by a strong ultraviolet background, collapse to Super Massive Black Holes (SMBHs). Even assuming, as an upper limit to their formation rate, that the mass density of these SMBHs at equals the presently observed value, the resulting gravitational wave background is too low to be detected from the space-based interferometer LISA; it is in the sensitivity range of Ultimate-DECIGO but in a frequency region seriously limited by the Galactic binary confusion background.
keywords:
gravitational waves - galaxies: formation -stars: early type - cosmology: theory.1 Introduction
Gravitational waves of cosmological origin could be the result of a large variety of astrophysical and cosmological processes that develop in the very early Universe. As a consequence, our high redshift Universe is expected to be permeated with a background of gravitational radiation. Depending on their origin, these stochastic gravitational wave backgrounds (GWBs) will show different spectral properties and features that it is important to investigate in view of a possible, future detection.
At present, several gravitational waves interferometers (VIRGO, LIGO, GEO600, TAMA) are operating and taking data in the frequency range . In the near future, the low-frequency window will be accessible to observations: the Laser Interferometer Space Antenna111http://lisa.nasa.gov/ (LISA) covering the frequency range (0.1-100)mHz will be launched, and next-generation space detectors targeting (0.1-1)Hz as Decihertz Interferometer Gravitational wave Observatory (DECIGO) and Big Bang Observer222http://universe.nasa.gov/program/vision.html (BBO) are being planned (Seto, 2006; Kudoh et al., 2006).
These experiments will have as possible objectives to detect or to set bounds on primordial GWBs, originating at the Big Bang, as well as backgrounds produced by the cumulative emission of astrophysical sources throughout the history of the Universe. In particular, the low-frequency region is where we expect the contribution of the GWB from Population III stars (Pop III) that are the first stars to form in the Universe. Pop III stars do not contain metals and their formation and evolution may be different from that of stars of later generations (see Bromm & Larson 2004 and Glover 2005 for thorough reviews of the subject). In particular, recent theoretical studies suggest that below a critical metallicity of the reduced cooling efficiency and large accretion rates favor the formation of massive stars, with characteristic masses (Omukai 2000; Bromm et. al 2001; Schneider et al. 2002, 2003, 2006a; Omukai et al. 2005).
These stars are predicted to collapse to black holes of comparable masses (except in the mass range where they are completely disrupted in pair-instability supernova explosions, Heger & Woosley 2002) and therefore are expected to be efficient sources of gravitational waves.
An earlier estimate of the GWB produced by these stars was done by Schneider et al. (2000) and de Araujo et al. (2002), in addition to that associated to core-collapse supernovae (Ferrari et al., 1999a, b; de Araujo et al., 2004). However, these earlier studies were limited by our poor understanding of the characteristic masses and formation rates of Pop III stars. More recently, Buonanno et al. (2005), Sandick et al. (2006) and Suwa et al. (2007a) pointed out that in some regions of the parameter-space and depending on the adopted Pop III star formation rate, the GWB produced by the collapse of these first stars could be comparable or mask almost completely the primordial background predicted by standard Inflationary models. In addition, Buonanno et al. (2005) and Sandick et al. (2006) have taken into account the contribution associated to core-collapse supernova events (the end-product of Pop II stars with progenitor masses ) in order to investigate in which frequency ranges these two components could be discriminated.
In order to give a realistic estimate of the GWB spectrum produced by the formation of the black holes remnants of the first stars, it is necessary to (i) reduce the big uncertainty related to the prediction of Pop III star formation rate and (ii) adopt suitable models for the gravitational wave signals emitted during the collapse of these primordial stars.
This paper is an attempt to satisfy these two requirements. We compute the GWB produced by remnants of Pop III stars in the mass range (100-500) using the Pop III cosmic star formation rate obtained by Tornatore et al. (2007a) in a recent numerical simulation which follows the evolution, metal enrichment and energy deposition of both Pop III and Pop II stars, and give a reliable estimate of their relative rates at high redshift. As will be discussed later, we adopt as a template for the gravitational waveforms associated to the collapse of Pop III stars the results of recent numerical simulations by Suwa et al. (2007a) and discuss the related uncertainties comparing with other independent studies (Fryer et al., 2001; Liu et al., 2007; Suwa et al., 2007b). We also evaluate the contribution to the GWB of Pop II stars, which explode as core-collapse supernovae leaving a neutron star (progenitor masses in the range ) or a black hole remnant (progenitor masses between ), or which directly collapse to black holes (progenitor masses larger than ). In these ranges of Pop II progenitor masses we choose the most appropriate gravitational wave signals available in the literature.
The plan of the paper is as follows. In Section 2 we briefly describe the numerical simulation performed by Tornatore et al. (2007a) and the model for the Pop III/Pop II cosmic star formation rate evolution that we have adopted in our analysis. In Sections 3 and 4 we sketch out the main features of the waveforms which describe the gravitational emission of single Pop III and Pop II sources. In Section 5 we present the density parameter, , of the GWBs, discuss their detectability by existing and planned detectors and the possibility that they might be foregrounds limiting the detection of primordial GWBs. In Section 6 we explore the GWB produced by Super Massive Star formed in metal-free protogalaxies at redshift . Finally, in Section 7 we draw our conclusions.
Throughout our work we have adopted a CDM cosmological model with parameters , , , , in agreement with the three-year WMAP results (Spergel et al., 2007).
2 The Population III/Population II cosmic star formation rate
Our present understanding of Pop III star formation suggests that these stars are not necessarily confined to form in the first dark matter halos at redshift but may continue to form during cosmic evolution in regions of sufficiently low metallicity, with . Thus, the Pop III star formation rate and the cosmic transition between Pop III and Pop II stars is regulated by the rate at which metals are formed and mixed in the gas surrounding the first star forming regions, a mechanism that we generally refer to as chemical feedback.
Semi-analytic studies which implement chemical feedback generally find that, due to inhomogeneous metal enrichment, the transition is extended in time, with coeval epochs of Pop III and Pop II star formation, and that Pop III stars can continue to form down to moderate redshifts, (Scannapieco et al. 2003; Furlanetto & Loeb 2005; Schneider et al. 2006b). Yet, a direct observational evidence for the existence of Pop III stars is still lacking.
To better assess the validity of these semi-analytic models, Tornatore et al. (2007a) have performed a set of cosmological hydrodynamic simulations with an improved treatment of chemical enrichment (Tornatore et al., 2007b). In the simulation, it is possible to assign a metallicity-dependent stellar initial mass function (IMF). When Pop II stars are assumed to form according to a Salpeter IMF with and lower (upper) mass limit of (). Stars with masses in the range explode as Type-II SNe and the explosion energy and metallicity-dependent metal yields are taken from Woosley & Weaver (1995). Stars with masses do not contribute to metal enrichment as they are assumed to directly collapse to black holes. Very massive Pop III stars form in regions where ; since theoretical models do not yet provide any indication on the shape of the Pop III IMF, Tornatore et al. (2007a) adopt a Salpeter IMF shifted to the mass range ; only stars in the pair-instability range () contribute to metal-enrichment and the metal yields and explosion energies are taken from Heger & Woosley (2002). The simulation allows to follow metal enrichment properly accounting for the finite stellar lifetimes of stars of different masses, the change of the stellar IMF and metal yields. The numerical schemes adopted to simulate metal transport ad diffusion are discussed in Tornatore et al. (2007b) to which we refer the interested reader for more details.
The top panel in Fig. 1 shows the redshift evolution of the cosmic star formation rate and the contribution of Pop III stars predicted by the simulation333The results shown in Fig. 1 refer to the fiducial run in Tornatore et al. (2007a) with a box of comoving size Mpc and (dark+baryonic) particles.. In this model, the critical metallicity which defines the Pop III/Pop II transition is taken to be , at the upper limit of the allowed range. However, additional runs show that decreasing the critical metallicity to reduces the Pop III star formation rate by a factor . It is clear from the figure that Pop II stars always dominate the cosmic star formation rate; however, in agreement with previous semi-analytic studies, the simulation shows that Pop III stars continue to form down to , although with a decreasing rate. Over cosmic history, the fraction of baryons processed by Pop III stars is predicted to be .

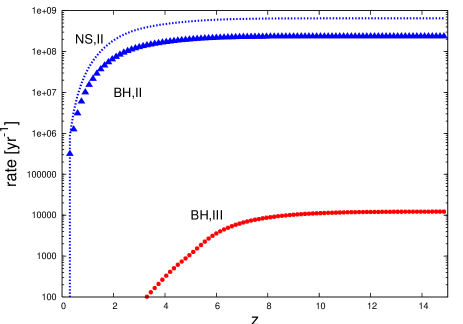
The number of gravitational wave sources formed per unit time out to a given redshift can be computed integrating the cosmic star formation rate density, , on the comoving volume element and restricting the integral over the stellar IMF in the proper range of progenitor masses, that is
| (1) | |||
| (2) | |||
| (3) |
where the factor at the denominator takes into account the time-dilation effect and the comoving volume element can be expressed as,
| (4) | |||
Because of the different gravitational wave emission mechanisms, we have explicitly divided Pop II sources between those that lead to the formation of a neutron star remnant (NS,II) and those which collapse to black holes (BH,II). Pop III sources have been considered to be all stars which collapse directly to black holes (BH,III). Therefore we cut the mass range of pair instability supernovae because in this range of masses the progenitors encounter the electron-positron pair creation instability and are completely disrupted by the explosion (Heger & Woosley, 2002). Note, however, that these results strictly apply only to non-rotating stellar models and that rotation may affect mass-loss, nucleosynthesis, and the pre-supernova structure. Recent analysis show that, at least for metal-free stars (), up to 10% of the initial stellar mass can be lost when the critical break-up limit is reached but this is not important enough to change their fate (Ekstrom et al., 2008). The results are shown in the bottom panel of Fig. 1. It is evident that the rate of Pop III stars collapse to black holes at is times smaller than the rate of gravitational wave sources associated to Pop II stars. The latter are dominated by core-collapse SNe leaving neutron star remnants, because of the adopted shape of the stellar IMF.
To compute the gravitational signal emitted by each single source, it is important to estimate the fraction of the initial stellar mass which ends up in the final remnant NS or BH. For Pop III stars, we will neglect mass loss and assume that the final BHs have the same mass of their progenitor stars (). For Pop II stars with masses in the Type-II SNe progenitor range (), the mass of the remnant is computed according to the original Woosley & Weaver (1995) grid; for larger masses () the mass of the final BH is taken to be equal to the helium core mass before the collapse, .
3 Pop III stars as gravitational wave sources
Recent studies have shown that the collapse of Pop III stars to black holes could be a much more efficient source of gravitational waves than today’s supernovae populations (Fryer et al., 2001; Suwa et al., 2007a). An estimate of the total energy released in gravitational waves during the first few seconds of collapse has been done in Fryer et al. (2001),
| (5) |
In their two-dimensional numerical simulations the authors have considered the entire life and death of a zero-metallicity star of , taking the effects of general relativity and neutrino transport444Neutrino transport is followed in a parameter-free way. into account. As first noted in Fryer et al. (2001), the main features of the Pop III collapse are different from those that appear in ordinary core-collapse SNe. In the latter case, core collapse is halted when the central density exceeds g cm-3 and when neutron degeneracy and nuclear forces become relevant. Conversely, the core of a star is so large that it collapses into a black hole before nuclear forces can affect it (Suwa et al., 2007a; Fryer et al., 2001).
In addition, as noted by Fryer et al. (2001) and Suwa et al. (2007a), rotation and higher central temperatures in Pop III progenitors, may halt the collapse of the core and produce a weak thermal bounce at lower central density of a few times g cm-3. After this bounce, the final fate of hot neutronized core, as soon as entropy gradients becomes negligible, is to collapse to a black hole.
Lacking more detailed numerical models on the collapse of Pop III stars, Buonanno et al. (2005) have modelled the gravitational wave signal emitted in the collapse of a Pop III star using as a template the waveform of an ordinary core-collapse supernova,
| (6) |
as obtained by Muller et al. (2004) using sophisticated two-dimensional numerical simulations. The stellar core-collapse is taken to be axially symmetric and is based on a detailed implementation of Boltzmann’s equation for neutrino transport (Muller et al. 2004). In equation (6), is the Fourier transform of , G is Newton’s constant, is the total energy emitted in neutrinos, is the average value of the anisotropy parameter (defined in Muller & Janka 1997), is the distance of the supernova event, and are respectively 200Hz and 300Hz. This choice of and values is motivated in order to reproduce the spectral shape of the s15r model simulated in Muller et al. (2004).
The energy spectrum adopted by Buonanno et al. (2005) therefore is
| (7) |
with the additional requirement that the total energy emitted had the same value found by Fryer et al. (2001),
| (8) |
The resulting GW spectrum is shown in Fig. 2.
More recently, Suwa et al. (2007a) have studied the rotational collapse of Pop III stars in the same mass range. These studies have been performed using two-dimensional hydrodynamic simulations, using a realistic equation of state based on the relativistic mean field theory (Shen et al., 1998), and taking neutrino cooling and state-of-the-art reactions of neutrinos into account. For comparison with the previous study of Fryer et al. (2001), they discuss the GW emission from the collapse of a Pop III star and assume the same initial core configuration. The total energy emitted in gravitational waves is found to be, , that is a factor 10 smaller than the result of Fryer et al. (2001) (see eq.5), and the authors ascribe this discrepancy to the assumed different initial angular momentum distributions.
In Fig. 2 the solid line shows the GW spectral distribution obtained in Suwa et al. (2007a). As it is clear from the comparison of the two curves, the contribution to GW emission from neutrinos in the model of Suwa et al. (2007a) dominates the spectrum below 10 Hz and the matter contribution peaks at around 20 Hz, whereas adopting the spectral energy distribution of ordinary supernovae, as done by Buonanno et al. (2005), these frequencies are shifted in the kHz range.
As discussed by Fryer et al. (2001) and Suwa et al. (2007a), these differences are expected, given the different nature of the progenitor and the distinct collapse dynamics. It is interesting to note, as shown by Suwa et al. (2007b), that since most of the inner core is absorbed into the black hole, only about of the gravitational energy of the core can be carried away by neutrinos (even in the case of the most rapidly rotating model). On the other hand, neutrinos carry away of the gravitational energy of proto-neutron stars in ordinary core-collapse supernovae.
4 Pop II stars as gravitational wave sources
In spite of the many elaborate studies carried out so far, the physics involved in core-collapse supernovae is not yet completely understood. During the past years, theorists have done many efforts to give reliable predictions of the gravitational wave signals associated to these catastrophic events (for recent reviews we refer to Kotake et al. 2006 and Ott 2008).
In order to estimate the stochastic gravitational wave background from Pop II stars, we have adopted different single source gravitational wave spectra obtained from the most sophisticated numerical simulations available in the literature.
The most recent calculations incorporate general relativity as well as the most relevant physics, such as a microphysical finite-temperature nuclear equation of state, a scheme to account for electron capture and neutrino losses during the collapse, an accurate treatment of the neutrino transport (Burrows et al., 2006; Ott et al., 2007a, b; Dimmelmeier et al., 2007, 2008).
These studies seem to indicate that, in spite of the dependence of the gravitational wave burst on the precollapse central angular velocity, on the progenitor mass, on the equation of state, etc, all the simulated waveforms exhibit a generic bounce dynamics and signal morphology (Ott et al., 2007a, b; Dimmelmeier et al., 2007, 2008). The bounce dynamics seems to be governed by the stiffening of the equation of state at nuclear density and, as a consequence, the resulting waveforms show one pronounced large spike at the bounce and a gradually damped ring-down (Dimmelmeier et al., 2008).
4.1 Pop II progenitors with masses in the range [8-20]
To model the single source gravitational spectrum for Pop II stars with masses in the range [8-20], we have used equation (7) adopting the predicted by the model labelled as s15r in Muller et al. (2004). This choice provides the most optimistic conditions for the total energy released in gravitational waves (Muller et al. 2004), and has been considered to be representative of the emission in core-collapse SNe by previous studies (Buonanno et al. 2005; Sandick et al. 2006). We have assumed that the total energy emitted in gravitational waves is (that corresponds to a conversion efficiency of the mass energy in gravitational waves of , Muller et al. 2004). The latest studies carried out by Dimmelmeier et al. (2007, 2008) confirm that this choice for the single source spectrum is representative of core-collapse supernovae with progenitors in the above mentioned mass range.
Recently, Burrows et al. (2006) have proposed an acoustic mechanism for core-collapse supernovae associated to stellar progenitors in the mass range . In this model, g modes (mainly l=1,2 core g mode) are excited since the proto-neutron star undergoes the standing-accretion-shock instability (SASI, see for a review on the subject Burrows et al. 2006; Ott et al. 2006; Ott 2008) induced by turbolence and accretion downstream of an unstable and deformed stalled supernova shock. This mechanism has been suggested to be sufficient to drive a supernova explosion.
In Ott et al. (2006) the authors investigate this mechanism using a two dimensional axisymmetric newtonian simulation. The results seem to indicate that the emission process in core-collapse supernovae may be dominated by the oscillations of the proto-neutron star core. The authors explore different type of progenitors and find that the more massive is the progenitors iron core, the higher are the frequency and oscillation amplitudes and, as a consequence, the stronger is the gravitational wave emission. It is interesting to note that for these models the contribution to gravitational waves of anisotropic neutrino emission is completely negligible compared to that associated to core oscillations. In particular their estimate of the contribution of the anisotropic neutrino emission (calculated as in Epstein 1978; Muller & Janka 1997) is five times smaller than previous one obtained in Muller et al. (2004). The authors opinion is that this is due to the different approach in treating neutrino transport. We refer the interested reader to the original paper for further details on the subject.
The total energies emitted in gravitational waves are around (for a non rotating progenitor of 11 and a slowly rotating progenitor of 15 ) with the exception of a non rotating progenitor of 25 , with a very massive iron core (1.92), where the emitted energy is as large as . It is important to note that these results are based on 2D Newtonian gravity simulations; rotation and 3D simulations may change the structure of the SASI and consequently the energy emitted in gravitational waves, as point out by Ott et al. (2006). As an extreme and promising possibility, we also explore the gravitational background produced by core-collapse SNe through this mechanism.
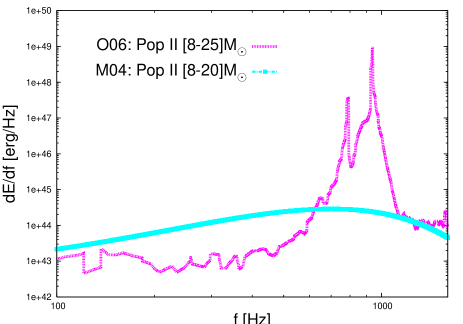
The energy spectra predicted by Muller et al. (2004) and Ott et al. (2006) are shown in Fig. 3. If we compare the two spectra, we see that the energy spectrum obtained in Ott et al. (2006) shows a pronounced gravitational wave emission in the frequency range Hz, the first burst of gravitational emission is centered about Hz, and the second one near Hz, due to the excitement of an l=2 core g-mode.
4.2 Pop II progenitors with masses in the range [20-100]
Progenitors with masses between [20-100] may lead to a prompt collapse to black hole or to the formation of a proto-neutron star that, due to the subsequent fallback will end its life as a black hole (Sekiguchi & Shibata, 2005).
Recently, Sekiguchi & Shibata (2005) have run numerical simulations of the collapse of rotating massive cores associated to stellar progenitor masses in the range [51-98]. These simulations have been performed in full general relativity using a parametric equation of state (Dimmelmeier et al. 2002a, b) that mimic a realistic one 555This realistic equation of state is the EOS Shen (Shen et al. 1998) and we note that this is the same EOS used in Ott et al. (2006) and Dimmelmeier et al. (2008).. Gravitational waveforms are computed in terms of the quadrupole formula taking into account only matter motions and neglecting neutrino contribution (we refer the interested reader to the original paper for further details).
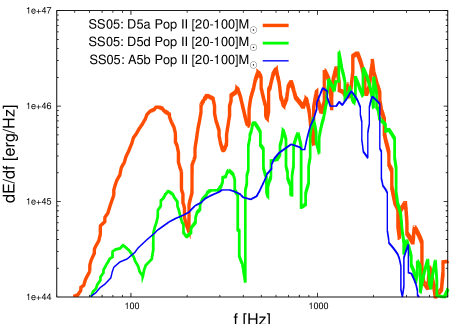
For the purpose of the present analysis, we adopt the gravitational wave spectra from models D5a, D5d and A5b of Sekiguchi & Shibata (2005), which show the strongest gravitational wave emission with efficiencies ranging between . Despite the fact that the selected models are, in some cases, associated to a specific choice of the progenitor stellar mass, we will neglect this dependence and assume that the same model holds for all progenitors in the range. This approximation may be less accurate for black holes forming through fallback from progenitors with masses ; in fact, the evolution of the carbon/oxygen envelope as well as neutrino cooling (which will play a role for longterm fallback with duration 100 ms) are not considered in the simulations (Sekiguchi & Shibata, 2005).
In Fig. 4 we have plotted the energy power spectra for models D5a, D5d, A5b. For all three models, the spectra peak at kHz. The energy power spectrum of model D5a is the result of a strong bipolar explosion (this feature is found for the first time in Sekiguchi & Shibata 2005); it is broad in the low frequency region and flatter than those of the other two models. All spectra peak at kHz. Due to the smaller progenitor mass () the energy spectrum of model A5b shows a lower peak then in model D5d (progenitor mass ) and shifted to lower frequencies.
5 Gravitational Wave Background from Pop III/Pop II stars
In this section we discuss the contribution of the different gravitational wave sources to the background radiation. Following Schneider et al. (2000), the spectral energy density of the stochastic background can be written as
| (9) |
where is the differential source formation rate,
| (10) |
and , is the locally measured average energy flux emitted by a source at distance . For sources at redshift it becomes,
| (11) |
where is the redshifted emission frequency , and is the luminosity distance to the source. It is customary to describe the GWB by a dimensionless quantity, the closure energy density , which is related to the spectral energy density by the equation
| (12) |
where is the cosmic critical density.
In Fig. 5, we show the function evaluated by assuming a frequency cut-off 1 Hz in the single source spectrum. This choice is motivated by the fact that current numerical simulations describe the source collapse at most for a few seconds, and cannot predict the emission below a fraction of Hz. We see that below Hz the Pop III GWB dominates over the Pop II background (except for a very small region around Hz, where the Pop III GWB has a minimum); its maximum amplitude is at Hz.
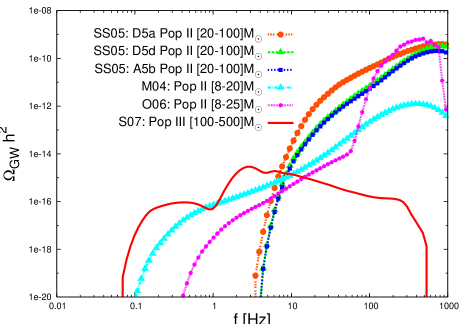
At larger frequencies the background produced by Pop II stars is much larger than that of Pop III. Stars with progenitors in the range (20-100) contribute with a nearly monotonically increasing behavior, reaching amplitudes at Hz. For stars with progenitors in the range (8-25) the GWB has a shape which depends on the waveform used as representative of the collapse: that obtained using the waveform of Muller et al. (2004) is quite smooth and peaks at Hz, with amplitude . The background obtained using waveforms produced by the core-collapse model of Ott et al. (2006), instead, is comparable in amplitude with those produced by more massive progenitors, reaching the maximum amplitude at Hz.
To evaluate the background in the low frequency region 0.1 Hz, we can apply the so called zero-frequency limit (Smarr 1977; Epstein 1978; Muller & Janka 1997; Buonanno et al. 2005) and extend the single source waveform to lower frequencies (using equation 6 for model M04, and tabulated values for models S07 and O06), where the emission is dominated by the neutrino signal (see Fig. 2).
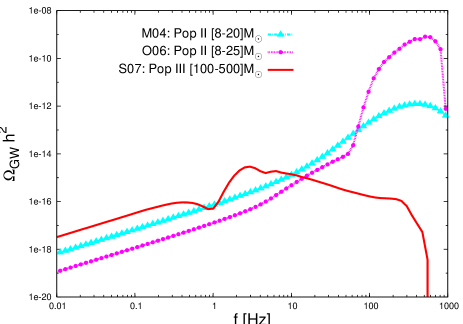
The results are shown in Fig. 6, where we plot for all models shown in Fig. 5, with the exception of the Pop II signals derived from the Sekiguchi & Shibata (2005) single source spectra because in these computations neutrinos contribution is neglected and the extension would not be appropriate.
In the low frequency region, because tends to a constant as shown in Fig. 2. In addition, the Pop III- dominates over the Pop II, because the GW emission increases with the stellar progenitor mass (the more massive is the progenitor, the larger is the neutrino luminosity).
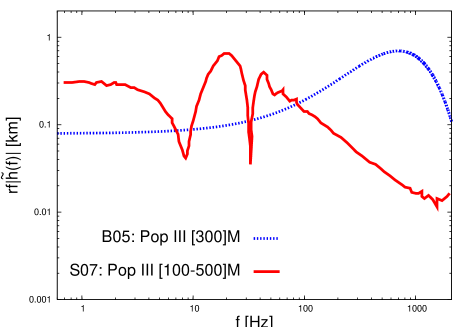
We can compare our results with those recently obtained by Suwa et al. (2007a), Sandick et al. (2006) and Buonanno et al. (2005), who adopt different Pop III star formation rates and/or different single source GW waveforms. We find that our predicted Pop III GWB is comparable to the lower limit reported by Suwa et al. (2007a); they use the same single source waveform, but a different star formation rate derived from Sandick et al. (2006) and artificially shifted downward by a factor 7000. For this reason, they predict a baryon fraction in Pop III stars of , a value which is much closer to our numerical result (see Section 2).
Our Pop III background is smaller than that found by Sandick et al. (2006) and Buonanno et al. (2005). In Buonanno et al. (2005), the authors make a crude estimate of the Pop III star formation rate, assuming that all Pop III stars form in a burst at with the same mass (300 ), and varying the fraction of baryons which go into Pop III stars in the range . Comparing with their lower limit background, our result shows a peak at lower frequency and with smaller amplitude, and a larger low-frequency limit. These differences are naturally explained by the adopted single source waveform (see Fig. 7). Finally, Sandick et al. (2006) show a cumulative GWB from Pop III and Pop II stars for a cosmic star formation model where the baryon fraction in Pop III stars is , much higher than that predicted by the numerical simulation of Tornatore et al. (2007a) (see Section 2). It is not surprising, therefore, that their signal associated to Pop III stars is significantly higher than in our analysis; furthermore, the peak amplitude is shifted to frequencies Hz due to the difference in the assumed single source waveform (see Fig. 7). The differences between the Pop II GWBs are less pronounced, as the predicted Pop II star formation rates are comparable, and the adopted waveform for progenitors with masses is the same; still, due to the range of efficiency assumed in the present analysis for the collapse of progenitors (Sekiguchi & Shibata, 2005), our Pop II GWB is times smaller in amplitude than that predicted by Sandick et al. (2006).
5.1 Detectability
In this section we discuss the possibility that Pop II and Pop III backgrounds might act as a foreground, limiting the sensitivity of the detectors to the primordial GWB produced during the inflationary epoch (Kudoh et al., 2006; Seto, 2006, 2008).
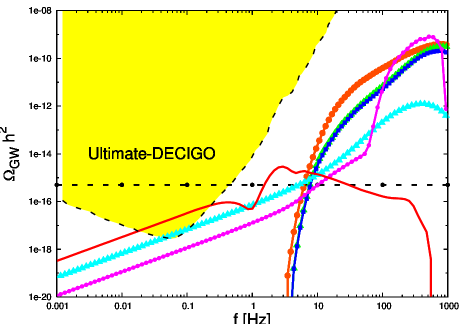
In Fig. 7 and Fig. 8 we plot as a function of frequency and the sensitivity curves of future detectors. In Fig. 7 we plot the sensitivity of LIGOIII used in Buonanno (2003) and the detection limit for two proposed missions, LISA TNG666http://www.srl.caltech.edu/ shane/sensitivity/ (The-Next-Generation) and BBO in the so-called BBO Grand configuration (Seto, 2006). In Fig. 8 we plot the detection limit of DECIGO in the so-called Ultimate-DECIGO configuration, whose sensitivity is only limited by the standard quantum limit (Kudoh et al., 2006).
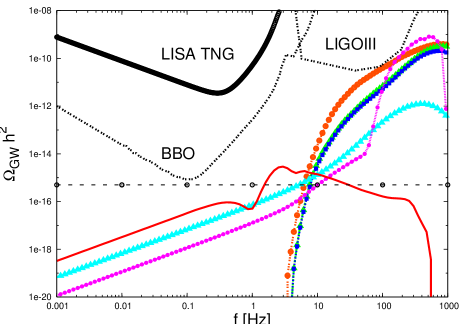
All the sensitivity curves are obtained assuming correlated analysis of the outputs of independent spacecraft (or of different ground-based detectors) (Buonanno, 2003; Kudoh et al., 2006; Seto, 2006), with the exception of LISA TNG. It is known that a single detector can only place upper limits on the amplitude of a GWB.
The upper limit of the GWB generated in the Inflationary epoch, is given by the dashed horizontal line in Fig. 7 and 8. It is derived from a recent update of cosmological constraints on inflationary models (Cosmic Microwave Background measurements taken in combination with data from the Arcminute Cosmology Bolometer Kinney et al. (2006, 2008)). The data analysis carried out by Kinney et al. (2006, 2008) is consistent with a primordial spectrum with no running spectral index and zero tensor amplitude. The authors place an upper limit to the tensor/scalar ratio at confidence level. According to these results, we have evaluated from equation (6) of Turner (1997), with and no running of the spectral index of tensor perturbation.
As shown in Fig. 7, LIGOIII, BBO and LISA TNG have no chance to detect either the background produced by Pop III/Pop II stars and by inflation. From Fig. 8 we see that the astrophysical backgrounds are within the detection range of Ultimate-DECIGO. However, they are smaller than the background generated in the Inflationary epoch, which clearly dominates. The Pop III/Pop II background becomes dominant only for Hz. It is worth reminding that the estimate of the Inflationary GWB shown in Fig. 7 and 8 is an upper limit.
5.1.1 Duty Cycle
An important parameter which quantifies the efficiency of the emitters to generate a continuos signal in time domain is the duty cycle, . This is defined as the ratio between the typical duration of the signal emitted by a single source, and the average time interval between two successive episodes of emission. When 1, the overall signal is continuous; conversely, if , the resulting background is not continuous but rather characterized by a shot-noise structure.
An interesting feature of the GWBs produced by the collapse of Pop III/Pop II progenitors is that these backgrounds generate a signal with a peculiar shot-noise character, as suggested by Ferrari et al. (1999a); Schneider et al. (2000). In this case, the detector will receive a stationary sequence of bursts, with typical separations much longer than the average duration of each single burst. The duty cycle measured by a local observer and generated by all sources within the comoving volume out to a redshift can be written as
| (13) |
where is the average time duration of individual signals and is the number of sources formed per unit time at redshift .
| NS(Pop II) | BH(Pop II) | BH(Pop III) |
| 8.56 | 3.10 | 1.57 |
We have calculated the duty cycle for Pop II and Pop III GWBs, assuming that the typical for these events is the dynamical timescale at core bounce, ms and ms respectively. The results are illustrated in Table 1 and show that for Pop II GWBs and for Pop III GWBs.
This shot noise structure of Pop III/Pop II GWBs might enhance the ability to discriminate these backgrounds from the dominant instrumental noise and from signals generated in the early Universe, even in frequency ranges where the latter have a higher amplitude.
6 Gravitational Wave Background from Super Massive Stars
Recently, it has been suggested that Super Massive Black Holes (SMBH) with masses of may form in protogalactic dark matter halos with virial temperatures K provided that (i) the gas has primordial composition and (ii) it is irradiated by a strong ultraviolet (UV) flux (Bromm & Loeb, 2003). In these conditions, 3D hydrodynamics simulations show that, due to suppressed H2 formation, the gas cools to temperatures that are only somewhat smaller than the virial temperature of the host halo and condenses isothermally into very large clumps, with no sign of fragmentation. As a result, the primordial cloud collapses into a central compact object containing % of the total baryonic mass, possibly through an intermediate phase of Super Massive Star (SMS) formation, (we refer the interested reader to Bromm & Loeb 2003 for further details). This scenario would provide potentially detectable sources of gravitational waves and an alternative way to explain the presence of SMBHs with masses powering bright quasars at redshifts as high as (Volonteri & Rees, 2006). However, high redshift dark matter halos with K are likely already enriched with at least trace amounts of metals and dust produced by prior star formation in their progenitors. Indeed, it has been shown that, even in the presence of a sufficiently strong UV background, gas fragmentation is inevitable above a critical metallicity, whose value is between (in the absence of dust) and as low as for a dust-to-gas mass ratio of about (Omukai, Schneider & Haiman 2008). Therefore, the actual rate of formation of (SMSs) SMBHs remains uncertain.
Following Bromm & Loeb (2003), we can place an upper limit on the SMBH formation rate at requiring that their total mass density does not exceed the present-day observed value (Marconi et al. 2004; Merloni & Heinz 2008 and references therein), that is
| (14) | |||
where is the fraction of halos that contain a SMBH, is the SMBH mass which, following the results of the simulations, is assumed to scale with the halo mass as , is the Press-Schechter halo mass function at redshift , and is the dark matter halo mass corresponding to a virial temperature of K at ,
is the molecular weight, , and
for a flat cosmological model. For the adopted cosmological parameters, we find that , that is about 14% of protogalactic halos must verify the conditions suitable for SMBH formation to reproduce the presently observed mass density. From eq. (6) we can also estimate the average SMBH mass, which is found to be .
The gravitational collapse of a SMS to a SMBH has been studied by Saijo et al. (2002), Shibata & Shapiro (2002) and Liu et al. (2007). In these papers, the authors suggest that the collapse of a SMS to a SMBH may lead to the emission of an initial gravitational wave burst signal. In Shibata & Shapiro (2002) and Liu et al. (2007) the authors investigate the axisymmetric collapse of a uniformly rotating SMS near the mass-shedding limit at the onset of radial instability. These simulations are performed in full general relativity using a polytropic equation of state (with ) and neglecting neutrino emission and transport (probably not relevant for very massive progenitors because of their low density and temperature, as suggested by Liu et al. 2007). The authors estimate that of the total mass of the SMS is swallowed by the SMBH at the end of the collapse. Following Schneider et al. (2000), we have assumed that the single source spectrum emitted during the collapse of SMS can be modelled as a Lorenzian (for more details see also Schneider et al. 2000),
| (15) |
where with , , is the duration of the burst, is the normalization and
| (16) |
is the gravitational energy released in a burst,
| (17) |
and is the efficiency. We assume that the SMS collapses to SMBH of comparable mass with an efficiency of . The adopted value was found by Fryer et al. (2001) in the collapse scenario of very massive progenitors (see Section 3). This is a rough approximation of the gravitational wave spectrum but, in this uncertain evolutionary scenario, gives us the possibility to catch its main features. Using the estimated SMBH rate and the single source energy spectrum described above, we can compute the generated GWB using eq. (9). In Fig. 9 we plot the spectral strain amplitude and the sensitivity curves of LISA and Ultimate-DECIGO. The estimated signal is too low to be detected by LISA and it lies above the foreseen sensitivity of Ultimate-DECIGO in the frequency range 0.1 mHz1 mHz; however, in this frequency interval the sensitivity of Ultimate-DECIGO (as well as that of LISA) is limited by the unresolved background produced by the gravitational wave emission of Galactic compact binaries that acts as a confusion noise (Nelemans 2009), shown in Fig. 9 with a solid line (Sathyaprakash & Schutz, 2009). A possible future detection of this signal with Ultimate-DECIGO would require the application of sophisticated algorithms to data analysis, similar to those that have been proposed for the LISA experiment (Crowder & Cornish 2007).
7 Discussion and conclusions
In this paper, we estimate the GWB produced by the collapse of Pop III/Pop II progenitors. We use a new cosmic star formation history obtained from a recent numerical simulation performed by Tornatore et al. (2007a). We find that our Pop III/Pop II GWB is below the sensitivity range of space detectors like BBO and LISA TNG in the present (proposed) configuration, but is in the sensitivity range of Ultimate-DECIGO, adding as a confusion-limited component. Differently to previous results of Buonanno et al. (2005), Sandick et al. (2006) and Suwa et al. (2007a) we find that for Hz, Pop III GWB is masked by the GWB generated in the Inflationary epoch.
Clearly, the predicted amplitude of Pop III/Pop II GWB depends on the adopted star formation model and on the assumed single source GW spectrum, and we want briefly to point out the related uncertainties. We have assumed, as a template for GW emission associated to Pop III stellar collapse, the waveform recently obtained by Suwa et al. (2007a). The waveforms they find exhibit features that are significantly different if compared to those found in the ordinary core-collapse SNe. As noted by the authors, their study is based on a Newtonian simulation, whereas a detailed understanding of Pop III stars collapse would require a fully general relativistic approach (Suwa et al., 2007a).
In addition, the assumed Pop II GW spectra are affected by the incomplete understanding of the SN explosion mechanism, by the complexity of the physics involved (equation of state, structure of the stellar core, different approaches in treating neutrino transport, etc.) and by different approaches in numerical modeling.
The variations among different single source gravitational wave spectra lead to comparable uncertainties in the corresponding stochastic backgrounds: as an example, a two orders of magnitude difference is found for the peak amplitude of the signal associated to Pop II stars leading to neutron star remnants, depending on whether the spectrum by Muller et al. (2004) or the upper limit provided by Ott et al. (2006) is adopted.
It is important to note that while the estimated backgrounds depend on the Pop III star formation model, such as the adopted IMF and the value of , the advantage of our approach is that it allows a self-consistent description of the star formation and chemical evolution. Moreover, variations of the adopted parameter within the allowed range () lead to a factor decrease of the resulting Pop III star formation rate. As long as Pop III stars are assumed to be very massive, with , the resulting star formation rate is not very sensitive to the adopted IMF; this is because only stars with masses in the relatively small pair-instability progenitor range (140 - 260 ) contribute to metal enrichment. If Pop III stars are assumed to form with masses , the smaller metal yields lead to a larger number of regions and therefore to a larger Pop III star formation rate. Finally, additional simulations with different box sizes and resolution show that the scatter in the Pop III/Pop II ratio remains always (Tornatore et al., 2007a).
In addition, we have given an upper limit to the GWB produced by the collapse of SMSs to SMBHs, events that may occur in metal-free halos with virial temperatures K at exposed to a strong UV background (Bromm & Loeb, 2003). LISA has no chance to detect this low signal and Ultimate-DECIGO, in this frequency region, is seriously limited by Galactic binary foregrounds.
In conclusion, we want to point out that if future space missions, like Ultimate-DECIGO, will detect the Inflationary GWB, it will be necessary to disentangle this background from those produced by astrophysical sources.
Recent studies performed by Drasco & Flanagan (2003) and Seto (2008) are moving in this direction suggesting different detection methods for non-Gaussian GWB. In particular Seto (2008) has proposed a method to check if the detected GWB is an inflation-type background or if it is contaminated by undetectable weak burst signals from Pop III/Pop II collapse. If, in the future, it will be possible to extract information on the Pop III GWB component, we can have a tool to investigate the formation history of these first stars.
Acknowledgments
Stefania Marassi thanks the Italian Space Agency (ASI) for the support. This work is funded with the ASI CONTRACT I/016/07/0.
References
- Allen & Romano (1999) Allen B., Romano J. D., 1999, Phys. Rev. D, 59, 102001
- Bromm et. al (2001) Bromm V., Ferrara A., Coppi P.S., Larson R.B., 2001, MNRAS, 328, 969
- Bromm & Loeb (2003) Bromm V., Loeb A., 2003, APJ, 596, 34
- Bromm & Larson (2004) Bromm, V., Larson R.B., 2004, ARAA, 42, 79
- Buonanno et al. (2005) Buonanno A., Sigl G., Raffelt G. G., Janka H., Muller E., 2005, Phys. Rev. D, 72, 084001
- Buonanno (2003) Buonanno A., 2003, gr-qc/0303085
- Burrows et al. (2006) Burrows A., Livne E., Dessart L., Ott C. D., Murphy J., 2006, APJ, 640, 878
- Crowder & Cornish (2007) Crowder J., Cornish N., Phys. Rev. D, 75, 043008
- de Araujo et al. (2004) de Araujo J. C. N., Miranda O. D., Aguiar O. D., 2004, MNRAS, 348, 1373
- de Araujo et al. (2002) de Araujo J. C. N., Miranda O. D., Aguiar O. D., 2002, MNRAS, 330, 651
- Epstein (1978) Epstein R., 1978, APJ, 223, 1037
- Ferrari et al. (1999a) Ferrari V., Matarrese S., Schneider R., 1999, MNRAS, 303, 247
- Ferrari et al. (1999b) Ferrari V., Matarrese S., Schneider R., 1999, MNRAS, 303, 258
- Flanagan (1993) Flanagan E. E., Phys. Rev. D, 1993, 48, 2389
- Fryer et al. (2001) Fryer C. L., Woosley S. E., Heger A., 2001, APJ 550, 372
- Dimmelmeier et al. (2008) Dimmelmeier H., Ott C. D., Marek A., Janka H. T., 2008, Phys. Rev. D. 78, 064056
- Dimmelmeier et al. (2007) Dimmelmeier H., Ott C. D., Marek A., Janka H. T., Muller E., 2007, Phys. Rev. Lett. 98 (25), 251101
- Dimmelmeier et al. (2002a) Dimmelmeier H., Font J. A., Muller E., 2002, 388, 917
- Dimmelmeier et al. (2002b) Dimmelmeier H., Font J. A., Muller E., 2002, 393, 523
- Drasco & Flanagan (2003) Drasco S., Flanagan E. E., Phys. Rev. D, 2003, 67, 082003
- Ekstrom et al. (2008) Ekstrom, S., Meynet, G., Chiappini, C., Hirshi, R., Maeder, A., 2008, A&A, 489, 685
- Furlanetto & Loeb (2005) Furlanetto S.R., Loeb A., 2005, ApJ, 634, 1
- Glover (2005) Glover, S., 2005, SSR, 117, 445
- Heger & Woosley (2002) Heger A., Woosley S. E., 2002, ApJ, 567, 532
- Heger & Woosley (2003) Heger A. et al., 2003, ApJ, 591, 288, 300
- Hopkins & Beacom (2006) Hopkins, Beacom, 2006, ApJ 651, 142
- Kinney et al. (2006) Kinney W. H., Kolb E.W., Melchiorri A., Riotto A., 2006, Phys. Rev. D. 74, 023502
- Kinney et al. (2008) Kinney W. H., Kolb E.W., Melchiorri A., Riotto A., 2008, Phys. Rev. D. 78, 087302
- Kotake et al. (2006) Kotake K., Sato K., Takahashi K., 2006, Rep. Prog. Phys. 69, 971
- Kudoh et al. (2006) Kudoh H., Taruya A., Takashi H., Himemoto Y., 2006, Phys. Rev. D, 73, 064006
- Lattimer & Swesty (1991) Lattimer J. M, Swesty F. D., 1991, Nucle. Phys. A. 535, 331
- Liu et al. (2007) Liu Y.T., Shapiro S. L., Stephens B. C., 2007, Phys. Rev. D. 76, 084017
- Marconi et al. (2004) Marconi A., Risaliti G., Gilli R., Hunt L. K., Maiolino R., Salvati M. 2004, MNRAS, 351, 169
- Merloni & Heinz (2008) Merloni A., Heinz S. 2008, MNRAS, 388, 1011
- Muller et al. (2004) Muller E., Rapp M., Buras R., Janka H. T., Shoemaker D. H., 2004, APJ 603, 221
- Muller & Janka (1997) Muller E., Janka H. T., 1997, 317, 140
- Nelemans (2009) Nelemans G., arXiv:0901.1778, accepted for publication in Class. and Quantum Grav.
- Omukai (2000) Omukai K., 2000, ApJ, 534, 809
- Omukai et al. (2005) Omukai K., Tsuribe T., Schneider R., Ferrara A., 2005, ApJ, 626, 627
- Omukai et al. (2008) Omukai K., Schneider R., Haiman Z. 2008, ApJ, 686, 801
- Ott (2008) Ott C. D., 2008, topical rewiev, arXiv:0809.0695
- Ott et al. (2006) Ott C. D., Burrows A., Dessart L., Livne E., 2006, PRL, 96 201102
- Ott et al. (2007a) Ott C. D., Dimmelmeier H., Marek A., Janka H. T., Hawke I., Zink B., Schnetter, 2007, PRL, 98, 261101
- Ott et al. (2007b) Ott C. D., Dimmelmeier H., Marek A., Janka H. T., Hawke I., Zink B., Schnetter, 2007, CQG, 24, S139
- Sandick et al. (2006) Sandick P., Olive K. A., Daigne F., Vangioni E., 2006, Phys. Rev. D, 73, 104024
- Scannapieco et al. (2003) Scannapieco E., Schneider R., Ferrara A., 2003, ApJ, 589, 35
- Schneider et al. (2000) Schneider R., Ferrara A., Ciardi B., Ferrari V., Matarrese S., 2000, MNRAS, 317, 385
- Schneider et al. (2002) Schneider R., Ferrara A., Natarajan P., Omukai K., 2002, ApJ, 571, 30
- Schneider et al. (2003) Schneider R., Ferrara A., Salvaterra R., Omukai K., Bromm V. 2003, Nature, 422, 869
- Schneider et al. (2006a) Schneider R., Omukai K., Inoue A. K., Ferrara A., 2006a, MNRAS, 369, 1437
- Schneider et al. (2006b) Schneider R., Salvaterra R., Ferrara A., Ciardi B., 2006b, MNRAS, 369, 825
- Sekiguchi & Shibata (2005) Sekiguchi Y., Shibata M., Phys. Rev. D, 2005, 71, 084013
- Seto (2006) Seto N., Phys. Rev. D, 2006, 73, 063001
- Seto (2008) Seto N., 2008, APJ, 683, L95
- http://www.srl.caltech.edu/shane/sensitivity (2001) http://www.srl.caltech.edu/shane/sensitivity
- Shen et al. (1998) Shen H. et al., 1998, Nucle. Phys. A. 637, 435
- Saijo et al. (2002) Saijo M., Baumgarte T. W., Shapiro S. L., Shibata M., 2002, ApJ, 569, 349
- Shibata & Shapiro (2002) Shapiro S. L., Shibata M., 2002, ApJ, 572, L39
- Sathyaprakash & Schutz (2009) Sathyaprakash B. S., Schutz B. F., topical rewiev, arXiv:0903.0338
- Smarr (1977) Smarr L., 1977, Phys. Rev. D, 15, 2069
- Spergel et al. (2007) Spergel D. N. et al., 2007, ApJS, 170, 377
- Suwa et al. (2007a) Suwa Y., Takiwaki T., Kotake K., Sato K., 2007a, APJ 665, L43
- Suwa et al. (2007b) Suwa Y., Takiwaki T., Kotake K., Sato K., 2007b, PASJ, 59, 771
- Tornatore et al. (2007a) Tornatore L., Ferrara, A., Schneider, R. 2007a, MNRAS, 382, 945
- Tornatore et al. (2007b) Tornatore L., Borgani S., Dolag K., Matteucci, F. 2007b, MNRAS, 382, 1050
- Turner (1997) Turner M.S., 1997, Phys. Rev. D., 55, R435
- Woosley & Weaver (1995) Woosley S.E., Weaver T.A., 1995, ApJ, 101, 181
- Volonteri & Rees (2006) Volonteri, M. & Rees, M. J. 2006, ApJ, 650, 669