Starburst and cirrus models for submillimeter galaxies
We present radiative transfer models for submillimeter galaxies with spectroscopic redshifts and mid-infrared spectroscopy from Spitzer/IRS and analyze available Spitzer/MIPS 24, 70 and 160m data. We use two types of starburst models, a cirrus model and a model for the emission of an AGN torus in order to investigate the nature of these objects. We find that for three of the objects (25%) cirrus emission alone can account for the mid-infrared spectrum and the MIPS and submillimeter data. For the remaining objects we find that we need a combination of starburst and cirrus in order to fit simultaneously the multi–wavelength data. We find that the typical submillimeter galaxy has comparable luminosity in the starburst (median ) and cirrus (median ) components. This could arise if the galaxies have been forming stars continuously for the last 250Myr with the star formation occurring in the last 5Myr being shrouded by high-optical-depth molecular cloud dust, whereas the rest of the starlight is attenuated by diffuse dust or cirrus with an of about 1mag.
Key Words.:
galaxies: active - galaxies: evolution - galaxies: starburst infrared: galaxies - dust: - radiative transfer:1 Introduction
The discovery of submillimeter galaxies (SMG) with the SCUBA instrument mounted on the JCMT about a decade ago (Smail et al. 1997, Hughes et al. 1998, Barger et al. 1998), and the realization that most of them are at high redshift (Chapman et al. 2005, Dannerbauer et al. 2004), was of particular significance for studies of galaxy formation and evolution. The implied high bolometric luminosities of the SMGs prompted suggestions that they are distant analogs of local ultra-luminous infrared galaxies (ULIRGs) which emit most of their energy in the far-infrared part of the spectrum.
Over the last decade significant progress has been made in the understanding of SMGs. Ivison et al. (2002) through deep radio mapping of the areas covered by the 8mJy SCUBA survey (Scott et al. 2002) were able to identify the radio and optical counterparts of a significant fraction of the detected SCUBA sources. This allowed the determination of photometric redshifts for the sources using the far-infrared/radio correlation and other methods and the first estimates of their luminosities and star formation rates which are found to be of the order of 1000. Chapman et al. (2005) were able to obtain spectroscopic redshifts for the radio identified sources and determine a median redshift of 2.4. Alexander et al. (2005) studied the X-ray properties of SMGs and concluded that the majority host an AGN which, however, is not luminous enough to dominate the bolometric luminosity.
The diagnostic power of mid-infrared spectroscopy was first recognized by the pioneering ground-based work of Roche et al. (1991). These studies showed that starburst galaxies display emission features that are attributed to PAH molecules whereas these features were absent from the spectra of active galactic nuclei. ISO studies (e.g. Genzel et al. 1998) used mid-infrared spectroscopy to show that ULIRGs are primarily powered by star formation. More recently Spitzer studies extended this work to large samples of infrared galaxies (e.g. Hao et al. 2007, Spoon et al. 2007). The unprecedented sensitivity of the IRS on-board Spitzer made mid-infrared spectroscopy of SMGs possible (Menéndez-Delmestre et al. 2007, Valiante et al. 2007, Pope et al. 2008). The spectra show that SMGs display band emission of polycyclic aromatic hydrocarbon (PAH) molecules and have similar mid-infrared spectra as the local starburst galaxy M82.
In the local Universe, the infrared emission of normal star-forming galaxies can be understood in terms of two components (Rowan-Robinson & Crawford 1989): starburst emission which is associated with optically thick giant molecular clouds illuminated by recently formed stars and cirrus emission which is associated with diffuse and cold dust (K) illuminated by the interstellar radiation field. At a time when spectroscopic redshifts for SMGs were scarce, Efstathiou & Rowan-Robinson (2003; hereafter ERR03) showed that good fits to the spectral energy distributions (SED) of SMGs with radio or millimeter detections could be obtained with pure cirrus models or a combination of cirrus and starburst with the submillimeter dominated by cirrus. The high cirrus models of ERR03 assumed an optical depth and intensity which is a factor of 2-3 higher than the values found in local cirrus galaxies and the interstellar radiation field was assumed to be that of a 250Myr old burst of star formation.
Over the last two decades we have developed fairly sophisticated radiative transfer models for AGN torus (Efstathiou & Rowan-Robinson 1990, 1995), starburst (Rowan-Robinson & Efstathiou 1993, Krügel & Siebenmorgen 1994, Efstathiou et al. 2000, Siebenmorgen & Krügel 2007) and cirrus (Siebenmorgen & Krügel 1992, Efstathiou & Rowan-Robinson 2003). The starburst and cirrus models take into account the effect of small grains and PAH molecules. Starburst models have also been developed by Silva et al. (1998), Takagi et al. (2003) and Dopita et al. (2005). Our cirrus model does not take into account the distribution of dust and stars as the GRASIL (Silva et al. 1998) or the Piovan et al. (2006) models do but it has been shown by ERR03 to give spectra that are in good agreement with the spectral energy distributions of local cirrus galaxies. As we show in section 3, the model is also in very good agreement with observations of cirrus in our own galaxy. Other work on radiative transfer modeling of galaxies has been presented by Bianchi et al (1996), Xilouris et al. (1999) and Popescu et al (2000). Other work on radiative transfer modeling of the torus in AGN has been presented by Pier & Krolik (1992), Granato & Danese (1994), Nenkova et al. (2002, 2008), Dullemond & van Bemmel (2005), Hönig et al. (2006) and Schartmann et al. (2008).
In this paper we use radiative transfer models of starburst, cirrus and AGN torus emission to constrain the properties of SMGs with spectroscopic redshifts and mid-infrared spectroscopy and far-infrared photometry (Sect. 2) from Spitzer. For comparison two different starburst models are applied: an evolutionary model (Efstathiou et al. 2000) that incorporates a stellar population synthesis model and therefore provides information about the stellar population that powers the starburst (Sect. 4) and a hot spot model (Siebenmorgen & Krügel 2007) that is sensitive to the geometry of the dust and stars and therefore provides information about the size of the starburst region (Sect. 5). A flat Universe is assumed with and Hkm/s/Mpc.
2 Observations
Our sample is determined solely by the requirement that the galaxies have been detected in the submillimeter and have mid-infrared spectroscopy from the infrared spectrograph (IRS, Houck et al. 2004) of the Spitzer Space Telescope (SST, Werner et al. 2004). We model all the galaxies in the PAH sample of Menédez-Delmestre et al. (2006), except SMM J221733+001120 which is at low redshift and which is clearly dominated by cirrus emission, and the objects in the sample of Valiante et al. (2007). The data in the sample of Menédez-Delmestre et al. cover the silicate feature and therefore provide information about the extinction in the galaxies but the objects in the sample of Valiante et al., being at higher redshift, do not cover completely the silicate band. In total there are 12 objects spanning a redshift range from 1.2 to 3.4 (Table 1). Besides IRS, ISOCAM (Webb et al. 2003) and submillimeter photometry (Smail et al., 2002, Scott et al., 2006, Ivison et al. 2005, Zemcov et al. 2007) we complement the SED by retrieving all publicly available data of the Spitzer far infrared imager (MIPS, Rieke et al. 2004) of the targets in the three photometric channels centered at 24, 70 and 160m.
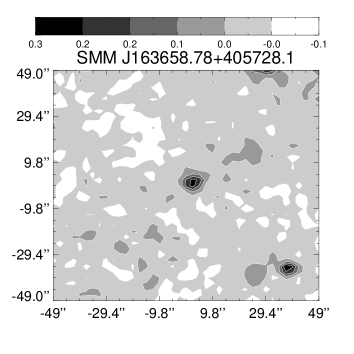
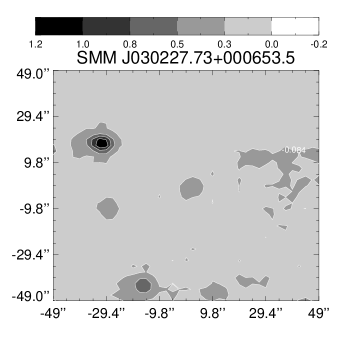
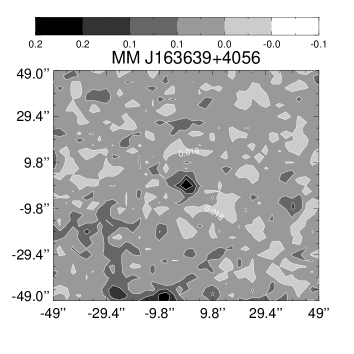
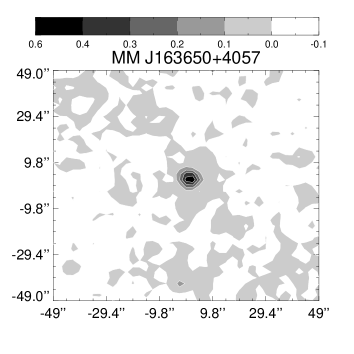
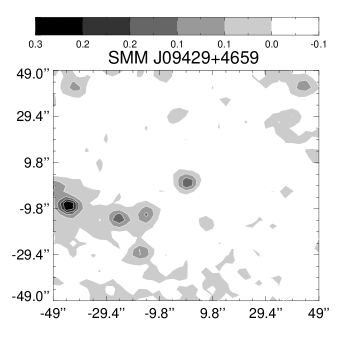
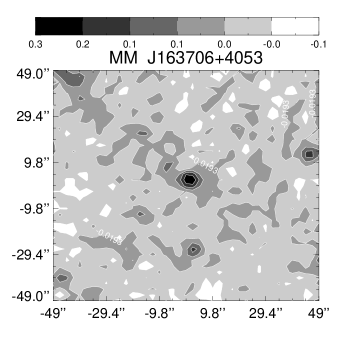
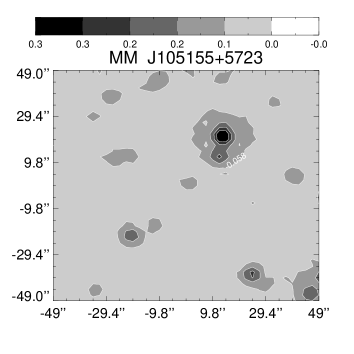
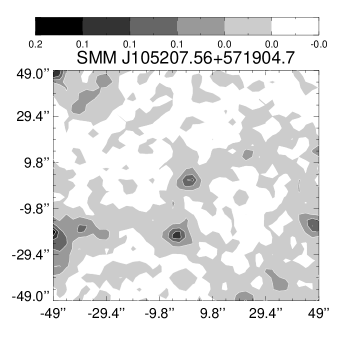
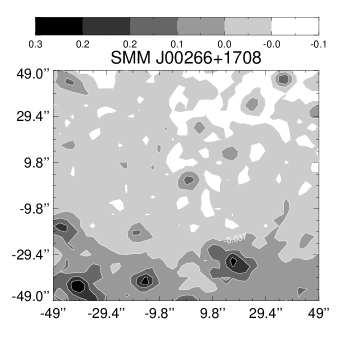
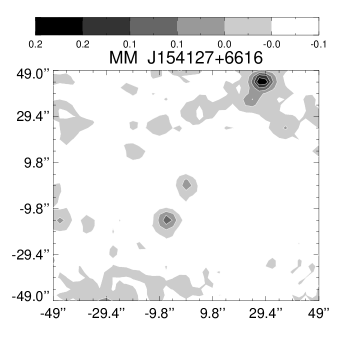
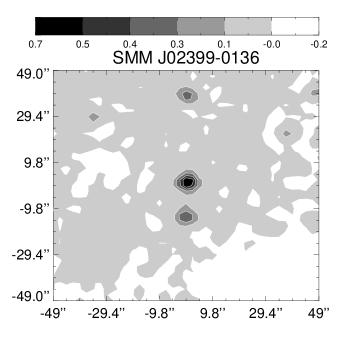
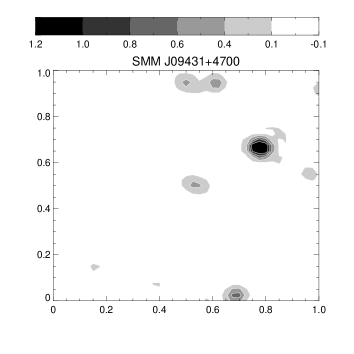
MIPS raw data are processed by the Spitzer pipeline (version S16.1; Gordon et al. 2005) to a flux calibrated mosaic image. The various mosaic images of a particular target and channel and from the different programs and observers are combined to a final image using SWARP111available at: http://terapix.iap.fr/soft/swarp. For the 70 and 160m bands we use the filtered mosaic images of the pipeline (see MIPS Data Handbook). The final image has higher redundancy and signal–to–noise than the one obtained from data of a particular observing sequence. In the 24m band all sources are detected and final images are shown in Fig. 1. In this band SMGs appear well separated from other sources. In the other channels, at 70 and 160m, with the exception of SMM J02399-0136, SMGs remain undetected. The flux is derived using an aperture centered on the first Airy ring and a 2 pixel wide background annulus outside the second Airy ring; colour and PSF correction factors are applied. The photometric error is better than 10%. MIPS photometry of the SMGs is given in Table 1 and agree with IRS. We verified our procedure on the calibration standard star HD106252. For this star all MIPS 24m data are pipeline processed and mosaic images coadded with SWARP to a final image. On this image we measure a flux which is consistent to within 2% with the flux measured by Engelbracht et al. (2007) on the same star.
| Name | 24m | 70m | 160m | |
|---|---|---|---|---|
| SMM J163658.78+405728.1 | 1.2 | 0.45 | 4.9 | 30 |
| SMM J030227.73+000653.5 | 1.4 | 0.23 | 8.8 | |
| MM J163639+4056 | 1.5 | 0.23 | 5.5 | 21 |
| MM J163650+4057 | 2.4 | 1.02 | 5.5 | 22 |
| SMM J09429+4659 | 2.4 | 0.19 | 6.8 | 23 |
| MM J163706+4053 | 2.4 | 0.41 | 5.1 | 17 |
| MM J105155+5723 | 2.7 | 0.18 | 2.2 | 16 |
| SMM J105207.56+571904.7 | 2.7 | 0.24 | 2.0 | 13 |
| SMM J00266+1708 | 2.7 | 0.32 | ||
| MM J154127+6616 | 2.8 | 0.24 | ||
| SMM J02399-0136 | 2.8 | 1.24 | 16 | |
| SMM J09431+4700 | 3.4 | 1.04 | 7.2 | 22 |
† Tentative detection: brightest source pixel appears off from NED position.
3 Cirrus and starburst-only models
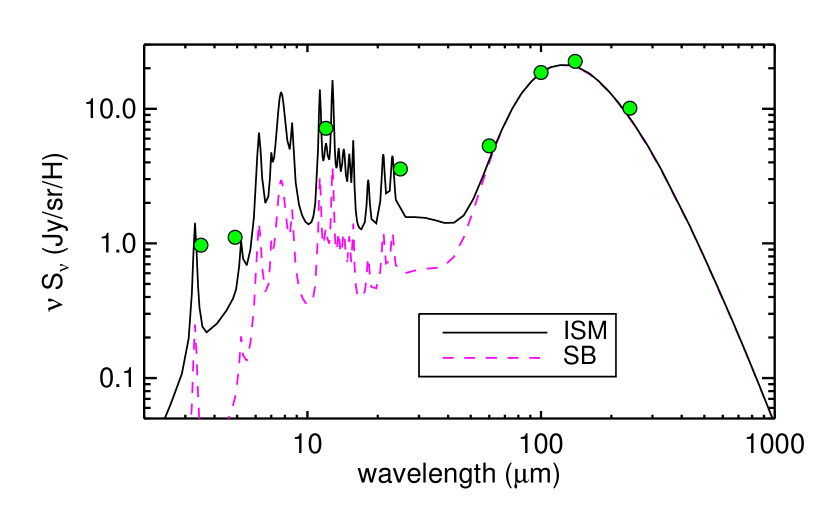
We first compare the data of the galaxies in our sample with pure cirrus and pure starburst models. For the cirrus emission we follow an approach similar to that of ERR03 except that we do not attempt to link the optical-UV emission with the infrared in a self-consistent manner. We first determine the near-infrared to UV spectrum by assuming an age for the galaxy and a star formation history. We use the stellar population synthesis model of Bruzual & Charlot (1993) with a Salpeter IMF and stellar masses in the range 0.1-125. For this study we assume, as in ERR03, an age of 250Myrs and a star formation rate that is constant with time. For the last 5Myrs we assume that the stars are embedded in the molecular clouds in which they formed so they do not contribute to the starlight that is illuminating the cirrus dust. We then use the parameter to scale the spectrum emitted by the stars; is defined to be the ratio of the bolometric intensity of starlight to the bolometric intensity of the interstellar radiation field in the solar neighborhood (Mathis et al. 1983). In Fig. 2 we compare the spectrum emitted by dust that is illuminated by the Mathis et al. interstellar radiation field for the solar neighborhood () with DIRBE data for High Galactic Latitudes (Arendt et al. 1998). To determine the spectrum emitted by the dust we use the latest dust model by Siebenmorgen et al. (2001). It consists of silicate and amorphous carbon grains with a size distribution: , , a population of small graphite grains with , and PAHs. There are small PAHs with and and large PAHs with and , where is the number of C atoms and the number of H atoms of a PAH. By mass 63% of the dust is in silicates and 37% in carbon of which 80% is amorphous, 10% graphitic, 5% in small and 5% in large PAHs. The element abundance, with respect to H, of C and Si in grains is 200ppm and 31ppm, respectively. The gas–to–dust mass ratio, which allows conversion from dust into gas mass, is 125. Such a dust mixture produces a reddening in rough agreement with the standard interstellar extinction curve for and can be considered to be typical for interstellar dust in a quiescent galaxy like our own. However, in the more active environment of a starburst galaxy some of the small grains and PAHs are destroyed by the harder photon and stronger radiation field (e.g. Omont 1986, Leach et al. 1989a,b, Voit 1991, Voit 1992, Rapacioli et al. 2006, Siebenmorgen & Krügel 2009), thus reducing their abundance. Vega et al. (2005) even suggest that all PAHs are destroyed in the molecular clouds that constitute the starburst and that the PAH emission of infrared galaxies arises from cirrus dust. The predicted spectrum of the dust emission that is illuminated by the Mathis et al. interstellar radiation field but with reduced small grain abundances is shown in Fig.2. We consider that for a starburst 5% of carbon in the grains is in small graphites and 2% of C is in PAHs. For the rest of the paper we will assume these parameters of the dust for our cirrus and starburst model.
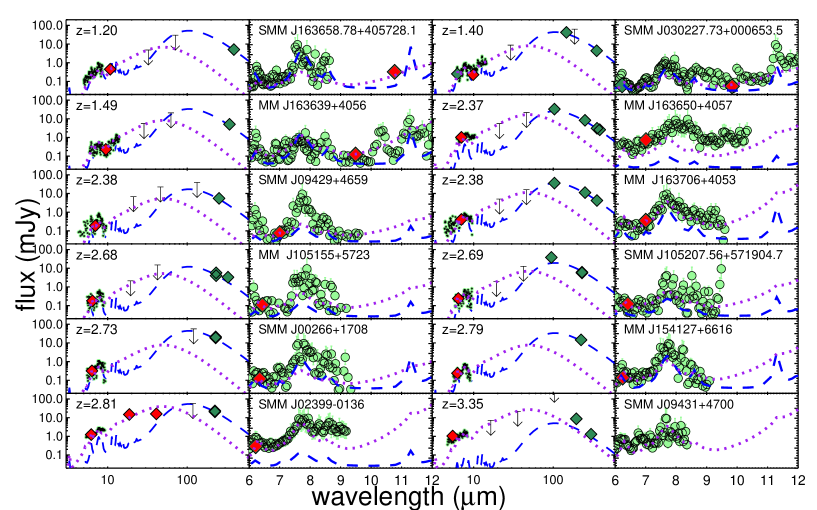
In Fig. 3 we compare our cirrus model with the data of the galaxies in our sample. Clearly we cannot constrain the value of with the presently available far-infrared and submillimeter data. However, in order to be consistent with the finding of Coppin et al. (2008) that most SMGs emit at a temperature of 28K we use . It is important to note that the estimate of Coppin et al. is based on fitting a modified blackbody to the 350 and 850 data whereas our cirrus model considers a distribution of grain species and sizes each with its own temperature. After normalizing the cirrus model to the 850 data point we find that for a couple of the objects (SMM J163658.78+405728.1 at a redshift of 1.2 and MM J163639+4056 at a redshift of 1.5) the cirrus model seems to be adequate for explaining the spectral energy distribution. For SMM J10521+5719 a cirrus model with is also adequate for explaining the SED. For the rest of the objects the model falls short of matching the observed mid-infrared spectrum suggesting either that the PAH abundance is higher than assumed or there is contribution in the mid-infrared from a starburst. In Sect. 4 and 5 we will explore the latter possibility.
In Fig. 3 we also explore the possibility that a starburst alone can explain the complete spectral energy distribution. To do that we take a single starburst spectrum from the SED library of Siebenmorgen & Krügel (2007). We choose a starburst model with a total luminosity of L⊙, a nuclear radius of 3kpc and a visual extinction from the edge to the center of 18mag. For each galaxy this model spectrum is normalized to the mid-infrared observations. It is clear that a starburst-only model falls short of matching the submillimeter photometry by at least an order of magnitude. The model is described in Sect. 5 but it is important to note here that as the starburst radius increases the dust gets colder and the spectrum shifts to longer wavelengths. Starburst models with a radius of 10kpc come close to matching the complete spectral energy distribution but as we discuss in Sect. 6 such extended starbursts are excluded by millimetre interferometry.
4 Evolutionary starburst models
Efstathiou, Rowan-Robinson & Siebenmorgen (2000; hereafter ERRS) presented a starburst model that combined a simple model for the evolution of giant molecular clouds, the stellar population synthesis model of Bruzual & Charlot (1993) and detailed radiative transfer that included the effect of temperature fluctuating small grains with dust particle radius Å and PAHs to account for the detected infrared emission bands (Siebenmorgen & Krügel 1992). An important feature of the ERRS model is that the expansion of the HII region leads to the formation of a narrow shell of gas and dust. This naturally explains the fact that the near- and mid-infrared spectra of starburst galaxies are not dominated by emission from hot large (Å) dust grains but by the PAHs emission. As in ERRS we assume that the initial of the molecular clouds that constitute the starburst is mag but we use the grain model described in Sect. 3. We further assume a constant star formation rate and an age of 5Myr. The assumed starburst age is very poorly constrained by our modeling but as we discuss in section 6 a value of 5Myr can explain the fact that the inferred luinosities of the starburst and cirrus components are comparable.
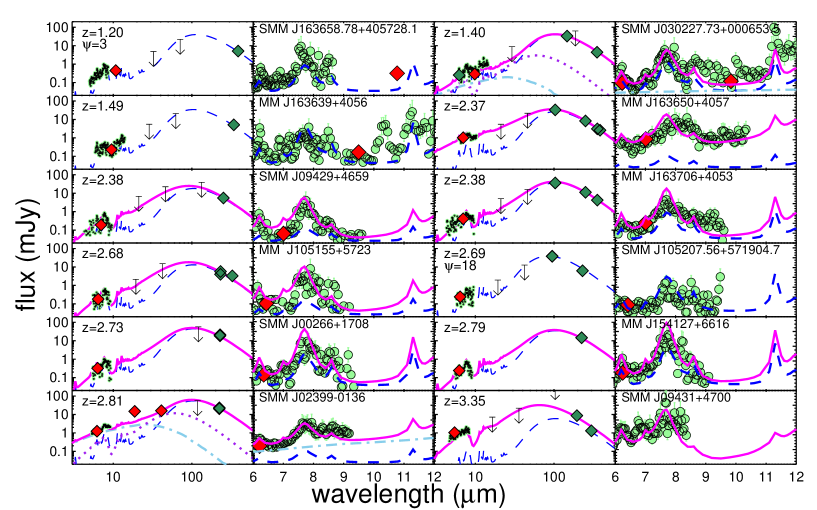
In Fig. 4 we present fits to the galaxies in our sample with a combination of starburst and cirrus. We first normalize the cirrus model at 850 and then scale the starburst model so that the combination of starburst and cirrus gives the best fit to the mid-infrared spectroscopy and is consistent with the far-infrared photometry. As discussed in Sect. 3, for three of the objects we do not need any starburst contribution for explaining the SED. For two of the objects we also find evidence for an AGN component which we model with the tapered discs of Efstathiou & Rowan-Robinson (1995). The more luminous of the two objects (SMM J02399-0136), has been classified as a Seyfert 2 by Smail et al. (2002). SMM J02399-0136 is also the object that has been detected at 70 and 160. The luminosities of the three components and the associated dust masses are given in Table 2. In the ERRS model an increase in the luminosity translates into an increase in the number of molecular clouds that constitute the starburst and therefore the dust mass.
5 Hot spot starburst models
Siebenmorgen & Krügel (2007) presented a starburst model which is an evolution of an earlier model described by Krügel & Tutukov (1978) and Krügel & Siebenmorgen (1994). The model assumes that the stars are divided in two classes: OB stars that are surrounded by dense clouds and constitute so-called hot spots and other stars (old bulge stars or massive stars) that are dispersed in the diffuse medium (see below). The hot spots determine the mid infrared part of the emission spectrum. The outer radius of the hot spots is determined by the condition of equal heating of the dust by the stars and the ambient interstellar radiation field. Both classes of stars are represented in the equation of radiative transfer by continuously distributed source terms. It is assumed that the number density of the hot spots and of the other stars falls off with the radius of the starburst as .
In addition to the dust in the hot spots the model assumes that the volume of the starburst is filled by dust which is uniformly distributed and gives rise to a total extinction from the outer radius of the galactic nucleus to its center. In this homogeneous density model the parameter is directly related to the dust mass and only one of them is independent. The other model parameters are the total luminosity and the starburst radius . The OB stars are assumed to be confined to the central 350pc whereas the bulge stars fill the whole volume.
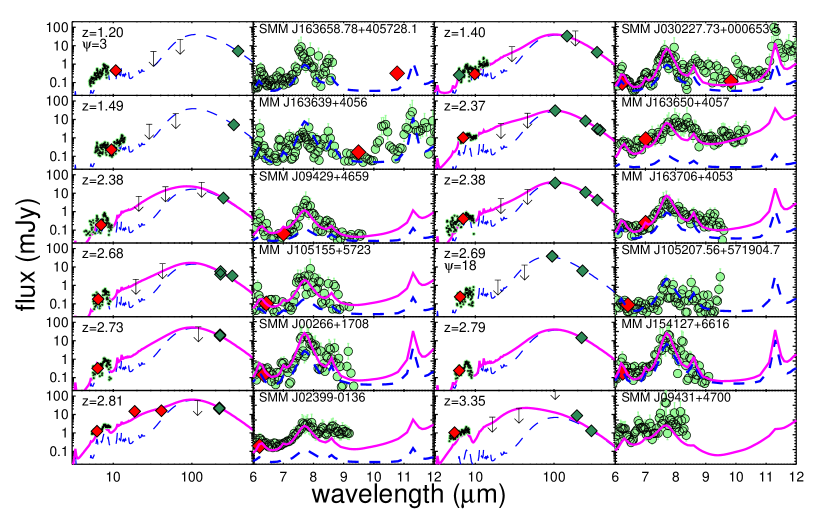
In Fig. 5 we combine starburst models computed with the method of Siebenmorgen & Krügel (2007) with cirrus models and compare them with the data of the objects in our sample. As in the case of the evolutionary models we first normalize the cirrus model at 850. Then we search in the SED library to find a starburst model which, after scaling to the distance of the object but without further normalization, best fit the mid-infrared spectroscopy. The starburst radius is fixed at 3kpc to be consistent with the sizes inferred from interferometry for these galaxies (Sect. 6). Unless otherwise indicated the value of is assumed to be 5 as before.
| Name | Evolutionary models | Hot spot models | |||||
| [L⊙] | [L⊙] | [L⊙] | [M⊙] | [L⊙] | [L⊙] | [mag] | |
| (1) | (2) | (3) | (4) | (5) | (6) | (7) | |
| SMM J163658.78+405728.1 | - | 12.2 | - | 1.3 | - | 12.2 | - |
| SMM J030227.73+000653.5 | 11.7 | 12.2 | 11.3 | 1.5 | 12.0 | 12.3 | 7 |
| MM J163639+4056 | - | 12.3 | - | 1.4 | - | 12.3 | - |
| MM J163650+4057 | 12.8 | 12.4 | - | 2.2 | 12.7 | 12.6 | 9 |
| SMM J09429+4659 | 12.5 | 12.3 | - | 1.5 | 12.5 | 12.4 | 36 |
| MM J163706+4053 | 12.4 | 12.6 | - | 3.0 | 12.4 | 12.7 | 18 |
| MM J105155+5723 | 12.5 | 12.2 | - | 1.3 | 12.3 | 12.4 | 18 |
| SMM J105207.56+571904.7 | - | 12.9 | - | 3.6 | - | 12.9 | - |
| SMM J00266+1708 | 12.5 | 12.8 | - | 4.5 | 12.6 | 12.9 | 36 |
| MM J154127+6616 | 12.4 | 12.7 | - | 3.7 | 12.3 | 12.8 | 36 |
| SMM J02399-0136 | 12.7 | 12.9 | 12.7 | 6.0 | 13.0 | 13.0 | 18 |
| SMM J09431+4700 | 13.2 | 12.0 | - | 0.9 | 13.2 | 12.3 | 18 |
Column (1): starburst luminosity of the evolutionary model. Column (2): cirrus luminosity of the evolutionary model. Column (3): AGN torus luminosity. Column (4): dust mass of the cirrus component. Column(5): starburst luminosity of the hot spot model. Column (6): cirrus luminosity of the hot spot model. Column (7): visual extinction of the hot spot model measured from the surface to the center of the galaxy.
6 Discussion and Conclusions
Since the original suggestion of ERR03 and Kaviani et al. (2003) that SMGs are colder and more extended than local ULIRGs a number of studies have given support to this idea. Rowan-Robinson et al. (2004) discovered a number of luminous cirrus galaxies in the ELAIS survey. Chapman et al. (2004) found that the majority of SMGs in their sample are more extended in the radio than local ULIRGs. This finding was confirmed by Biggs & Ivison (2008) who found a median size of 5kpc for the SMGs in their sample. However, Tacconi et al. (2006) showed that the SMGs in their sample cannot be more extended than kpc.
The evolutionary starburst model of ERRS does not make a prediction about the size of the starburst but a lower limit can be obtained by calculating the minimum volume needed to contain the molecular clouds that constitute it. As noted by ERRS a molecular cloud illuminated by a 10Myr old instantaneous burst has a luminosity of and a radius of 50pc. The minimum radius of the sphere that is needed to contain a starburst of luminosity is therefore kpc. So for a ULIRG with a luminosity of , the radius is kpc. A plausible geometry for SMGs is therefore a region of kpc radius filled with diffuse dust and in which an ensemble of molecular clouds is embedded.
Kovács et al. (2006) reported 350m observations of SMGs which suggest that they are colder (mean temperature K) than local ULIRGs. This was confirmed by Coppin et al. (2008) who reported 350m observations of SMGs found in the SHADES survey. In fact Coppin et al. find that most SMGs in their sample are actually even colder (28K).
Clements et al. (2008) presented spectral energy distributions of SMGs detected in the SHADES survey and for which there are also supplementary optical and Spitzer data. They found that out of the 33 sources in their sample 8 can be fitted by a cirrus template whereas most of the other sources can be fitted by an Arp220 template. The fraction of cirrus dominated galaxies is therefore in good agreement with our estimate. The problem with the Arp220 interpretation for the other objects, however, is that none of the objects with mid-infrared spectroscopy from Spitzer show the deep silicate absorption features characteristic of the Arp220 template.
Pope et al. (2008) presented mid-infrared spectroscopy from Spitzer for a sample of 13 sources in the GOODS field. They find that the spectroscopy cannot be fitted with an Arp200-type template but instead the average spectrum can be fitted by an M82-type one.
Farrah et al. (2008) presented mid-infrared spectra of high-redshift ULIRGs in a very narrow redshift range of . The ULIRGs in the sample of Farrah et al. show mid-infrared spectra similar to local starburst galaxies which are two or more orders of magnitude less luminous in the infrared. Farrah et al. suggest that one of the most likely interpretations of their result is that star formation in the ULIRGs of their sample is extended on scales of 1-4kpc which is similar to the sizes of SMGs observed with radio or millimeter interferometry.
The median dust mass we derive for the cirrus component is . For comparison Coppin et al. find a median value of but note that most of the difference can be attributed to a factor of three difference in the assumed absorption coefficient in the submillimeter. As can be seen from Table 2 the luminosities in the starburst and cirrus components are comparable.
The picture we are proposing for SMGs is the following: We assume that stars have been forming continuously in the galaxy for the last 250Myr. Our assumption about the age of the galaxies is in agreement with the estimate of Tacconi et al. (2008). We further assume that the stars that formed in the last 5Myr are still embedded in the molecular clouds in which they formed. Using Bruzual & Charlot (1993) models with a star formation rate of /yr we find that the bolometric luminosity of the 5Myr old starburst is whereas the luminosity of the rest of the stars, which are between 5 - 250Myr old, is . Assuming that the optical/UV radiation emitted by the 5-250Myrs old stellar population is obscured by dust with an of 1mag, and that all the energy absorbed in the optical/UV is re-radiated at a temperature of 28K, this gives a cold dust luminosity of . So this explains the fact that the derived luminosities of the starburst and cirrus components are comparable. The median of the log of luminosities of the cirrus component of the 12 galaxies (in solar units) is 12.4 for the evolutionary models and 12.6 for the hot spot models. The star formation rate for the typical galaxy is therefore /yr which is in good agreement with the estimates of Ivison et al. (2002). It is interesting to note that the timescale we infer for the molecular cloud phase of star formation is similar to the value found by Granato et al. (2000) and Efstathiou & Rowan-Robinson (2003) for normal quiescently star-forming galaxies.
The analysis presented in this paper is clearly limited by the lack of data in the rest-frame far-infrared where both the starburst and cirrus components peak. Measurements with Herschel, whose launch is now imminent, will allow us to test the model outlined above. They will allow us in particular to put a stronger constraint on the intensity of starlight in the case of the cirrus component and possibly differentiate between the two starburst models considered in this paper.
Acknowledgments
We thank Karín Menéndez-Delmestre and Elisabeta Valiante for providing the spectra of the SMGs in electronic form, Andreas Seifahrt for introduction to SWARP and Helmut Dannerbauer for his comments on an earlier draft of this work.
References
- (1) Alexander D.M., Bauer F.E., Chapman S.C., Smail I., Blain A.W., Brandt W.N., Ivison R.J., 2005, ApJ, 632, 736.
- (2) Arendt R.G., et al. 1998, ApJ, 508, 74
- (3) Barger A.J., Cowie L.L., Sanders D.B., Fulton E., Taniguchi Y., Sato Y., Kawara K., Okuda H., 1998, Nature, 394, 248
- (4) Bianchi S., Ferrara A., Giovanardi, C., 1996, ApJ, 465, 127.
- (5) Biggs A.D., & Ivison R.J., 2008, MNRAS, 385, 893.
- (6) Bruzual A.G., & Charlot S., 1993, ApJ, 405, 538
- (7) Chapman S.C., Smail I., Windhorst R., Muxlow T., Ivison R.J., 2004, ApJ, 611, 732.
- (8) Chapman S.C., Blain A.W., Smail I., Ivison R.J., 2005, ApJ, 622, 772.
- (9) Clements D.L., et al., 2008, MNRAS, 387, 247.
- (10) Coppin K., et al., 2008, MNRAS, 384, 1597.
- (11) Dannerbauer H., Lehnert M.D., Lutz D., Tacconi L., Bertoldi F., Carilli C., Genzel R., Menten K.M., 2004, ApJ, 606, 664.
- (12) Dopita M.A., Groves B.A., Fischera J., Sutherland R.S., Tuffs R.J., Popescu C.C., Kewley L.J., Reuland M., Leitherer C., 2005, 619, 755.
- (13) Dullemond C.P., van Bemmel I.M., 2005, A&A, 436, 47.
- (14) Efstathiou A., & Rowan-Robinson M., 1990, MNRAS, 245, 275.
- (15) Efstathiou A., Rowan-Robinson M. 1995, MNRAS, 273, 649.
- (16) Efstathiou A., Rowan-Robinson M., & Siebenmorgen R., 2000, MNRAS, 313, 734
- (17) Efstathiou A., Rowan-Robinson M. 2003, MNRAS, 343, 322
- (18) Engelbracht C.W., Blaylock M., Su K.Y.L., et al., PASP 119, 994
- (19) Farrah D., Lonsdale C.J., Weedman D.W., Spoon H.W.W., Rowan-Robinson M., Polletta M., Oliver S., Houck J.R., Smith H.E., 2008, ApJ, 677, 957.
- (20) Genzel R., Lutz D., Sturm E., Egami E., Kunze D., Moorwood A.F.M., Rigopoulou D., Spoon H.W.W., Sternberg A., Tacconi-Garman L.E., Tacconi L., Thatte N., 1998, ApJ, 498, 579.
- (21) Gordon K.D., Rieke G.H., Engelbracht C.W., et al., 2005, PASP, 117, 503
- (22) Granato G.L., Danese L. 1994, MNRAS, 268, 235
- (23) Granato G.L., Lacey C.G., Silva L., Bressan A., Baugh C.M., Cole S., Frenk C.S. 2000, ApJ, 542, 710.
- (24) Greve T.R., Ivison R.J., Bertoldi F., Stevens J.A., Dunlop J.S., Lutz D., Carilli C.L., 2004, MNRAS, 354, 779
- (25) Hao L., Weedman D.W., Spoon H.W.W., Marshall J.A., Levenson N.A., Elitzur M., Houck J.R., 2007, ApJL, 655, 77.
- (26) Hönig S.F., Beckert T., Ohnaka K., Weigelt, G., 2006, A&A, 452, 459.
- (27) Hughes D.H., Serjeant S., Dunlop J., Rowan-Robinson M., Blain A., Mann R.G., Ivison R., Peacock J., Efstathiou A., Gear W., Oliver S., Lawrence A., Longair M., Goldschmidt P., Jenness T., 1998, Nature, 394, 241.
- (28) Houck J.R., Roellig T.L., van Cleve et al. 2004, ApJS, 154, 18
- (29) Ivison, R.J., et al., 2002, MNRAS 337, 1.
- (30) Ivison R.J., Smail I., Dunlop J.S., et al., 2005, MNRAS 364, 1025
- (31) Kovács A., Chapman S., Dowell C.D., Blain A., Ivison R., Smail I., Phillips T.G., 2006, ApJ, 650, 592.
- (32) Kaviani A. Haehnelt M.G. Kauffmann G., 2003, MNRAS, 340, 739.
- (33) Krügel E., & Tutukov A.V., 1978, AA, 63, 375.
- (34) Krügel E., & Siebenmorgen R., 1994, AA, 288, 929.
- (35) Leach S., Eland J.H.D., Price S.D., 1989a, J. Phys. Chem. 93, 7575
- (36) Leach S., Eland J.H.D., Price S.D., 1989b, J. Phys. Chem. 93, 7583
- (37) Mathis J.S., Mezger P.G., Panagia N., 1983, A&A, 128, 212.
- (38) Menéndez-Delmestre K., Blain A.W., Alexander D.M., Smail I., Armus L., Chapman S.C., Frayer D.T., Ivison R.J., Teplitz H.I., 2007, ApJ, 655, L65.
- (39) Nenkova M., Ivezic Z., Elitzur M., 2002, ApJ, 570, L9.
- (40) Omont A., 1986, A&A 166, 159
- (41) Pier E. A., Krolik J. H., 1992, ApJ, 401, 99
- (42) Piovan L., Tantalo R., Chiosi C., 2006, MNRAS, 366, 923.
- (43) Pope A., Chary R., Alexander D.M., Armus L., Dickinson M., Elbaz D., Frayer D., Scott D., Teplitz H., 2008, ApJ, 675, 1171.
- (44) Popescu C.C., Misiriotis A., Kylafis N.D., Tuffs R.J., Fischera J., 2000, A&A, 362, 138.
- (45) Rapacioli M., Calvo F., Joblin C., et al., 2006, A&A 460, 519
- (46) Rieke G.H., et al., 2004, ApJS 154, 25
- (47) Roche P.F., Aitken D.K., Smith C.H., Ward M.J., 1991, MNRAS, 248, 606.
- (48) Rowan-Robinson M., & Crawford J., 1989, MNRAS, 238, 523.
- (49) Rowan-Robinson M., & Efstathiou A., 1993, MNRAS, 263, 675.
- (50) Rowan-Robinson M., et al., 2004, MNRAS, 351, 1290.
- (51) Schartmann M., Meisenheimer K., Camenzind M., Wolf S., Tristram K.R.W., Henning T., 2008, A&A, 482, 67.
- (52) Scott S.E., et al., 2002, MNRAS, 331, 817.
- (53) Scott S. E., Dunlop J.S., Serjeant S., 2006, MNRAS 370, 1057
- (54) Siebenmorgen R., & Krügel E., 1992, AA, 259, 614.
- (55) Siebenmorgen R., & Krügel E., 2007, AA, 461, 445.
- (56) Siebenmorgen R., Krügel E., Laureijs R.J., 2001, AA, 377, 735.
- (57) Silva L., Granato G.L., Bressan A., Danese L., 1998, ApJ, 509, 103.
- (58) Smail I., Ivison R.J. Blain A.W., 1997, ApJ, 490, L5.
- (59) Smail I., Ivison R.J., Blain A.W., Kneib J.-P., 2002, MNRAS, 331, 495.
- (60) Spoon H.W.W., Marshall J.A., Houck J.R., Elitzur M., Hao L., Armus L., Brandl B.R., Charmandaris V., 2007, ApJL, 654, 49.
- (61) Tacconi L.J., et al., 2006, ApJ, 640, 228.
- (62) Tacconi L.J., et al., 2008, ApJ, 680, 246.
- (63) Takagi T., Arimoto N., Hanami H., 2003, MNRAS, 340, 813
- (64) Valiante E., Lutz D., Sturm E., Genzel R., Tacconi L.J., Lehnert M.D., Baker A.J. 2007, ApJ, 660, 1060
- (65) Vega 0., Silva L., Panuzzo P., Bressan A., Granato G.L., Chavez M., 2005, MNRAS, 364, 1286.
- (66) Voit G.M., 1991, ApJ 379, 122
- (67) Voit G.M., 1992, MNRAS 258, 841
- (68) Webb T.M., Eales S.A., Lilly S.J., et al., 2003, ApJ 587, 41
- (69) Werner M.W., Roellig T.L., Low F.J., Rieke G.H., Rieke M., et al. 2004, ApJSupp, 154, 1
- (70) Xilouris E. M., Byun Y.I., Kylafis, N.D., Paleologou E.V., Papamastorakis J., 1999, A&A, 344, 868.
- (71) Zemcov M., Borys C., Halpern M., Mauskopf P., Scott D., 2007, MNRAS 376, 1073